Someone else who mercilessly dissects the bungling of the gentlemen eminent medics is Dennis Zeilstra on Twitter. See this 'thread'. For those who don't want to/sit/can't go on Twitter, I have copied his text in full below.
He writes:
There has been a big mismatch since Nov 3! Either estimated R is wrong, or the model, or both.
Kuipers made a prediction on Oct 14 of the number of occupied ZH beds (exc IC) based on different R-numbers. I put the data from the dashboard underneath.
What do we see in the merged graphs? The estimated R-number has been hovering around 1 for a long time:
- On Oct 6 it was 1.1
- On Oct 19 it came below 1
- Off-peak was 0.82 on Oct 27. -On Nov 3 (peak occupied beds) it was 0.9.
- Most recent (Nov 13) it is 1.04.
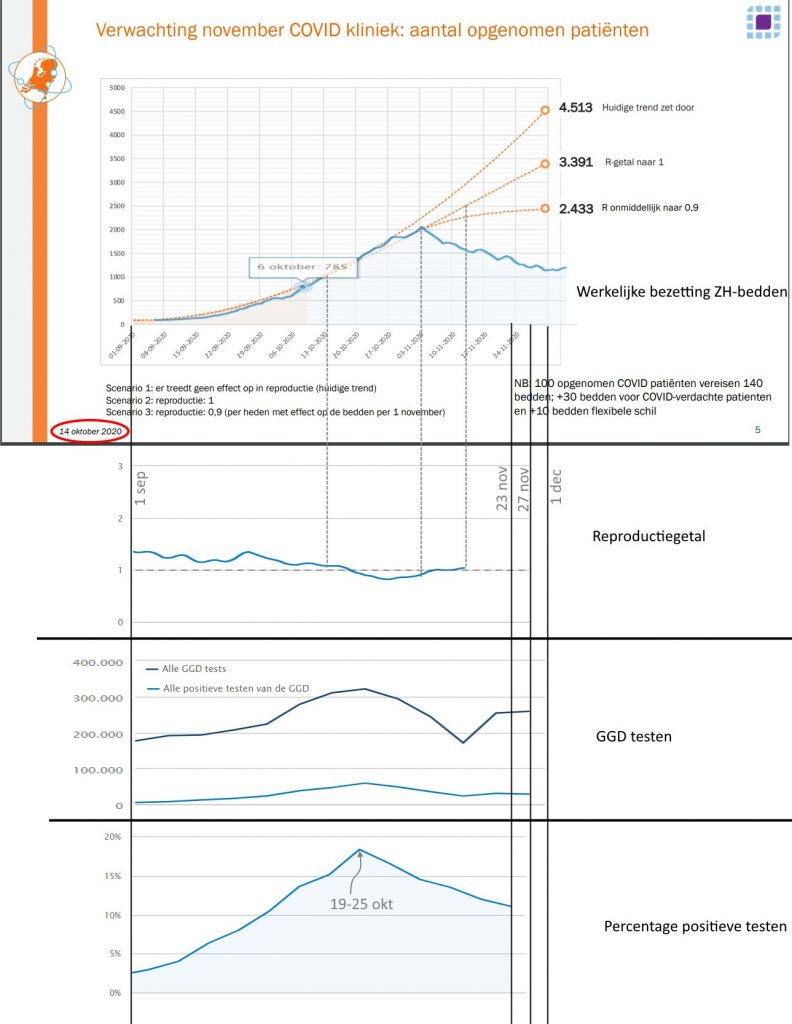
Kuipers predicted the bottom orange line at R of 0.9. It would only reach a peak today at about 2500.
- The reality is that the number of occupied beds has been continuously decreasing since Nov 3, despite estimated R around 1.
- Number of occupied beds is now less than half (!) of the prediction.
Recurring problem: models on which C19 policy is based are *not* validated. A shame in applied fields (such as aerospace), but apparently acceptable to govern a country with. A model can produce all kinds of outcomes, but do they mean anything?
In this case, the mismatch can also be in the estimated R, because the most recent data is less reliable. The mismatch with R applies to Nov 3-13, and the R estimate may be wrong. The dashboard data has also often proven to be unreliable in the past, which can cause a mismatch.
Nevertheless, both the number of occupied beds and the number of positive tests show a downward trend up to and including the latest known data (7Dec and 23 Nov respectively). But Kuipers indicates that relaxation is not possible: https://www.nu.nl/284801/video/live-kuipers-geeft-update-over-coronasituatie-in-ziekenhuizen.html Is this based on an unvalidated model?
Take a look at the graph in today's press conference. It looks very different from the graph of 14Oct, but uses almost identical R of 0.92. How reliable is the current expectation if (1) the model of 14okt does not fit the data and (2) the model is now very different?
I would like to call for the validity of the models to be questioned sharply! In my opinion, all this shows that the models show defects cq. misused or interpreted. Before any decisions are made about the continuation of the half lockdown, I would like to call on the House of Representatives to question the validity of the models sharply! In my opinion, this thread shows that the models show defects cq. misused or interpreted.