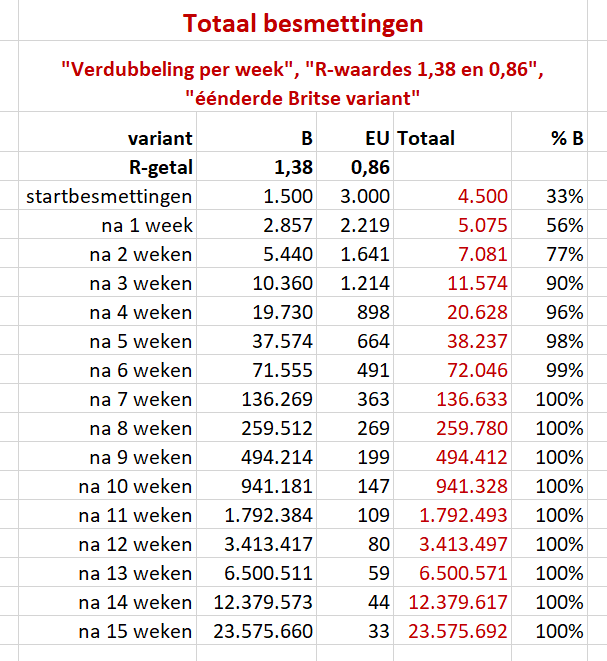
Please do the math with the model. For the sake of convenience, we calculate with 4500 infections and compare the percentages with the latest measurements and with the predictions of the RIVM/Omt/RijksOverheid (Roro).
Given by roro
- B-variant: doubling per week – communicated by roro, R=1.38
- EU variant: minus 25% per week – ditto, R=0.86
- Stated: 4500 infections of which Last week 50% B variant, 50 EU variant- According to RoRo
- Distribution of infections this week approx. 67/33% – According to RoRo: two-thirds to one-third
Model
- So calculated for This week = total 5000 infections, next week 7000.
- This increase from 5000 to 7000 represents a growth of 40% in one week.
- The distribution should have become 77% to 23%, rather three-quarters/one-quarter.
Reality
- The calculated 77%/23% should already be roughly three-quarters/one-quarter, not two-thirds/one-third as stated by the government. They have missed a golden opportunity to make the matter even more worrisome.
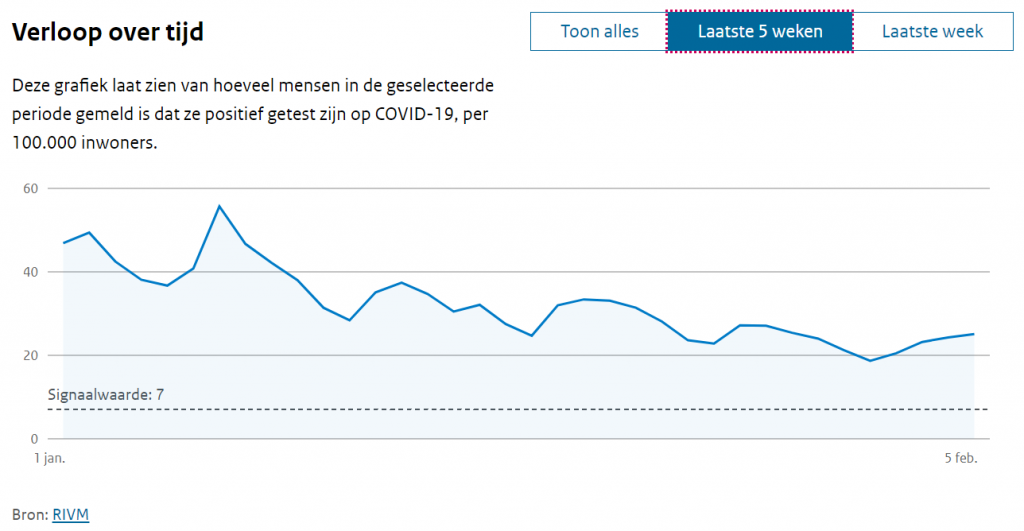
- The infection rates are not increased by 40%, not by a long shot. Even if we correct for the 22% reduction in testing, we will not achieve the promised increase. On the contrary: the figures have fallen.
- The measures cannot be the measures because then the R-values would have to be substantially lower. After all, they reflect how effective the measures are, so they are already priced in.
Well. That the R-number is not quite right or the distribution B/EU is not correct, that is all possible. But the fact that the figures do not match each other suggests the worst. Do they already realize that it is going to get better this summer? Or is it still not a 'seasonal virus'?
In short
- The predicted total increase this week has not taken place (decrease instead of increase).
- The fact that the total is not rising cannot be explained by the fact that the British variant 'does not yet have the upper hand' (Kuipers)
- The R number does not match the predicted numbers (British share is more likely to be three-quarters than two-thirds).
- The case is even more serious than that: according to the R-values, almost three-quarters of all infections should drive on the left. Not so.

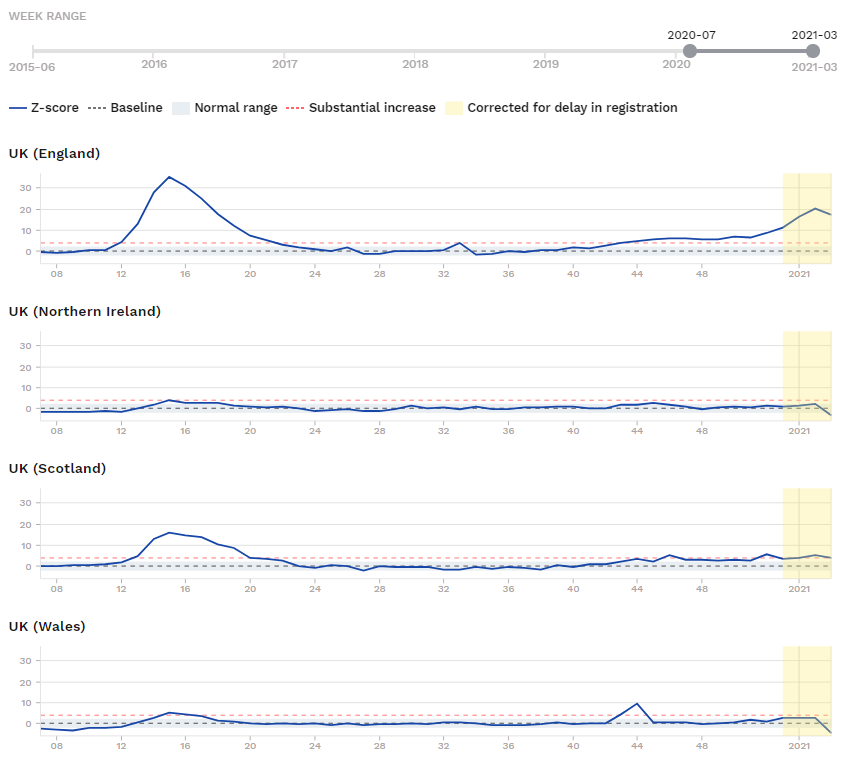
Trouwens: Brits?
Je bedoelt Engels!
“Brits” verwijst naar de UK. Maar kijk eens naar de z-scores van de diverse landen van de United Kingdom. De enige die enorm boven de normaalwaardes uitkomt is Engeland. Althans volgens Our World in Data.