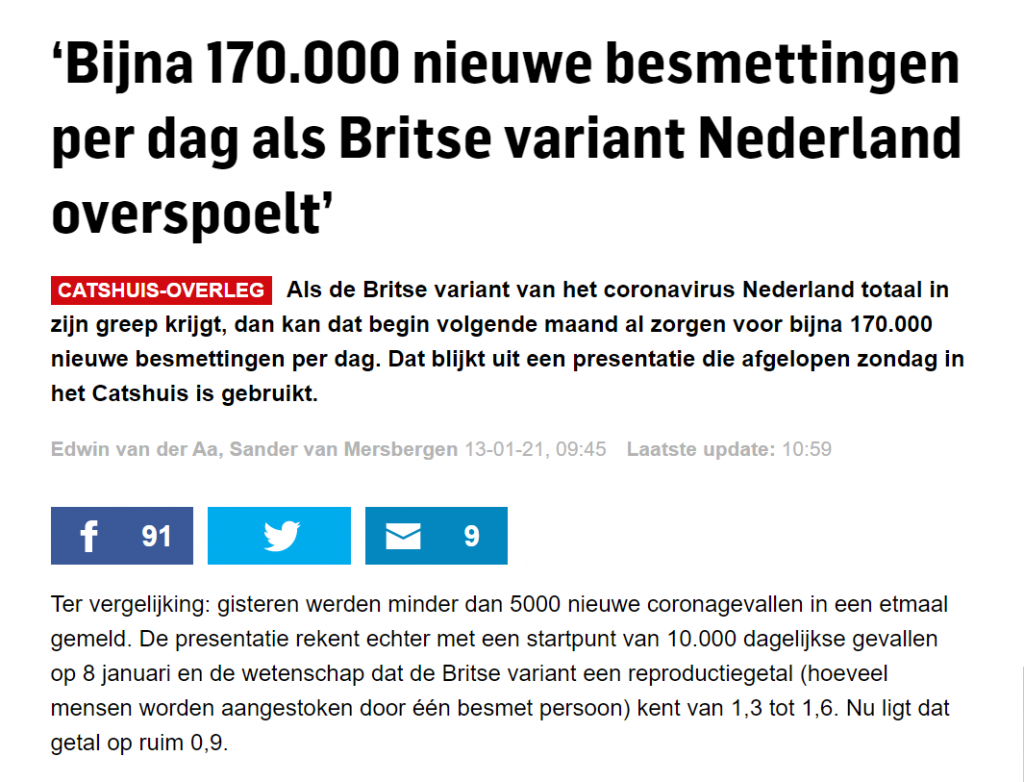
Wow, we have suddenly adhered well to the measures! If the British variant were to prevail, we would now be at 170,000 infections per day, remember?
Van Dissel said that at least a month ago in the AD. Dennis Zeilstra calls that a factor of 10 too high on Twitter. It is now even a factor of 40 too high.

A little over a week ago, the RIVM already confirmed that the time had come with that upper hand. the 50% must have been well passed by now, as anyone who saw Kuipers enthusiastically teaching with Thijs van den Brink knows, about material that he himself did not master very well. "The number of British infections is doubling per week," OMT members reported.
A few days ago I posted a table about those rattling predictions ( also on FB ). Probably too straightforward and simple, but unambiguous. The 'starting point' of the model mentioned in the AD is week 3 in my table. A good month later you are indeed at 170,000. However, the number of infections is now about 4000, not 170,000.
The trend remains slightly downward and no matter what van Dissel tries, he cannot get it up. That can only be because we have followed the rules better than expected. Of course, it never indicates incoherent calculations by the RIVM... J
Jaap can be as happy as he is with the 'outcome' of a 'model' - the more threatening the more cautious - but if he does not check whether the calculations do not produce a grab bag of contradictions, he drives himself and others crazy and loses all credibility β or has already lost it for many.
The starting point of the model is January 8 with 10,000 per day. However, there were 7,500 on January 8 (so why 10,000?).
The historical overview of the 'infections' (now: 'positive tests'!) has disappeared from the RIVM site. No chocolate to be made of course. At least they now report percentage of positive tests and total number of tests.
Looking back at the figures can still be done on e.g. bddataplan.nl (scroll down)

