In Nederland zijn we vastgelopen met het verklaren van duizenden overlijdens. De data worden geheim gehouden en geredigeerd alvorens ze worden vrijgegeven. We zullen waarschijnlijk nooit te weten komen hoe het zit. In meer vrije landen dan het onze gaat het anders, bijvoorbeeld in de Amerikaanse staat Massachussets. Naar aanleiding van een WOB-verzoek zijn daar de overlijdensaktes van de afgelopen 7 jaar openbaar gemaakt. Joël Smalley deed een analyse.
Hieronder de vertaling van het artikel. Onder het artikel een nawoord met wat ik ervan heb opgestoken en in hoeverre we dit op de Nederlandse situatie kunnen betrekken.
Tijdens de COVID-pandemie hebben we gepleit voor gegevens van goede kwaliteit, zodat compromisloze analisten zoals ik (Joël Smalley) onafhankelijk onderzoek kunnen doen als tegenwicht tegen bestaande narratieven. Dit is de absolute essentie van goede wetenschap en empirisch onderbouwde besluitvorming.
Eindelijk hebben we nu, als resultaat van een FOIA [het Amerikaanse equivalent van een WOB-verzoek, red.] toegang tot zeven volledige jaren van volledige overlijdensakten voor de staat Massachusetts, VS.
Dit zijn mijn inzichten.
| Joel SmalleyJoel Smalley – vertaald van https://metatron.substack.com/p/the-definitive-guide-to-covid-and |
Classificaties
- SEPSIS
- KANKER
- NEURODEGENERATIEVE ZIEKTEN (Parkinson, Alzheimer, Dementie)
- CARDIOVASCULAIR
- ADEMHALING
- ORGAANFALEN (lever-, nier-, gastro-intestinaal, multisysteemorgaanfalen, groeiachterstand)
- MISADVENTURE (overdosis drugs, hangen)
COVID-19
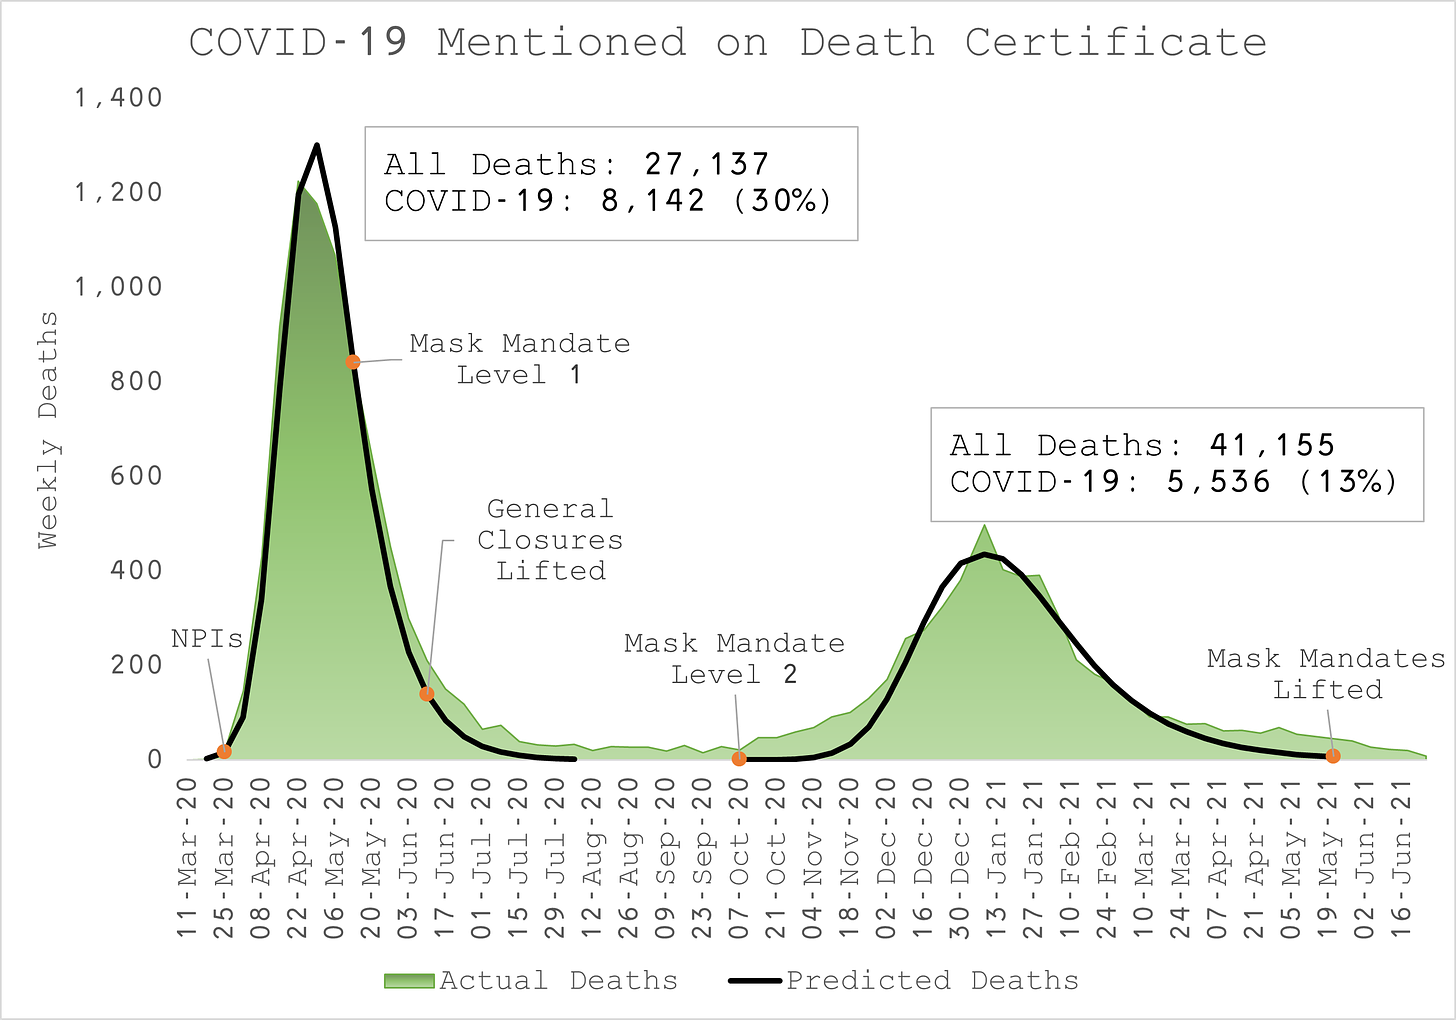
- De COVID-19 epidemie in Massachusetts diende zich aan op 18 maart 2020 en werd 17 weken later op 15 juli-20 beëindigd (Figuur 1). In die tijd vertegenwoordigden de sterfgevallen waarbij COVID-19 op de overlijdensakte werd vermeld (dus niet noodzakelijk de primaire doodsoorzaak), 30% van alle sterfgevallen.
- De staat heeft op 25 maart 2020 een breed scala aan niet-farmaceutische interventies (NPI’s) ingevoerd, waaronder algemene bedrijfssluitingen (winkels, bars en restaurants) en een verbod op bijeenkomsten. In theorie hadden deze NPI’s ervoor moeten zorgen dat de verdeling van de werkelijke COVID-19-sterfgevallen kleiner zou zijn dan de sterfgevallen die worden voorspeld door een Gompertz-functie. Dat is duidelijk niet het geval. Geen van deze NPI’s had enige impact op de sterfte door COVID-19. Alle sterfgevallen die we zouden hebben conform die functie, hebben plaatsgevonden.
- Op 17 april-20 heeft de staat een mandaat ingevoerd voor iedereen om een masker te dragen wanneer ze buitenshuis zijn in de nabijheid van anderen. Sinds dat mandaat is de daling van het aantal COVID-19-sterfgevallen eerder vertraagd dan versneld, terwijl een versnelde daling het beoogde resultaat van het beleid was.
- Op 10-jun-20 werden de algemene sluitingen opgeheven. Er was daarna geen duidelijke stijging van het aantal COVID-19-sterfgevallen zoals voorspeld door de epidemiologische modellen. In feite bleef het verloop van de sterfte aan COVID-19 door natuurlijke oorzaken (temporele kudde-immuniteit en seizoensinvloed) tot nul dalen.
- Op 7 oktober-20 werd het maskermandaat, dat van kracht was gebleven, uitgebreid naar buitenshuis, ongeacht de locatie of de aanwezigheid van andere mensen. Onmiddellijk, op dat moment, begon de sterfte aan COVID-19 weer te stijgen. Dit is eerder een seizoensgebonden heropleving dan gevolg van het volledig ineffectieve maskermandaat. Deze golf van COVID-19-sterfte duurde 32 weken tot 19 mei-21, maar er waren 40% minder sterfgevallen dan de lentegolf, wat neerkomt op 13% van alle sterfgevallen in die periode.
- Op 19 mei-21 werd het maskermandaat opgeheven, maar er was geen daaropvolgende heropleving van de COVID-19-sterfte die zou worden verwacht als het maskermandaat effectief was geweest. Het is waarschijnlijker dat de uitbraak van COVID-19 opnieuw eindigde vanwege tijdelijke kudde-immuniteit en seizoensinvloeden.
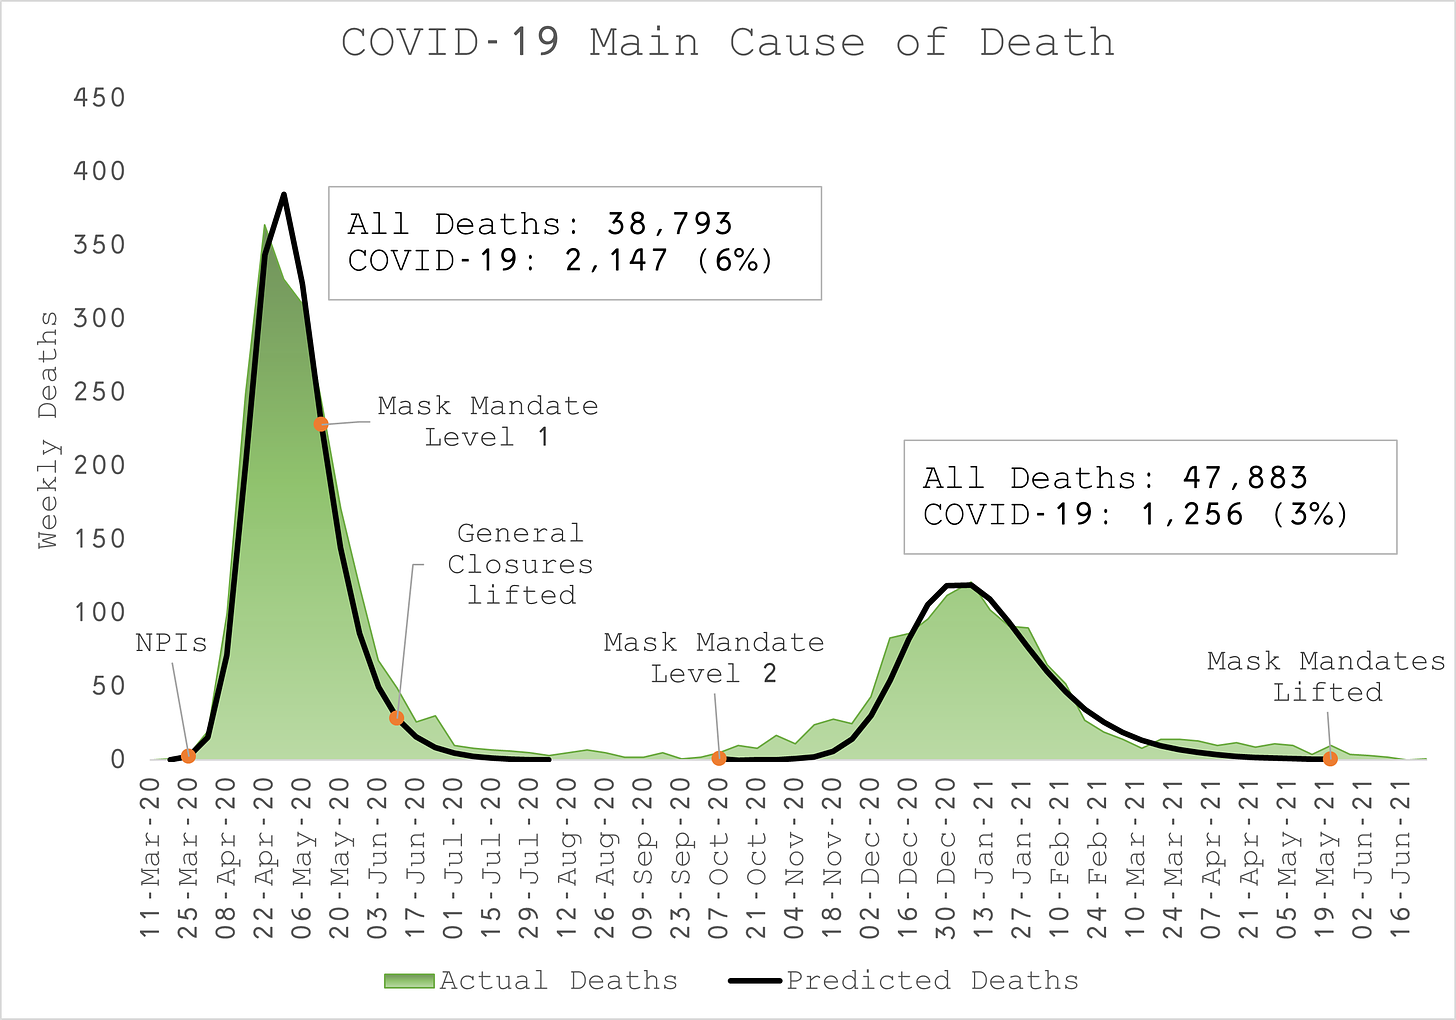
- De verdeling van sterfgevallen waarbij COVID-19 als hoofdoorzaak werd toegeschreven, volgt exact hetzelfde patroon als die waarbij COVID-19 werd vermeld op de overlijdensakte (Figuur 2).
- Omgekeerd vertegenwoordigde COVID-19 slechts 6% van alle sterfgevallen tijdens de voorjaarsepidemie en 3% tijdens de seizoensterugkeer van de herfst van 2020 tot en met de lente van 2021.
Sterfgevallen van 5 tot 11-jarigen
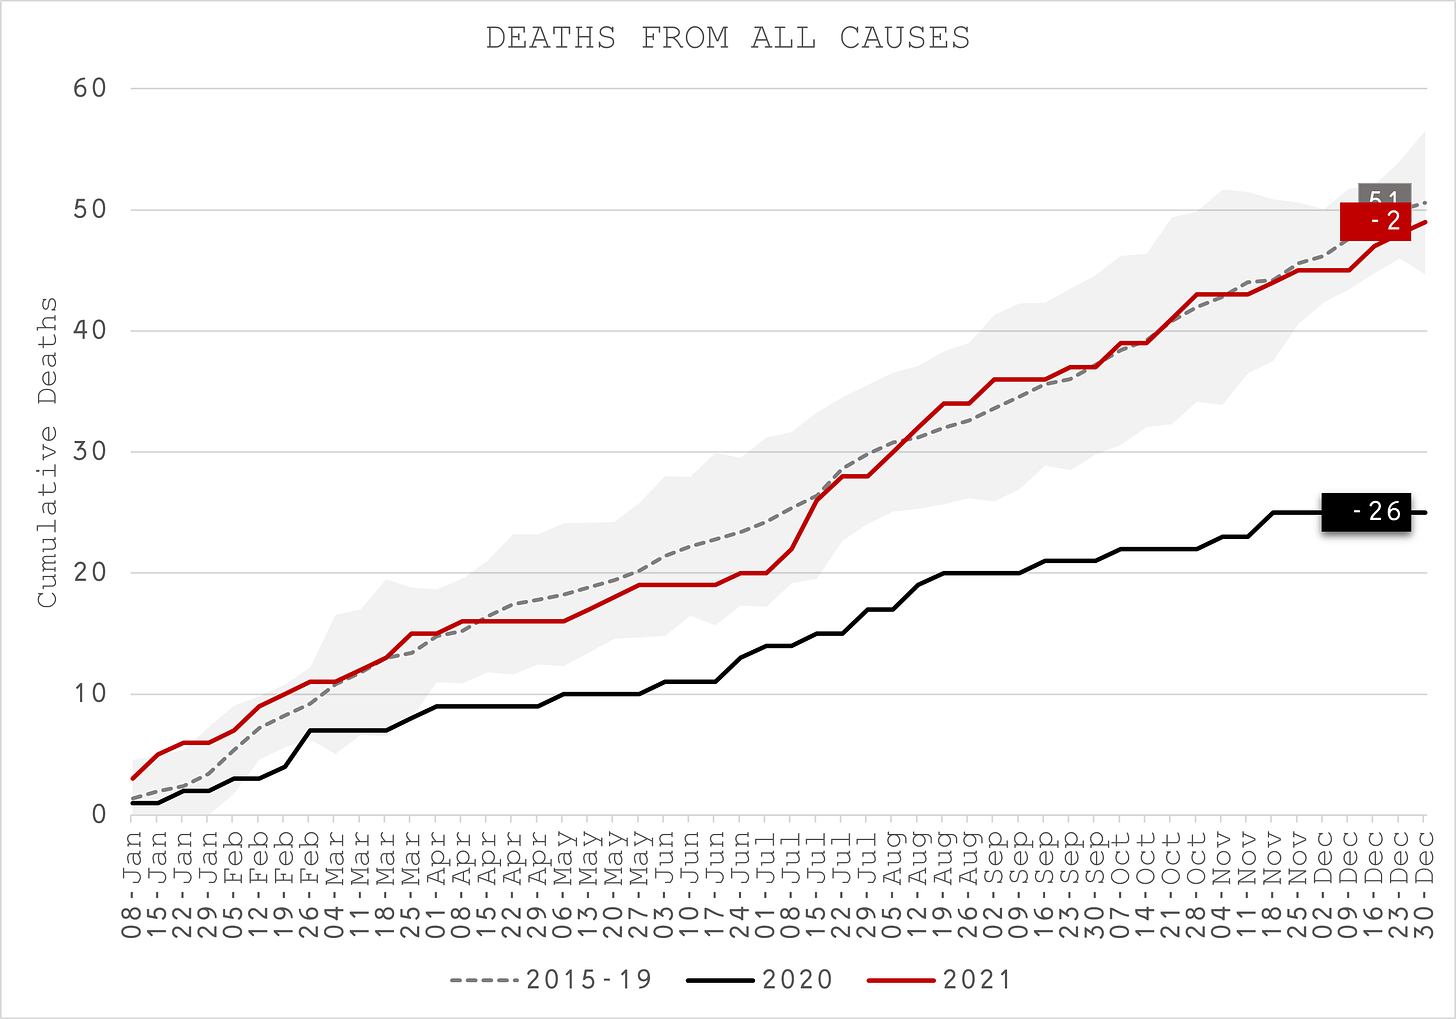
- Tijdens het pandemiejaar 2020 waren de sterfgevallen van kinderen van 5 tot 11 jaar significant lager dan normaal (vergeleken met het 5-jaarsgemiddelde met een bereik van +/- twee standaarddeviaties van het gemiddelde). Er waren ongeveer de helft zoveel doden als gewoonlijk (Figuur 3).
- In 2021 waren de sterfgevallen in lijn met de verwachtingen voordat ze tussen april en juni op dezelfde manier als 2020 afliepen. Er was echter een scherpe stijging van het aantal sterfgevallen in juli, waardoor het aantal sterfgevallen weer op hun gebruikelijke pad kwam.
- Er lijkt geen enkele oorzaak te zijn voor deze stijging. Ongelukken (inclusief overdosis, verstikking, val etc.) is de enige categorie die het jaar boven de bovengrens van verwachting eindigde met in totaal vier doden.
- Er waren helemaal geen sterfgevallen als gevolg van COVID-19 in deze leeftijdsgroep en slechts één waarbij COVID-19 werd genoemd, dwz: het kind stierf aan iets anders en COVID-19 heeft mogelijk bijgedragen aan het overlijden.
Sterfgevallen van 12 tot 15-jarigen
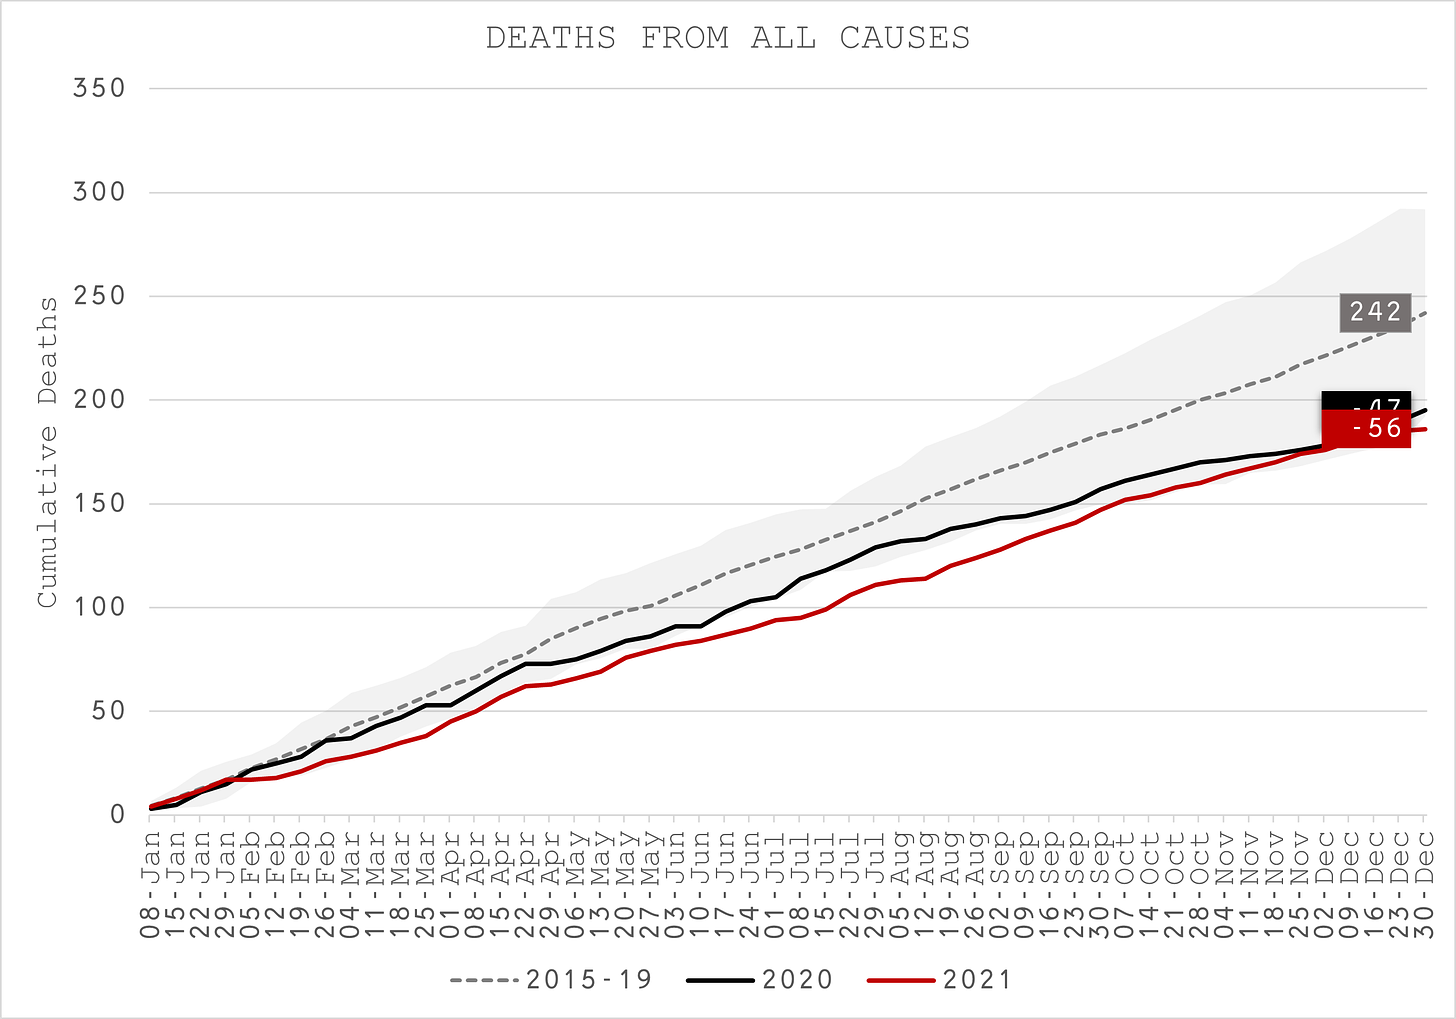
- Zowel in 2020 als in 2021 waren de sterfgevallen van kinderen van 12 tot 15 jaar significant lager dan normaal, met ongeveer 20% minder sterfgevallen (Figuur 4).
- Ongevallen (inclusief overdosis, verstikking, val etc.) is echter de enige categorie waardoor het jaar in 2020 boven de bovengrens van de verwachting eindigde met in totaal twaalf doden, twee keer zoveel als normaal (Figuur 5)
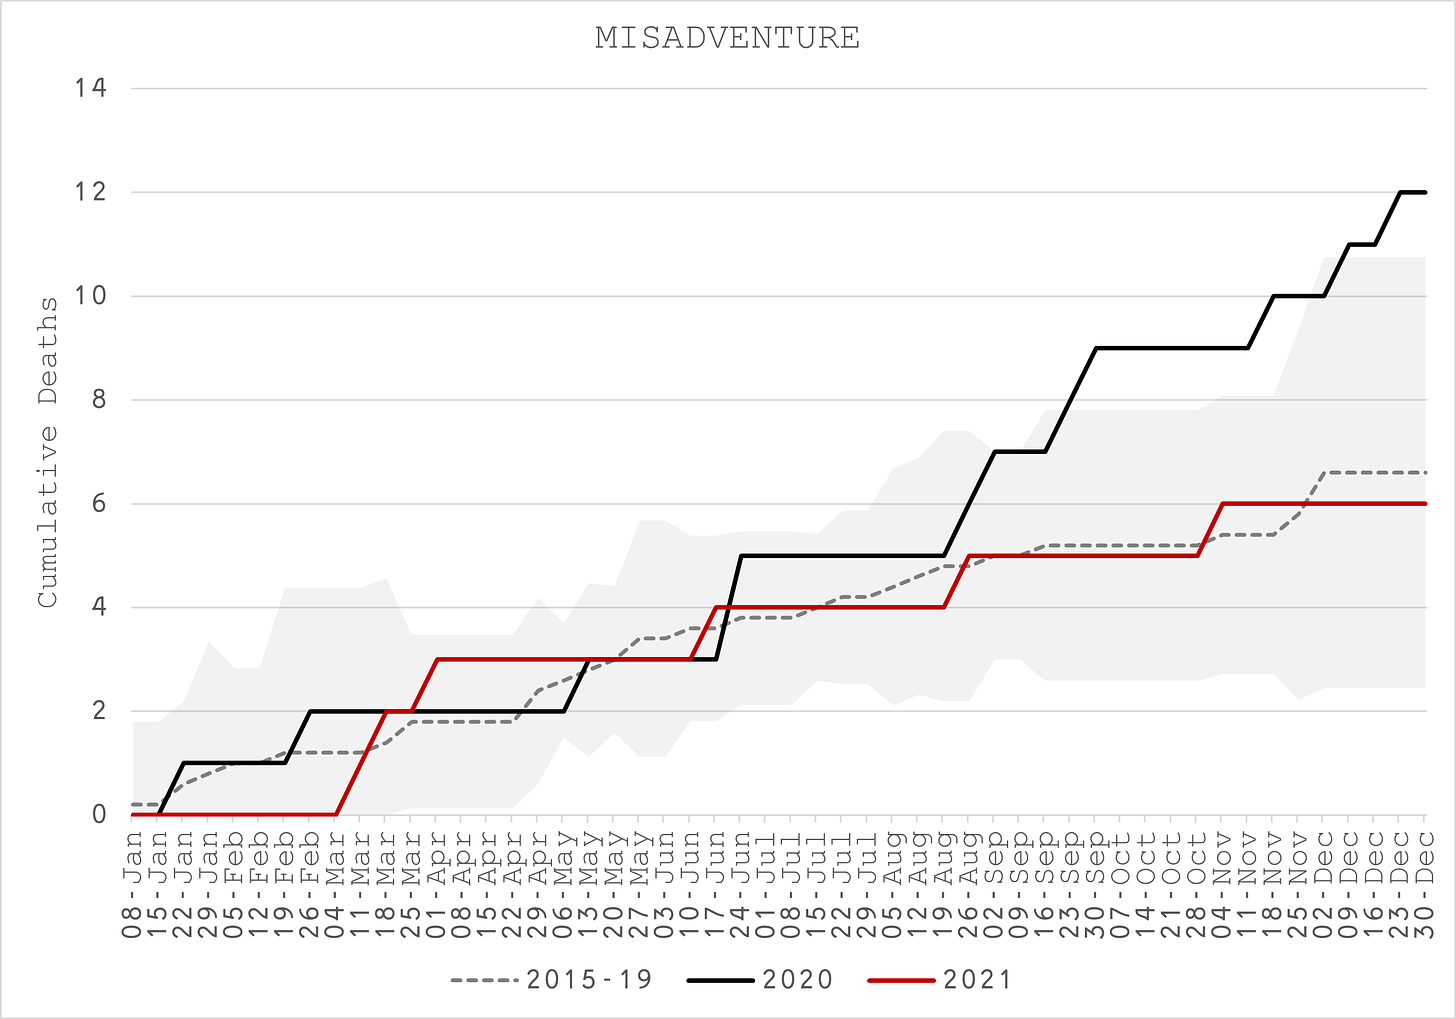
- Er waren helemaal geen sterfgevallen als gevolg van COVID-19 in deze leeftijdsgroep, maar zes waar COVID-19 werd genoemd.
Sterfgevallen van 16 tot 19-jarigen
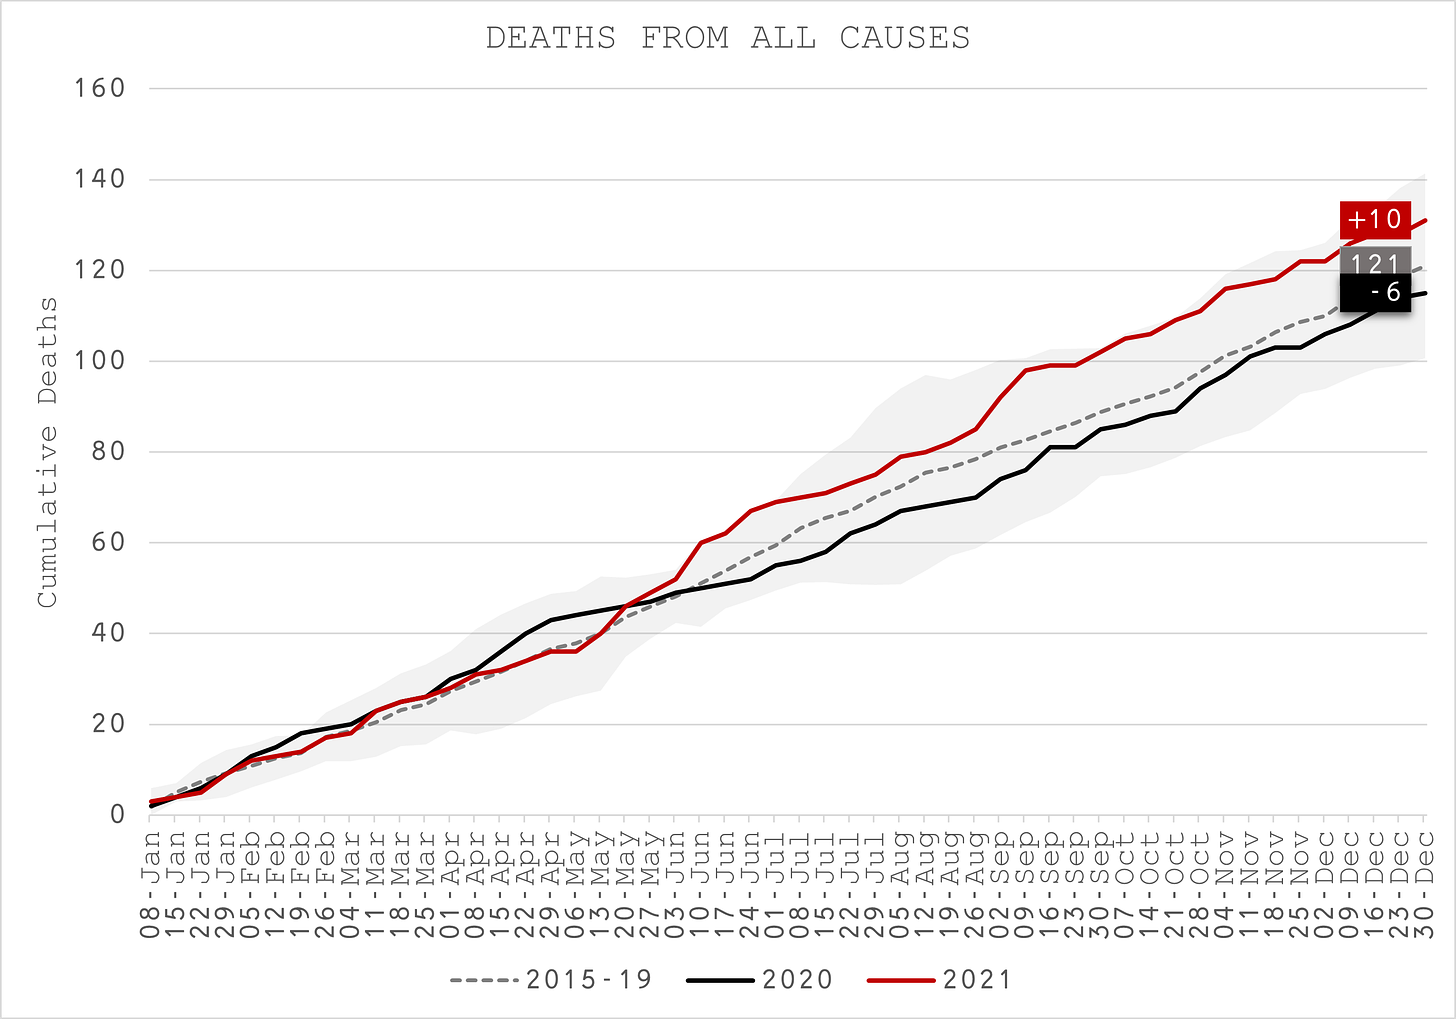
- Tijdens het pandemische jaar 2020 waren de sterfgevallen van tieners van 16 tot 19 jaar min of meer in lijn met de verwachtingen met een duidelijke, afgezien van de onbeduidende bult tijdens de voorjaarsepidemie (Figuur 6).
- In 2021 waren de sterfgevallen in lijn met de verwachtingen voordat ze vanaf medio mei erboven bleven, waardoor het jaar iets meer dan 8% hoger was dan normaal, maar net binnen de totale bovengrens.
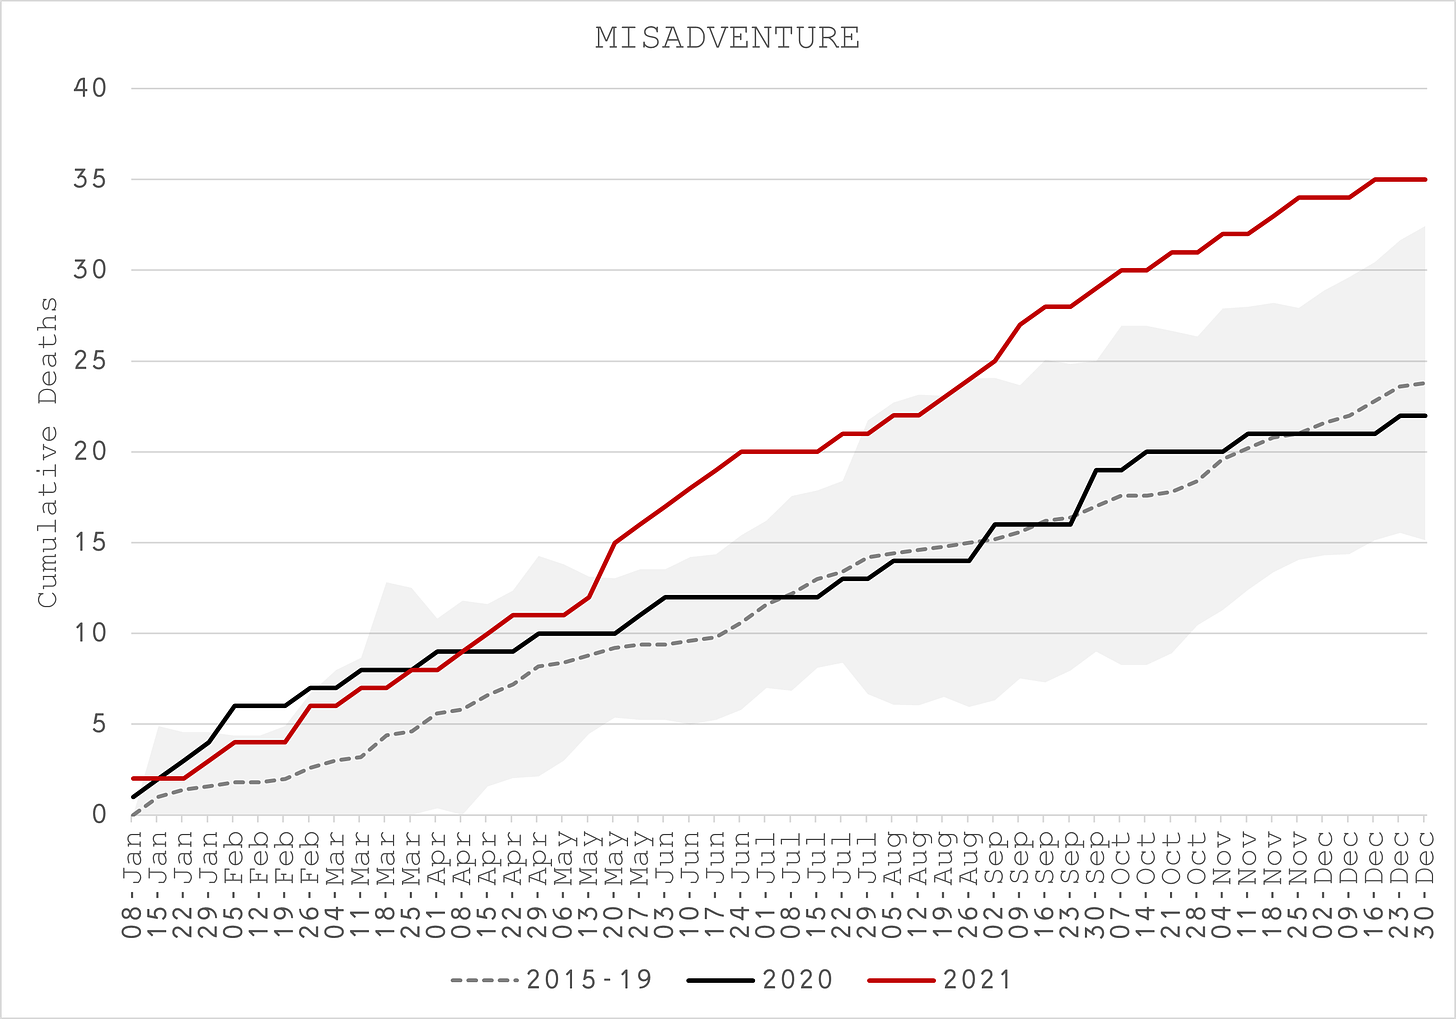
- ‘Ongevallen’ is hier opnieuw de enige categorie die het jaar boven de bovengrens van verwachting eindigde met in totaal 35 doden, 45% meer dan normaal.
- Er was slechts één sterfgeval als gevolg van COVID-19 in deze leeftijdsgroep in 2021, maar geen in 2020, en 3 genoemd in 2020 vergeleken met 5 in 2021 (Figuur 7).
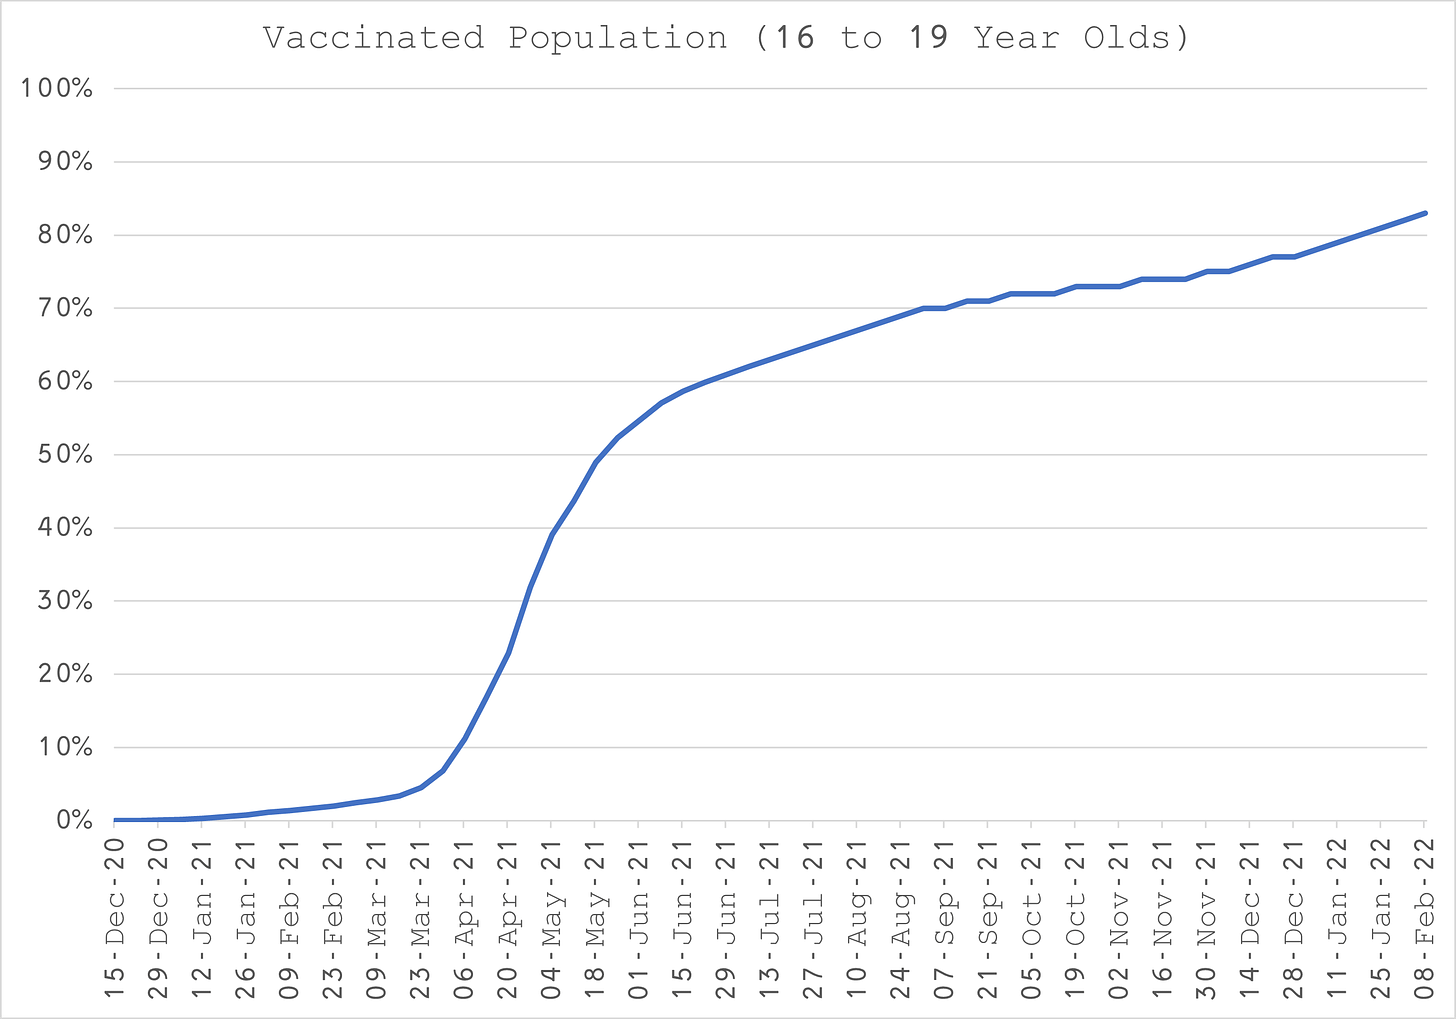
- De stijging van het aantal sterfgevallen in 2021 valt ook samen met het midden van de belangrijkste massavaccinatie van deze leeftijdsgroep (Figuur 8).
Sterfgevallen van 20- tot 29-jarigen
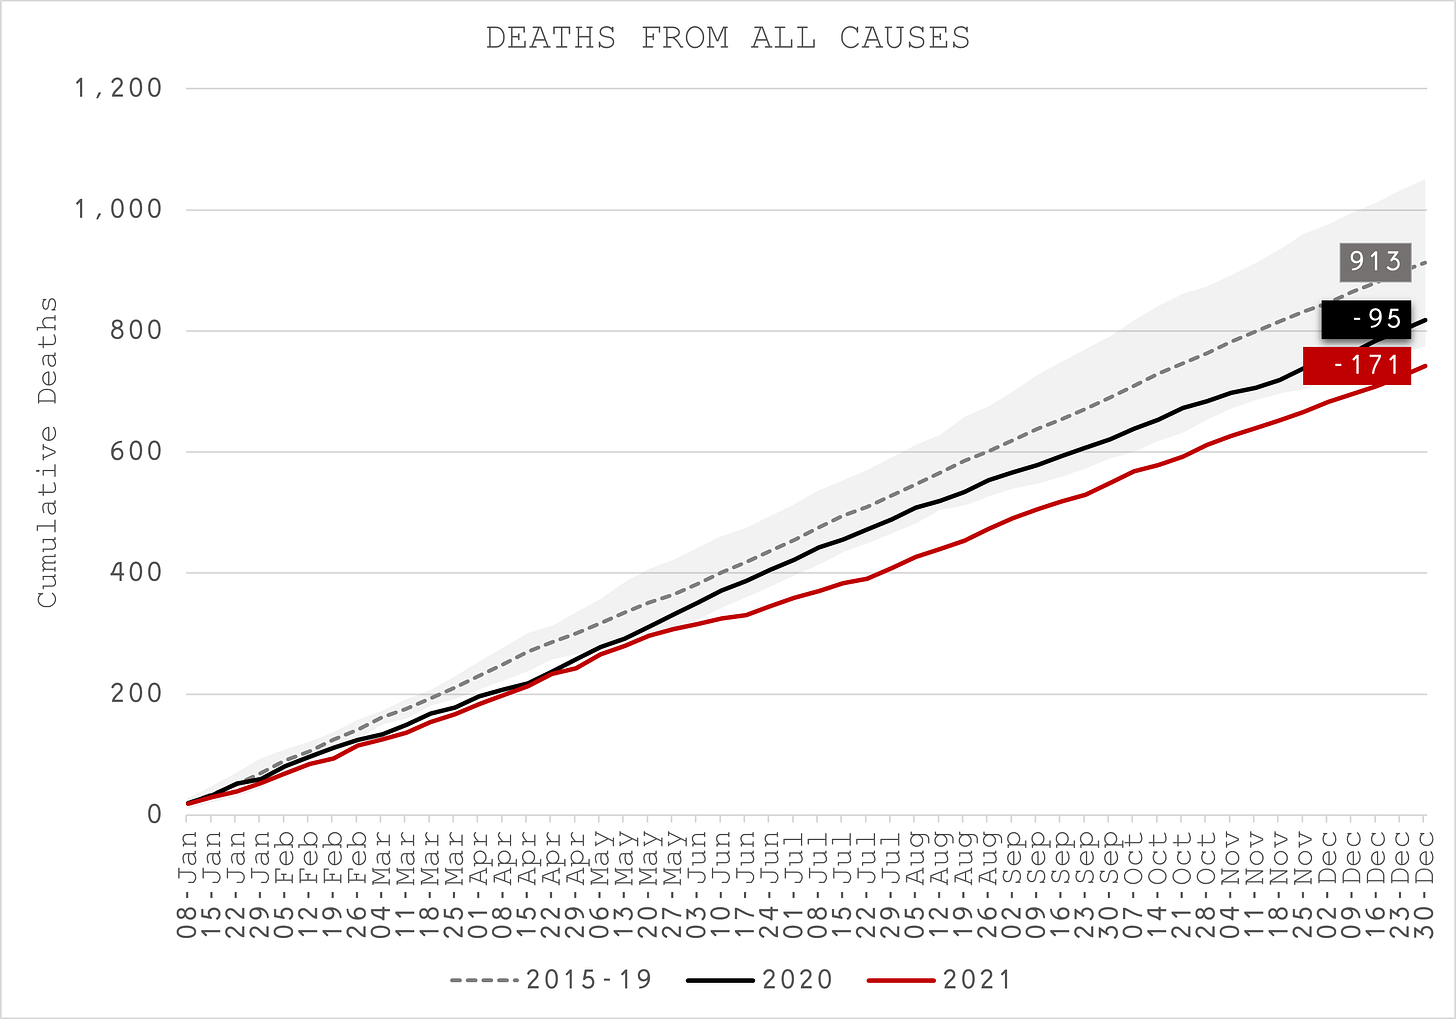
- Het aantal doden onder 20- tot 29-jarigen was in 2020 10% lager dan normaal en in 2021 bijna 20% (Figuur 9).
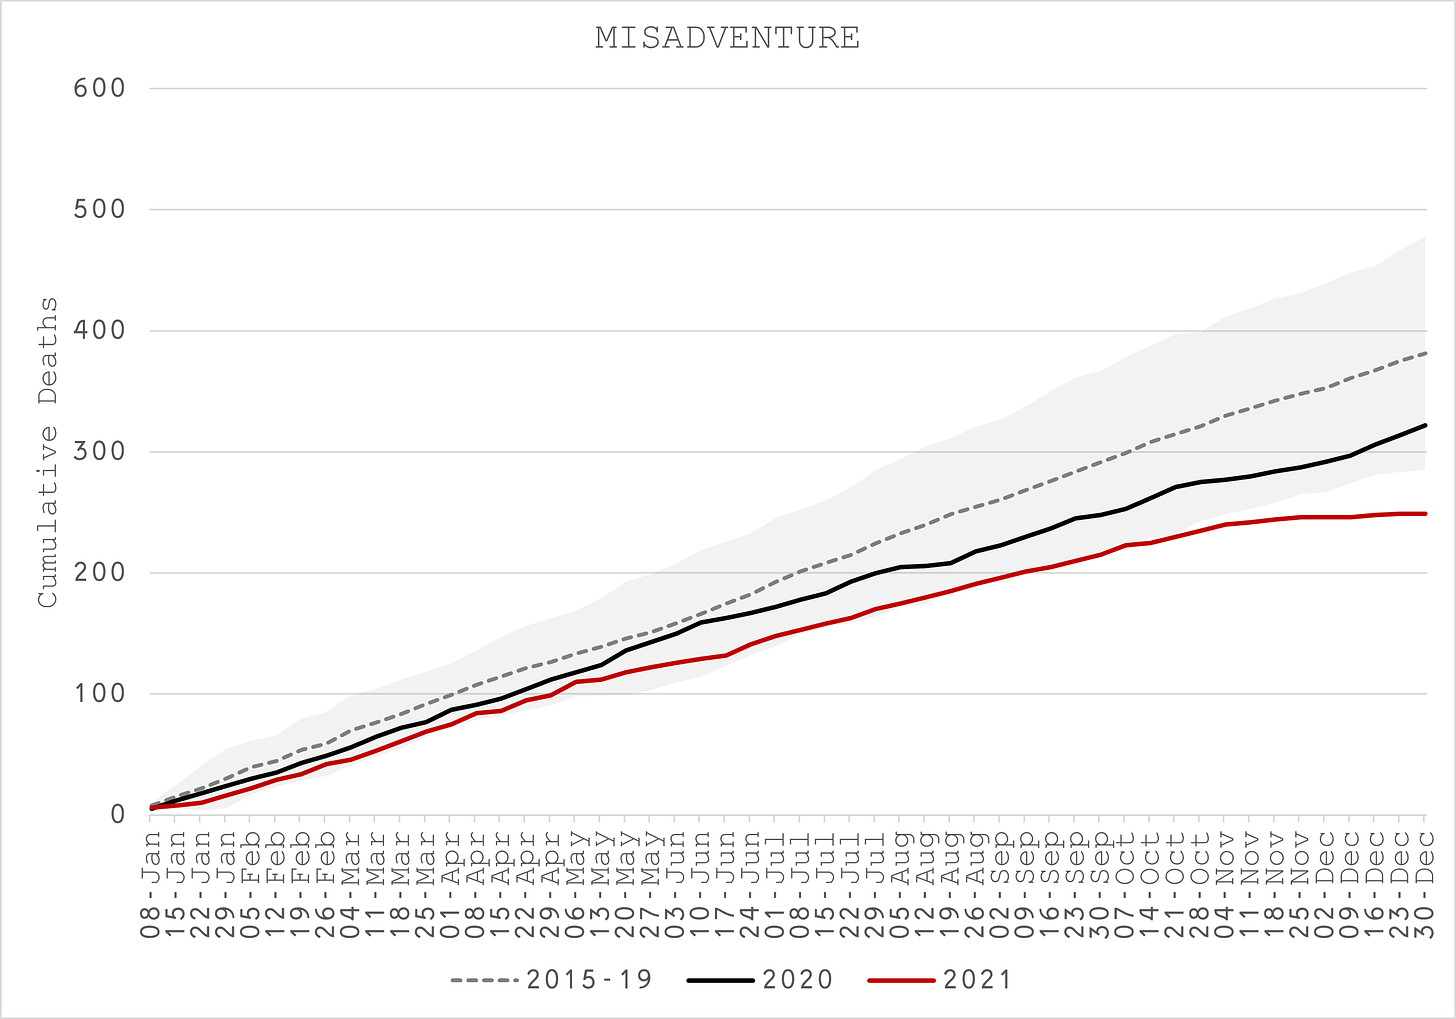
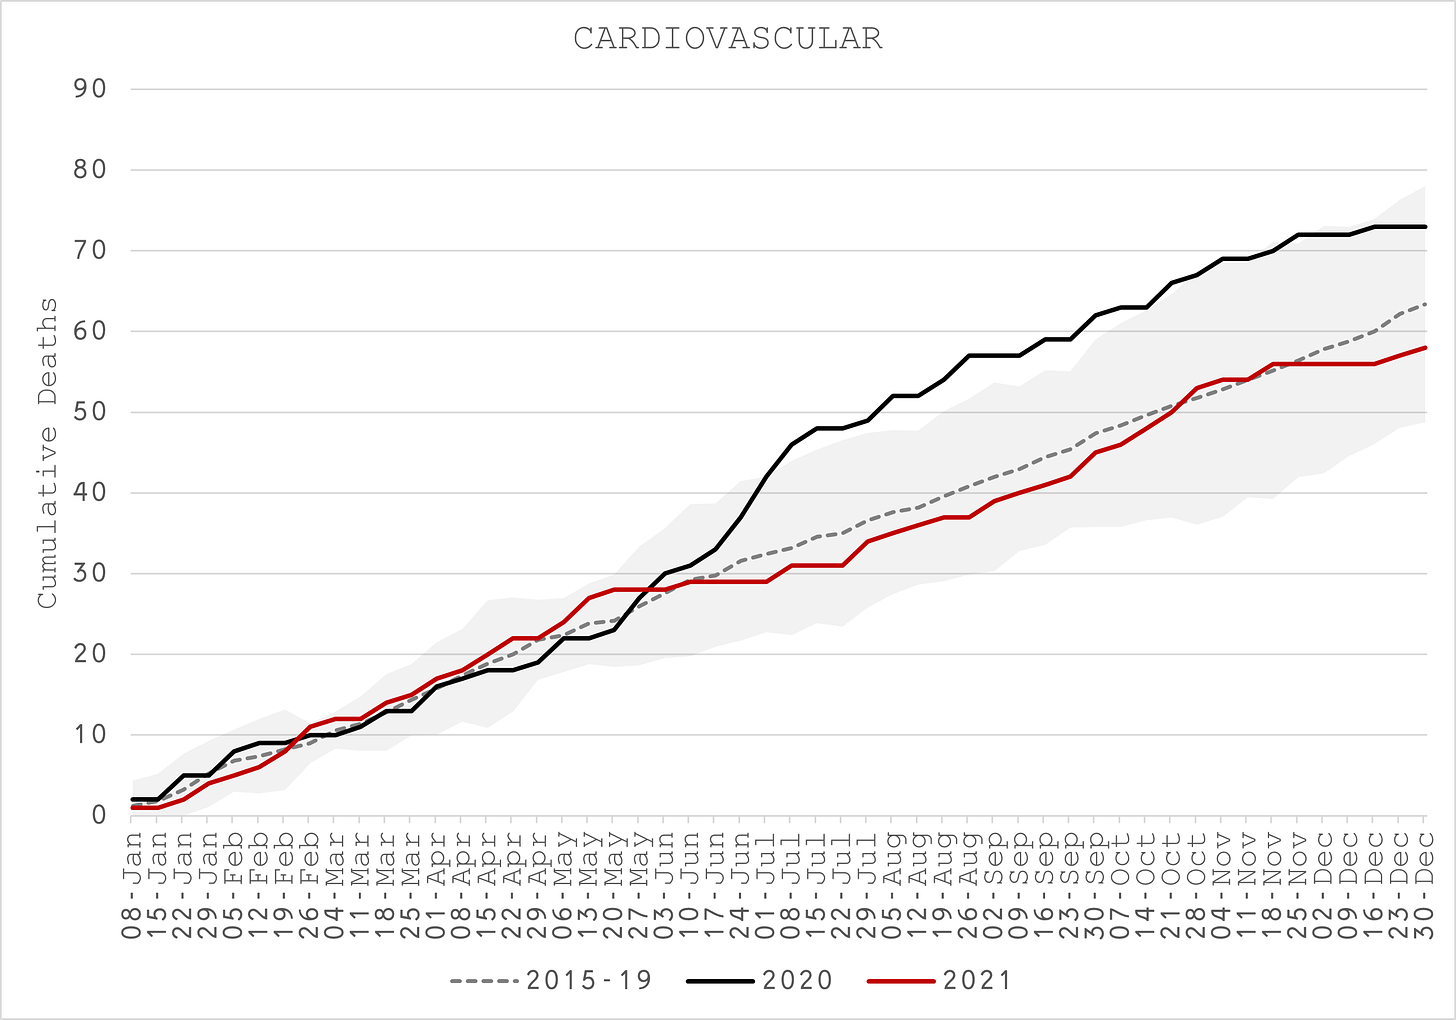
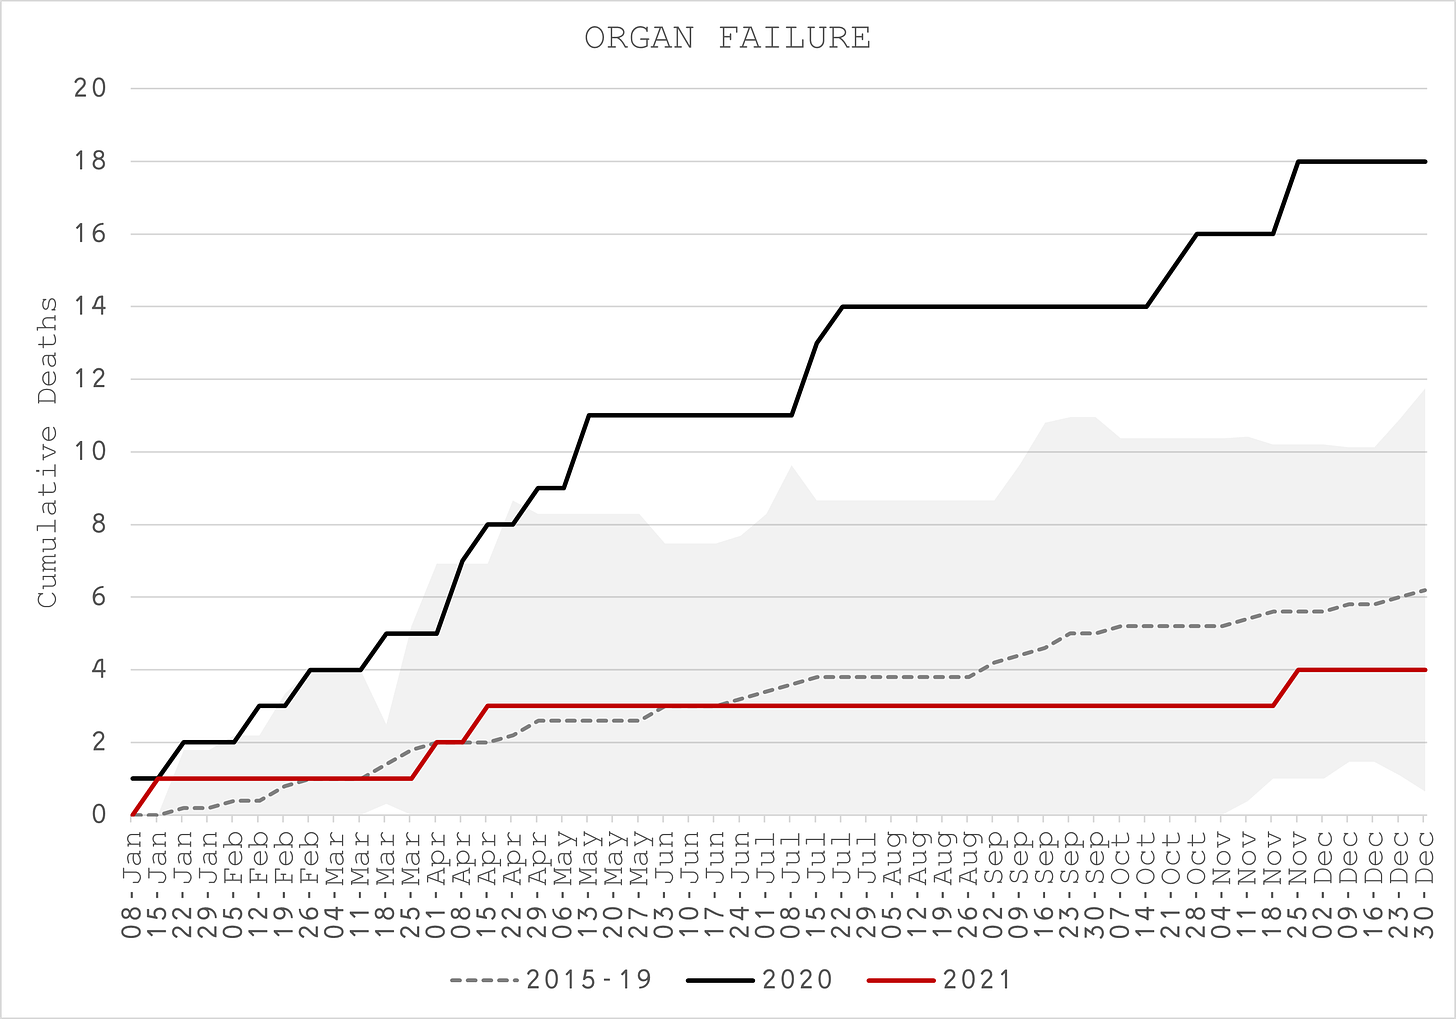
- Dit is echter voornamelijk te wijten aan aanzienlijk lagere sterfgevallen als gevolg van tegenslagen/ongevallen (Figuur 10), gecompenseerd door hogere sterfgevallen in cardiovasculaire (Figuur 11) en orgaanfalen (Figuur 12) in 2020. Merk echter op dat 2021-sterfgevallen door tegenslagen onvolledig lijken.
- Er waren elk jaar vier gevallen waarin COVID-19 de primaire doodsoorzaak was, dwz ongeveer 0,5% van alle sterfgevallen. Het werd echter 13 keer genoemd in 2020 vergeleken met 28 keer (meer dan twee keer zo vaak) in 2021 (Figuur 13).
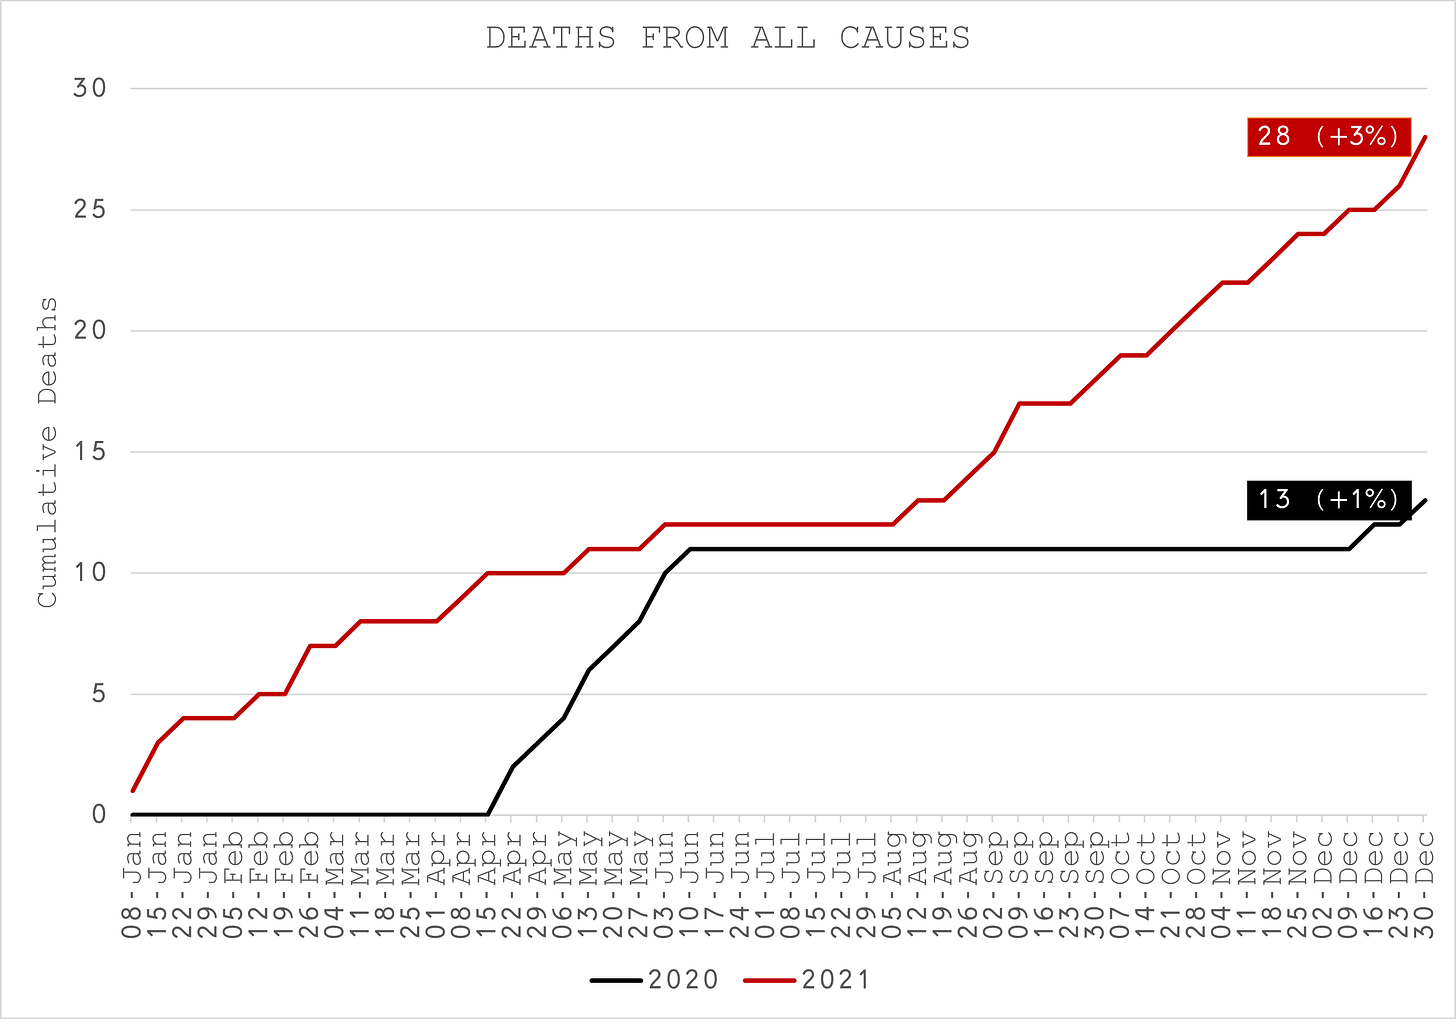
Sterfgevallen van 30- tot 39-jarigen
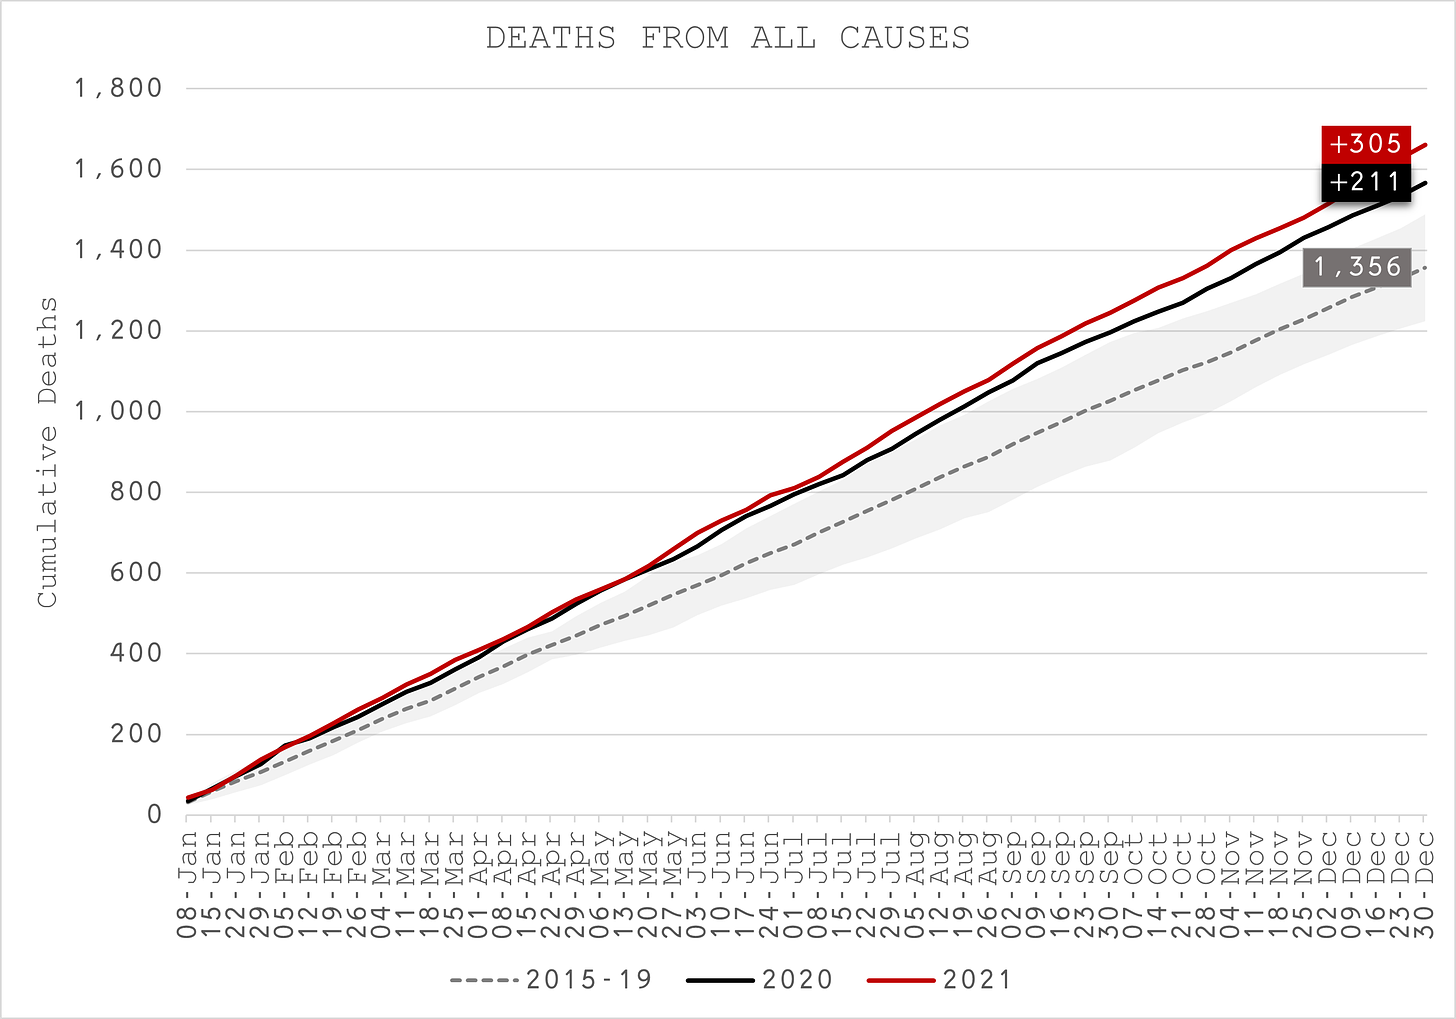
- Sterfgevallen van 30- tot 39-jarigen waren in 2020 15% hoger dan normaal, ver buiten de bovengrens en vallen niet samen met de COVID-19-uitbraken (Figuur 14).
- In 2021 waren ze nog hoger op +22%.
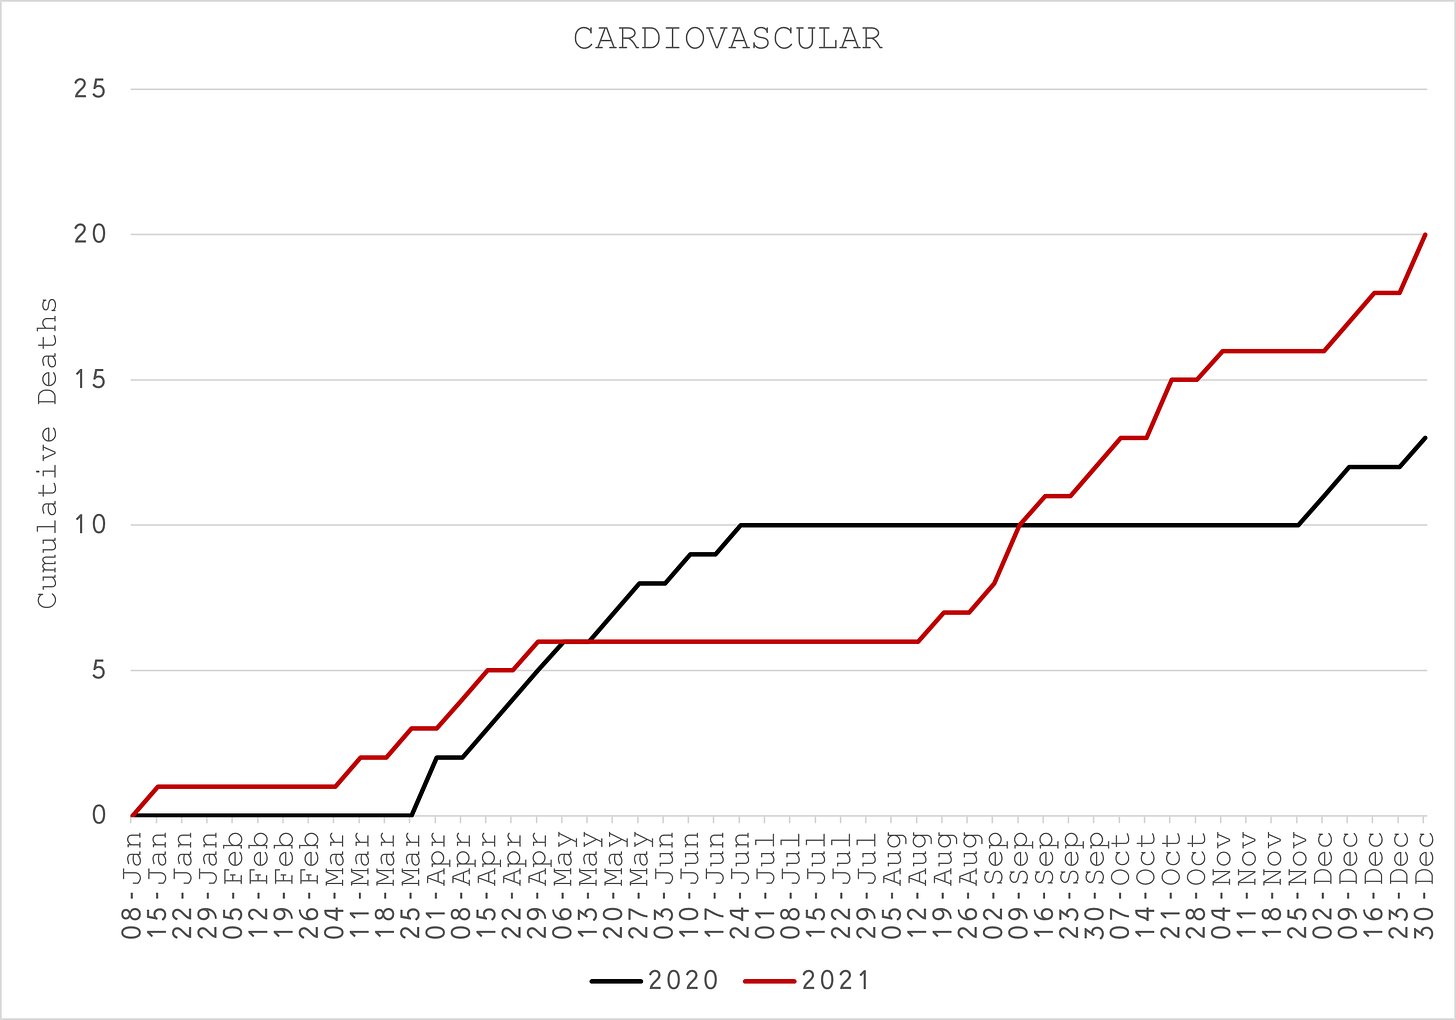
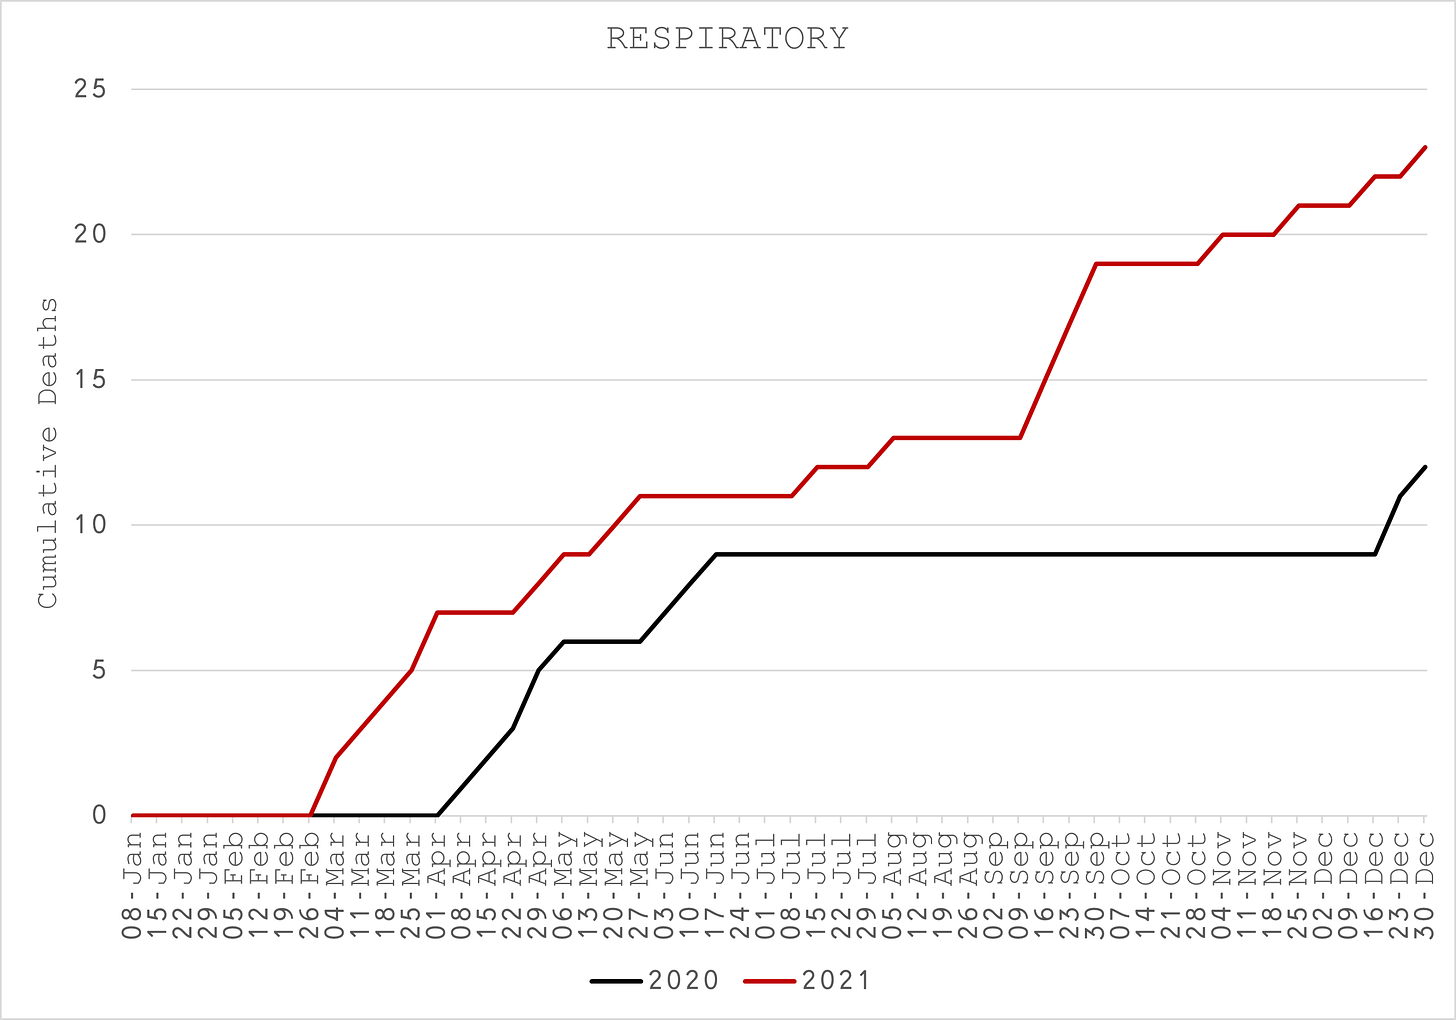
- Sterfgevallen door orgaanfalen zijn hoger dan verwacht, maar de belangrijkste boosdoeners zijn cardiovasculaire (Figuur 15) en respiratoire ziektes (Figuur 16).
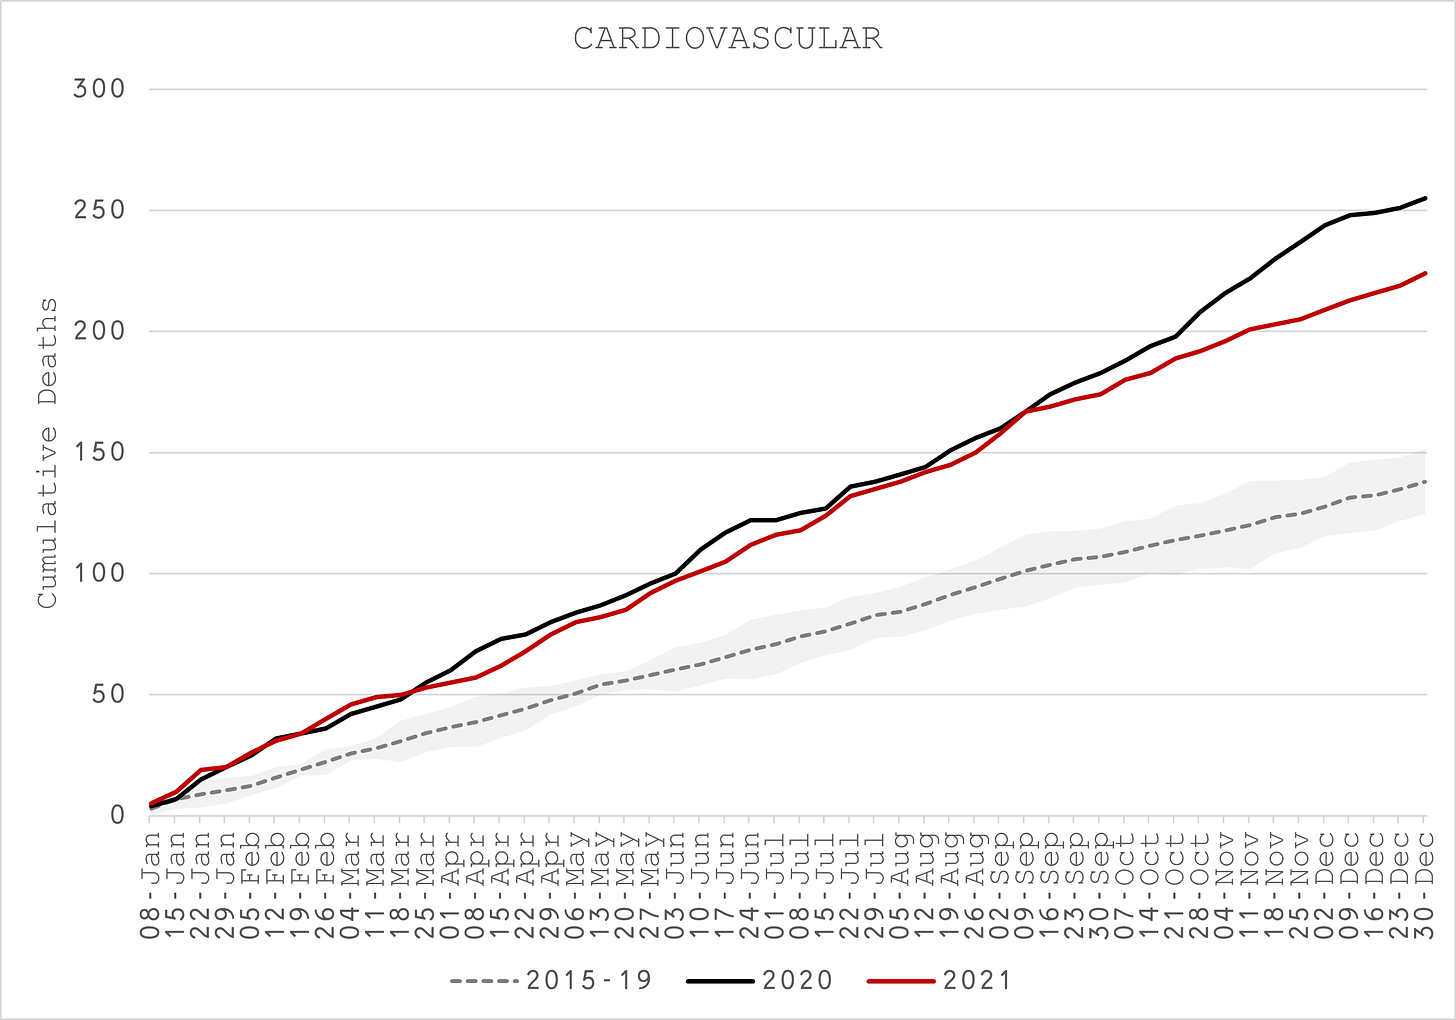
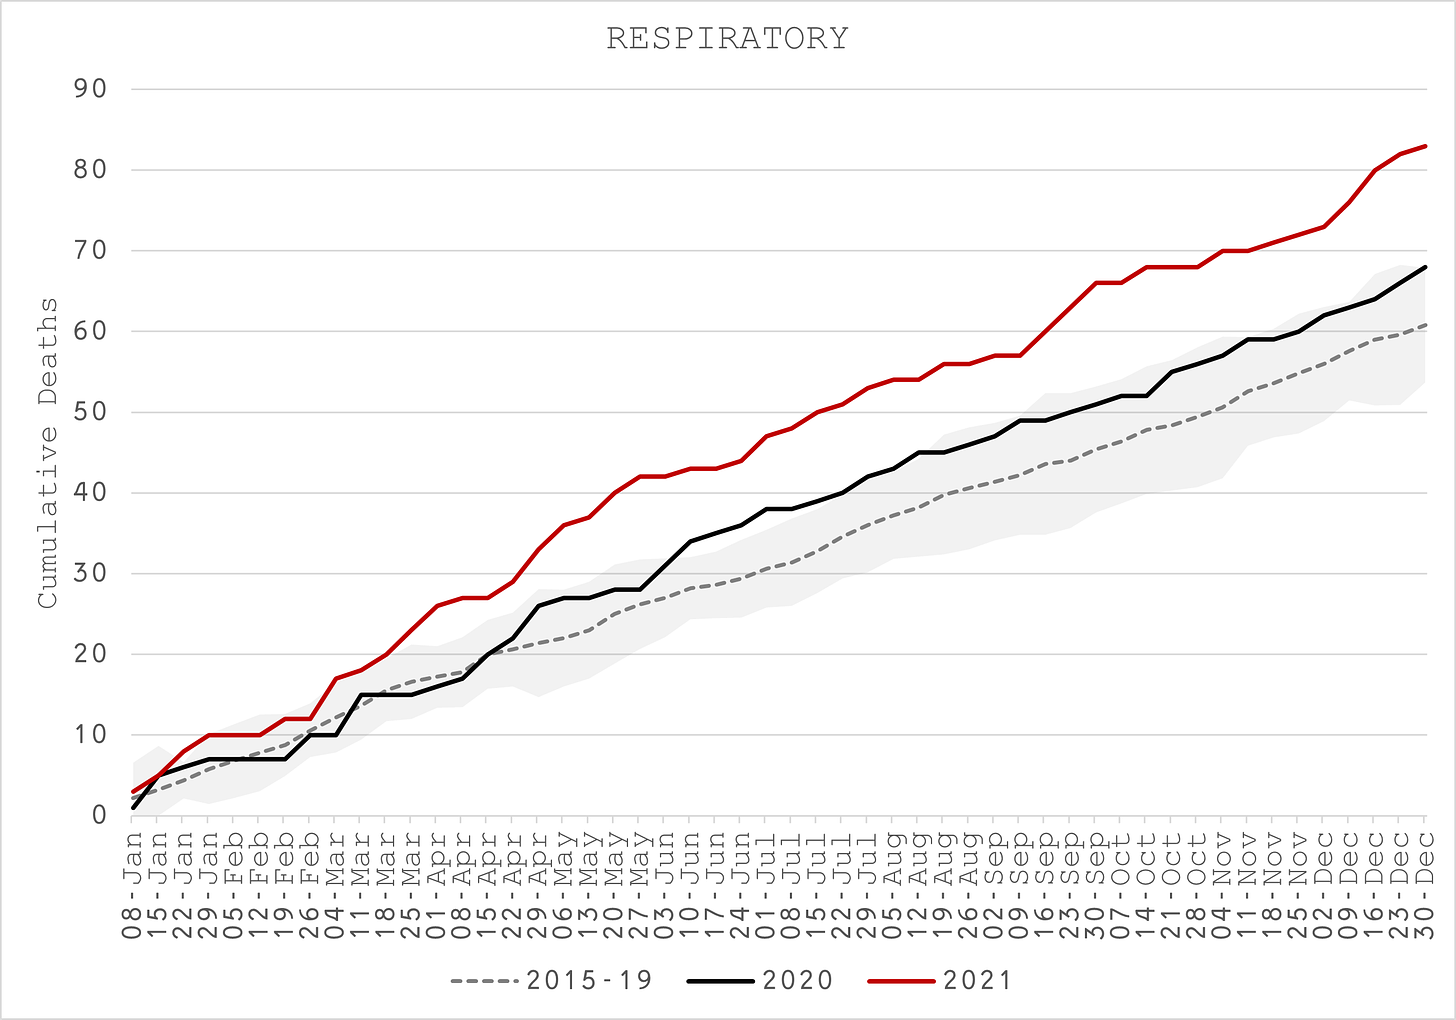
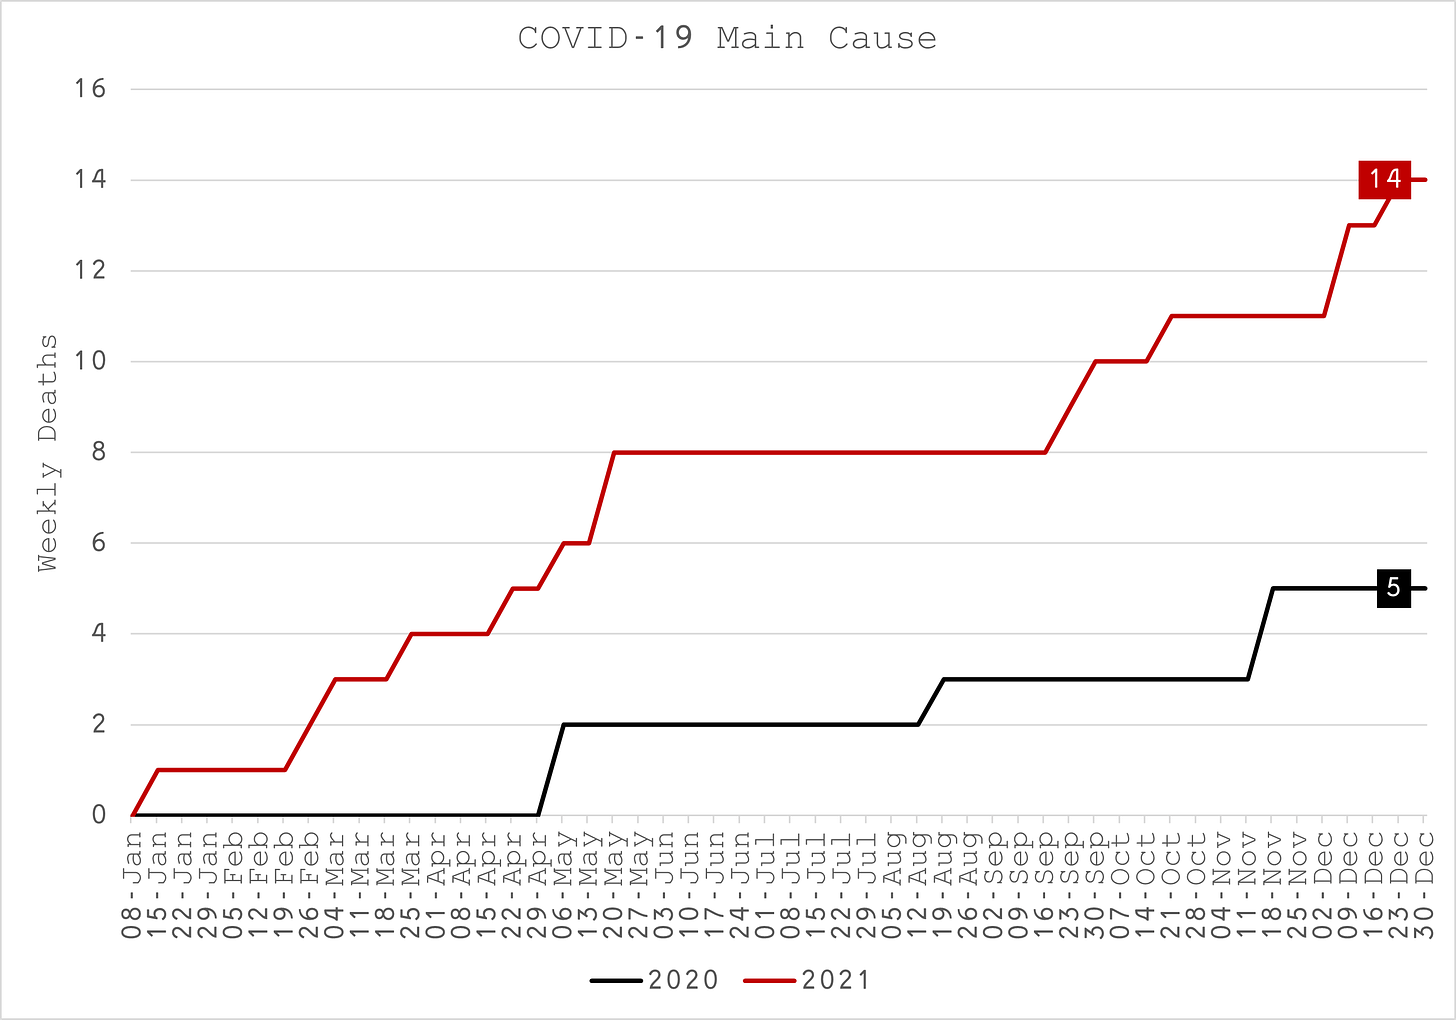
- COVID-19 was vijf keer de belangrijkste doodsoorzaak in 2020, maar 14 keer in 2021, waarbij de meeste sterfgevallen na vaccinaties kwamen (Figuur 17).
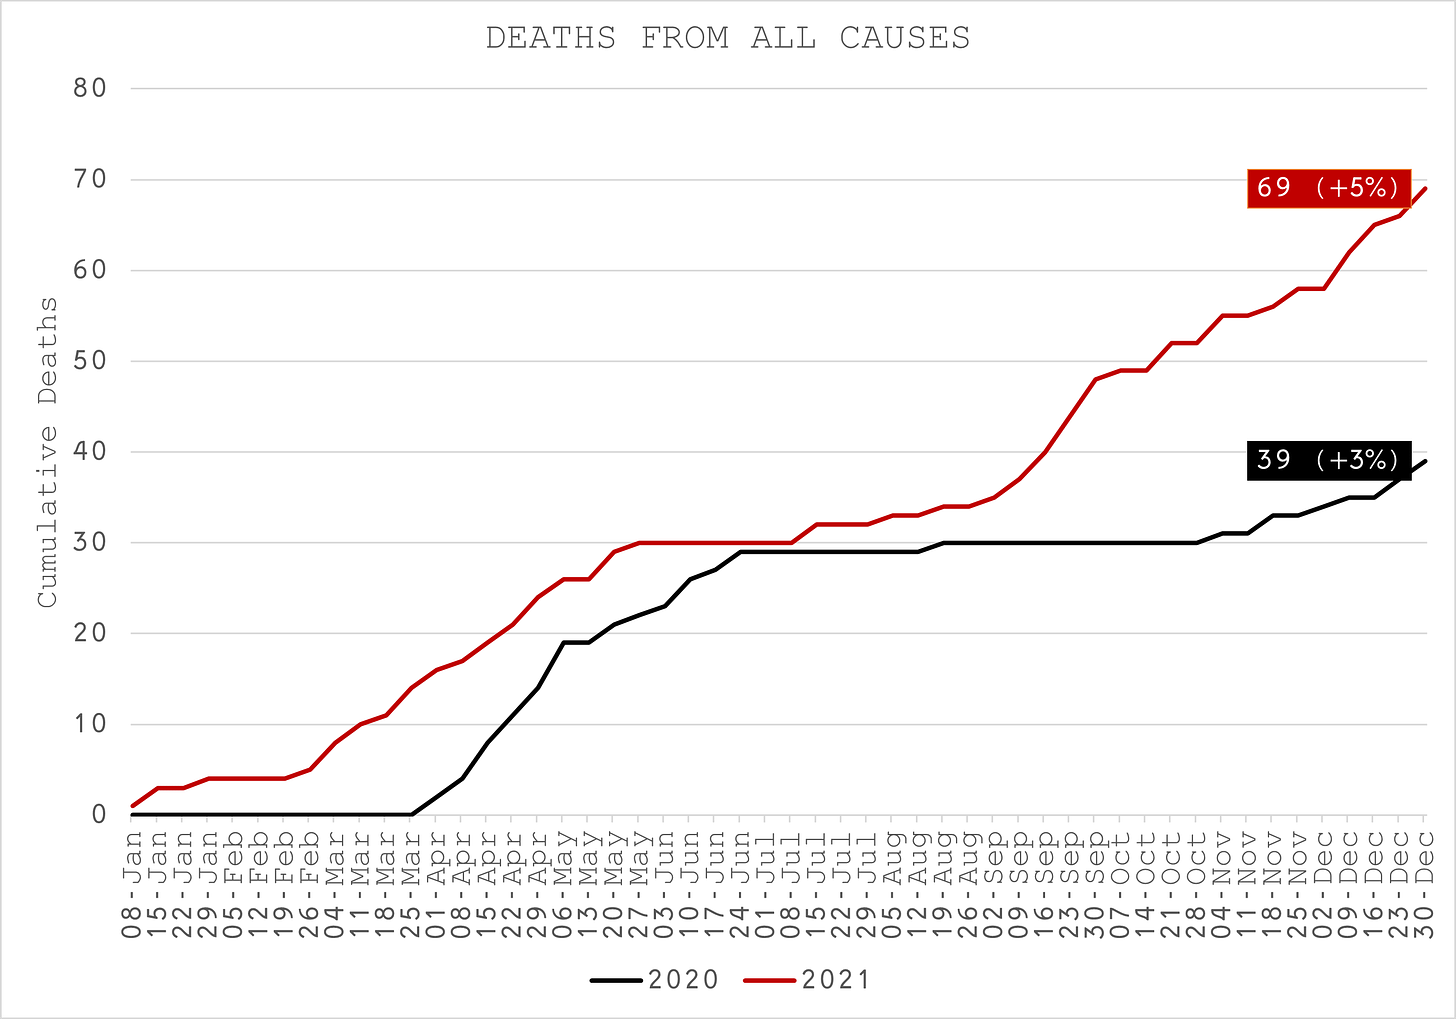
- COVID-19 werd 39 keer genoemd in 2020 maar 69 keer in 2021 (Figuur 18) en wordt tijdelijk geassocieerd met de overmatige cardiovasculaire (Figuur 19) en respiratoire (Figuur 20) sterfgevallen. Het is duidelijk dat de vaccinatie heeft geleid tot aanzienlijk meer COVID-gerelateerde sterfte in deze leeftijdsgroep.
- Het aantal sterfgevallen onder zwarten en Latijns-Amerikanen in deze leeftijdsgroep is aanzienlijk hoger dan het gemiddelde (Figuur 21) met 32% en 52% boven gebruikelijk voor 2020 en 2021, vergeleken met respectievelijk 15% en 22%.
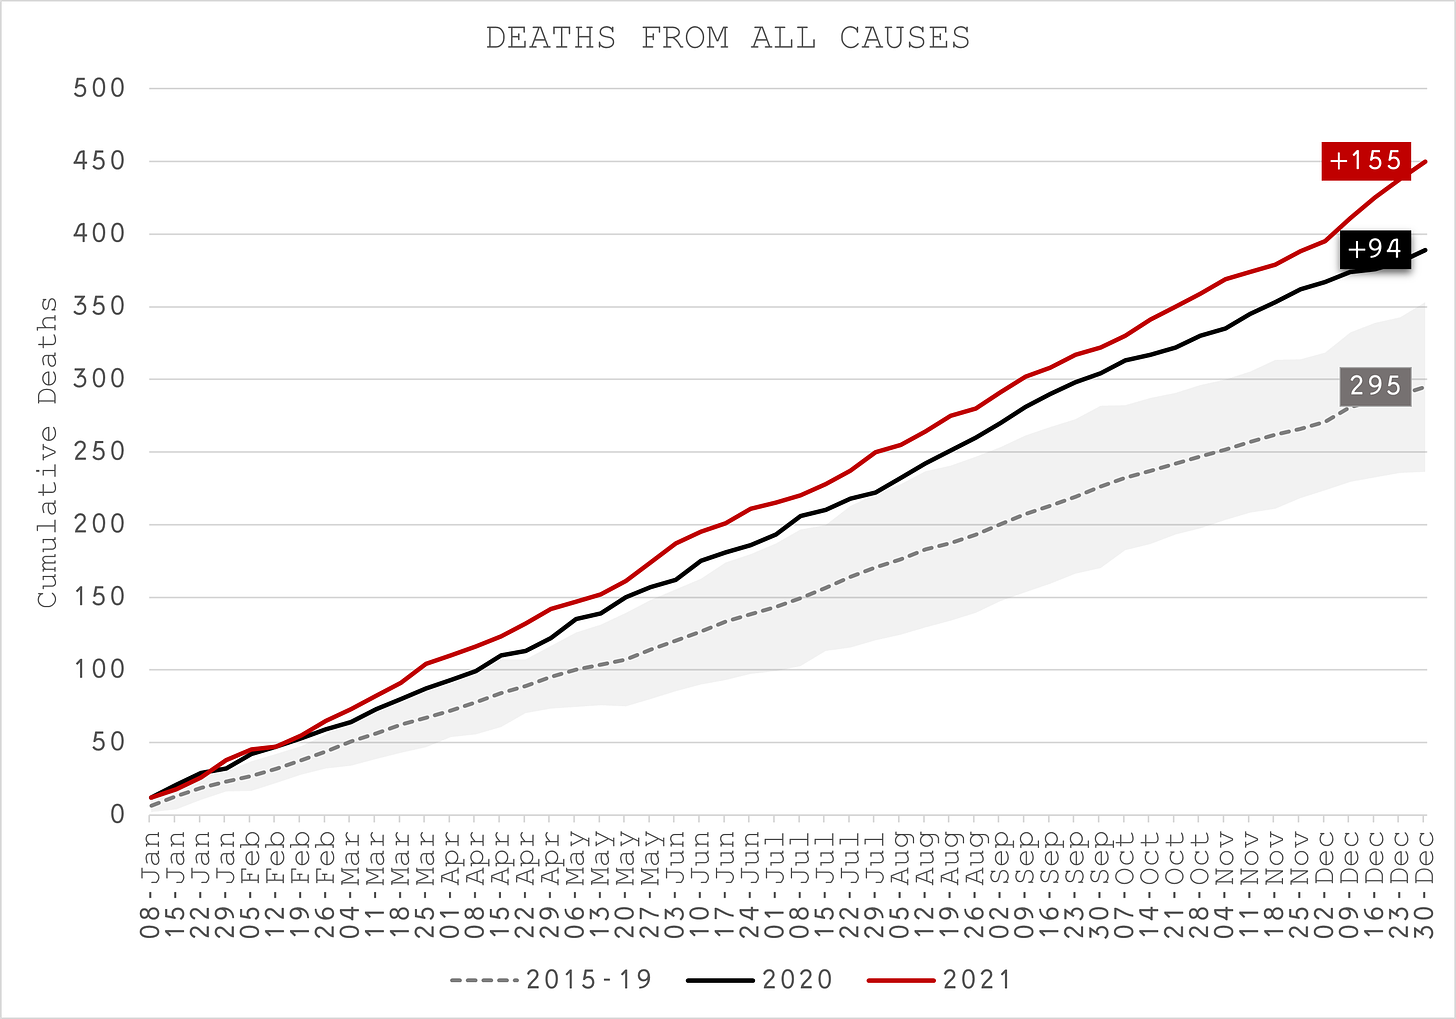
Sterfgevallen van 40- tot 64-jarigen
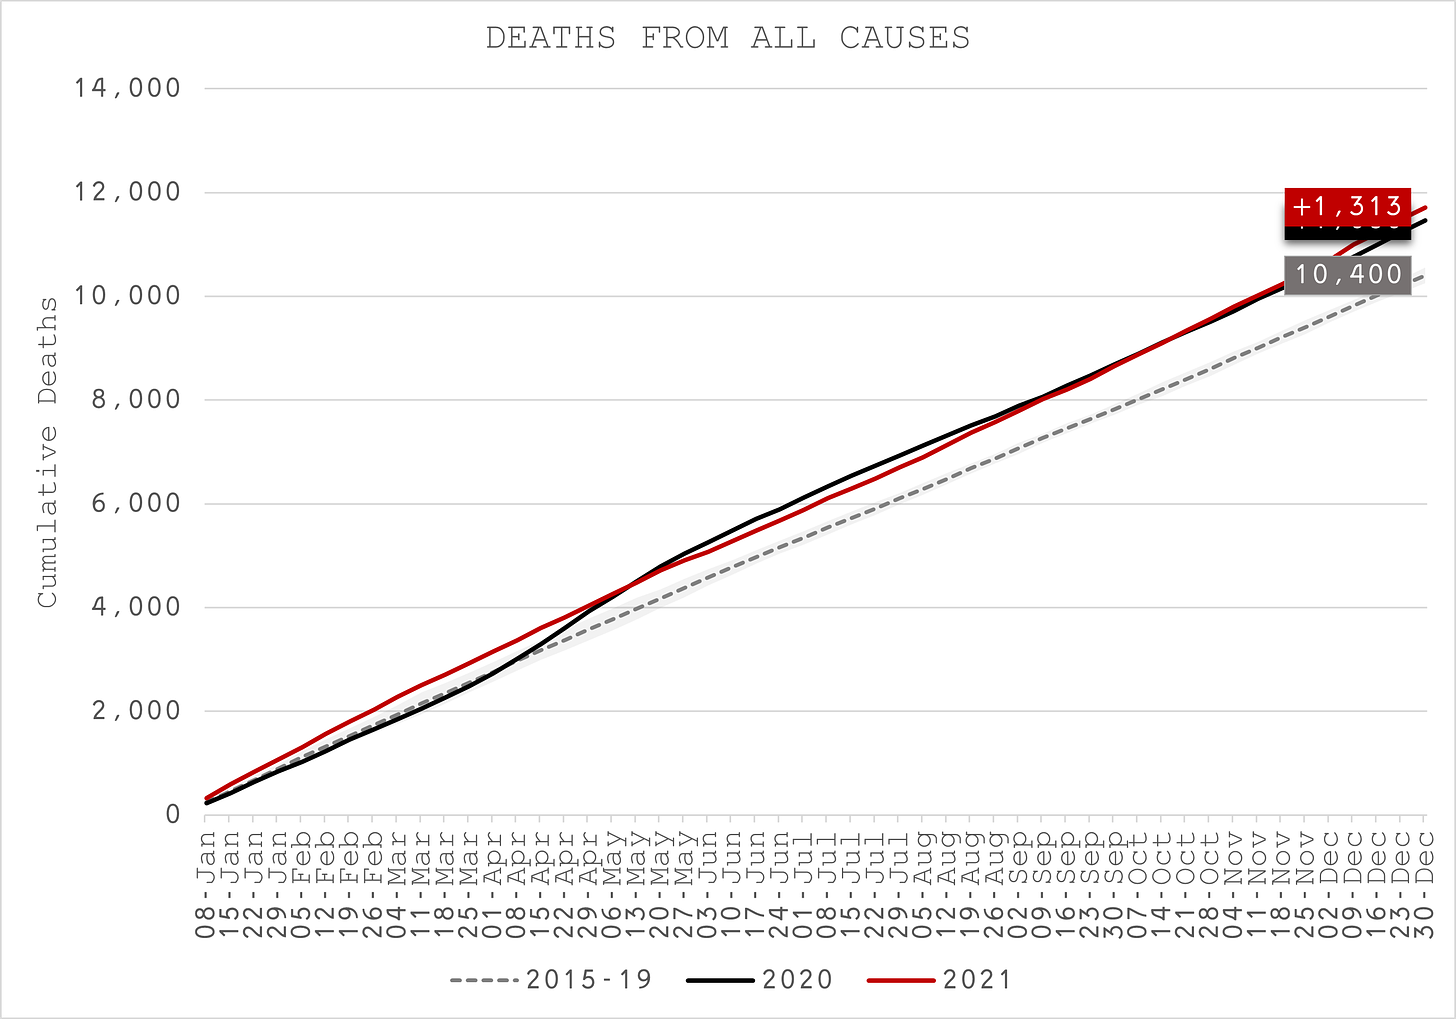
- Sterfgevallen van 40- tot 49-jarigen en 50- tot 64-jarigen hebben dezelfde patronen, dus heb ik ze gegroepeerd (Figuur 22). Voor de eerste keer zien we in het voorjaar van 2020 een duidelijke impact van COVID-19. Niettemin vallen er in 2021 meer doden, 12% boven normaal.
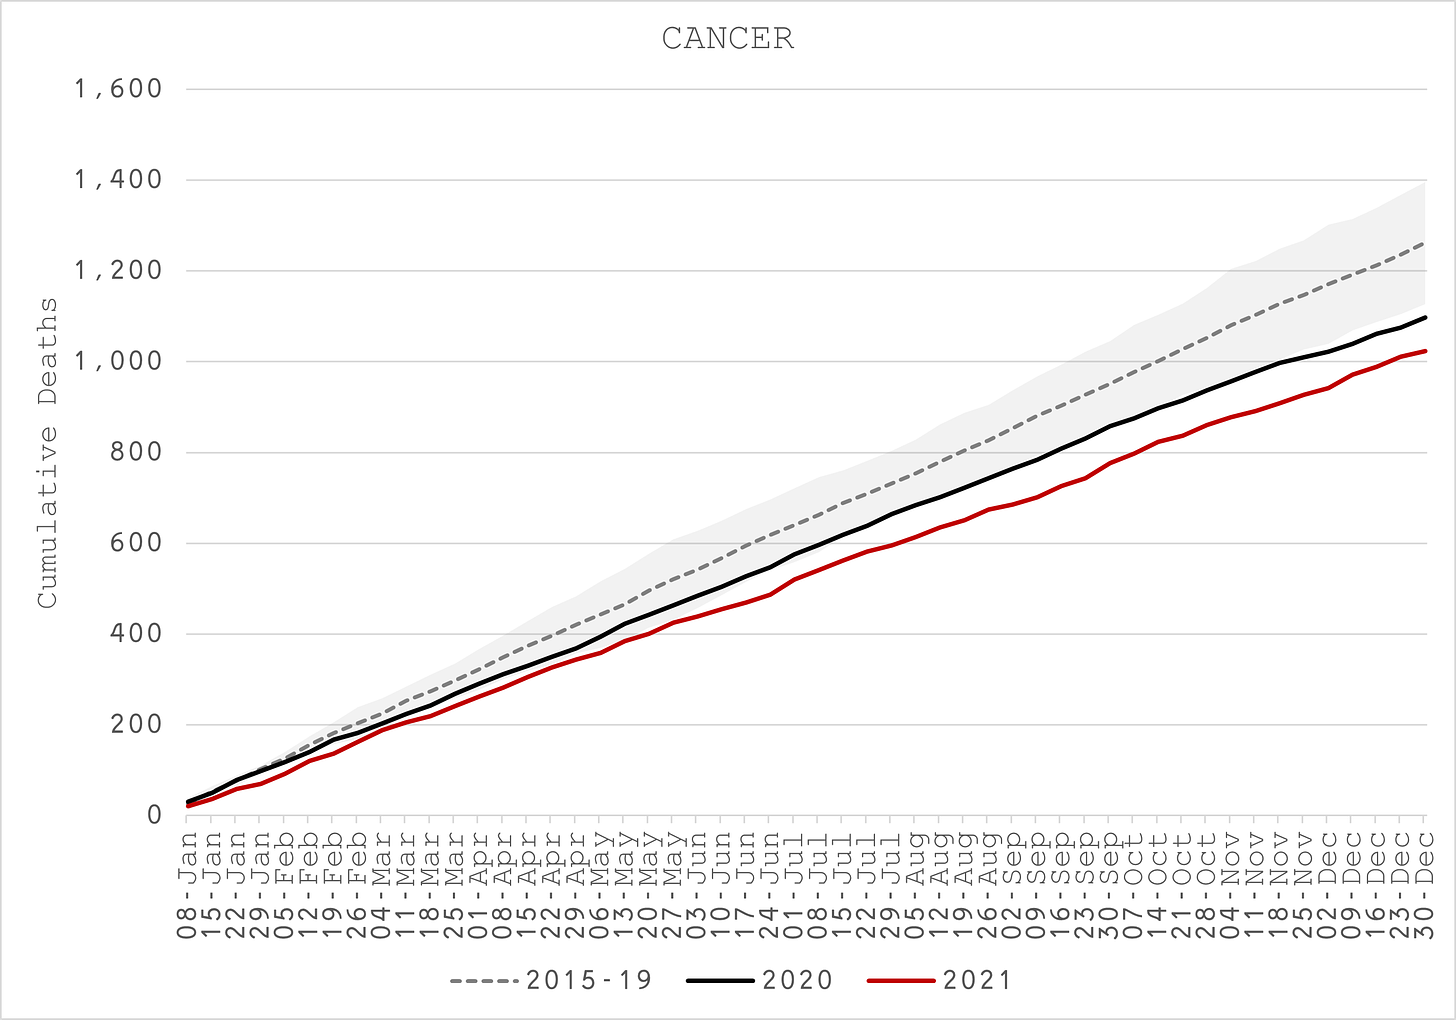
- Kanker ligt in 2020 ver beneden normaal, wat erop wijst dat veel van deze sterfgevallen door COVID-19 zijn verdreven, maar in 2021 zelfs nog lager, aangezien die sterfgevallen door kanker door andere oorzaken lijken te zijn verdrongen (Figuur 23).
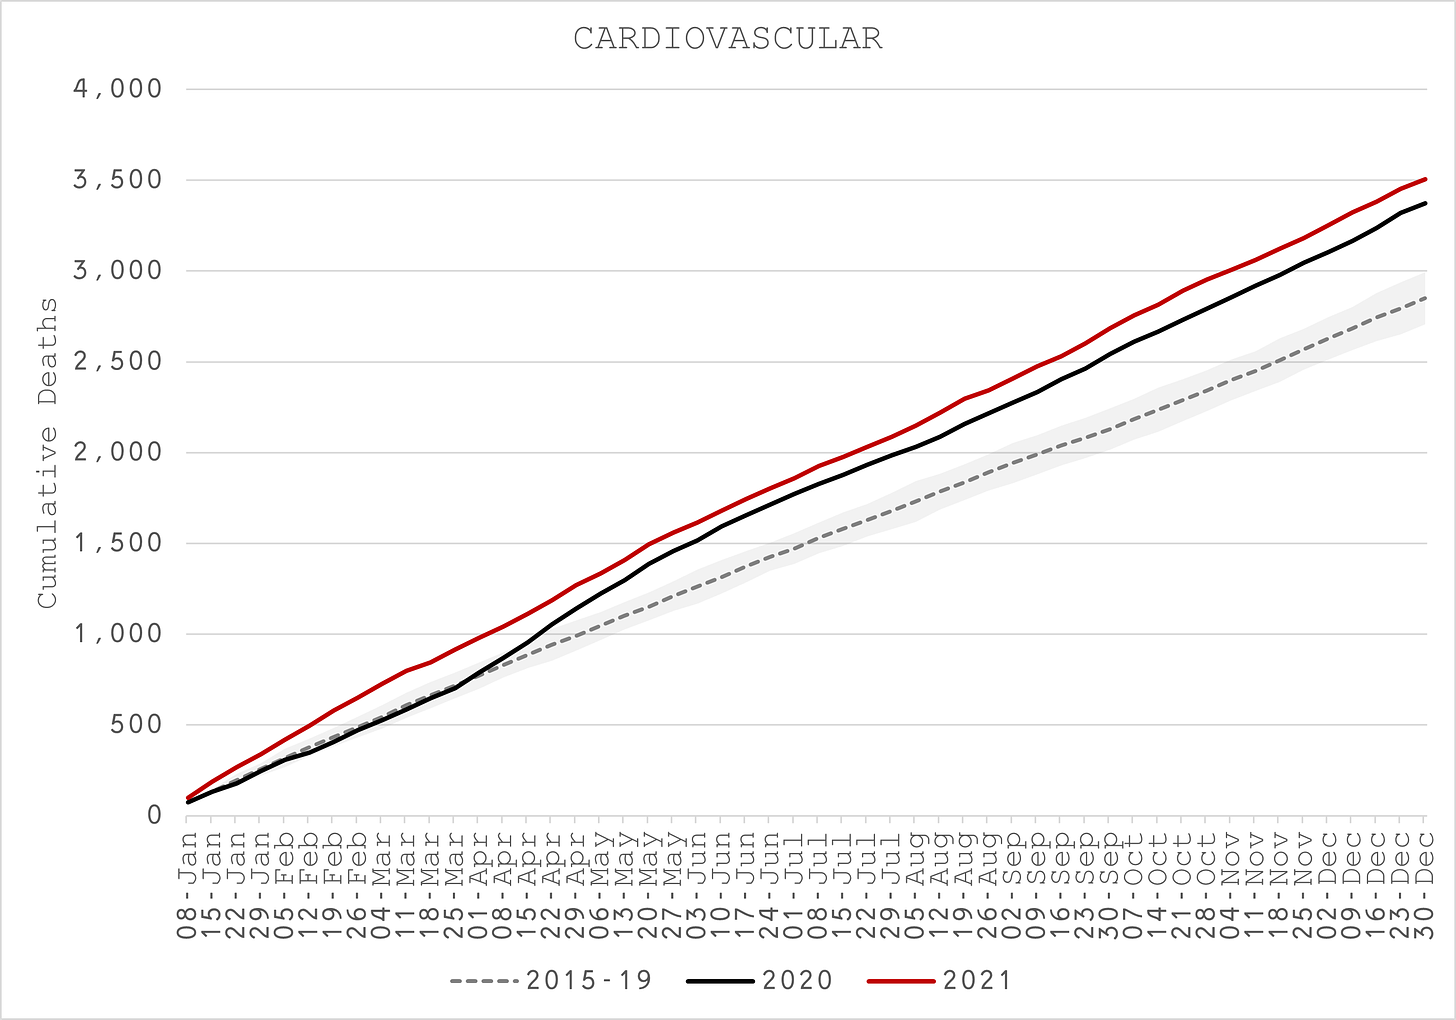
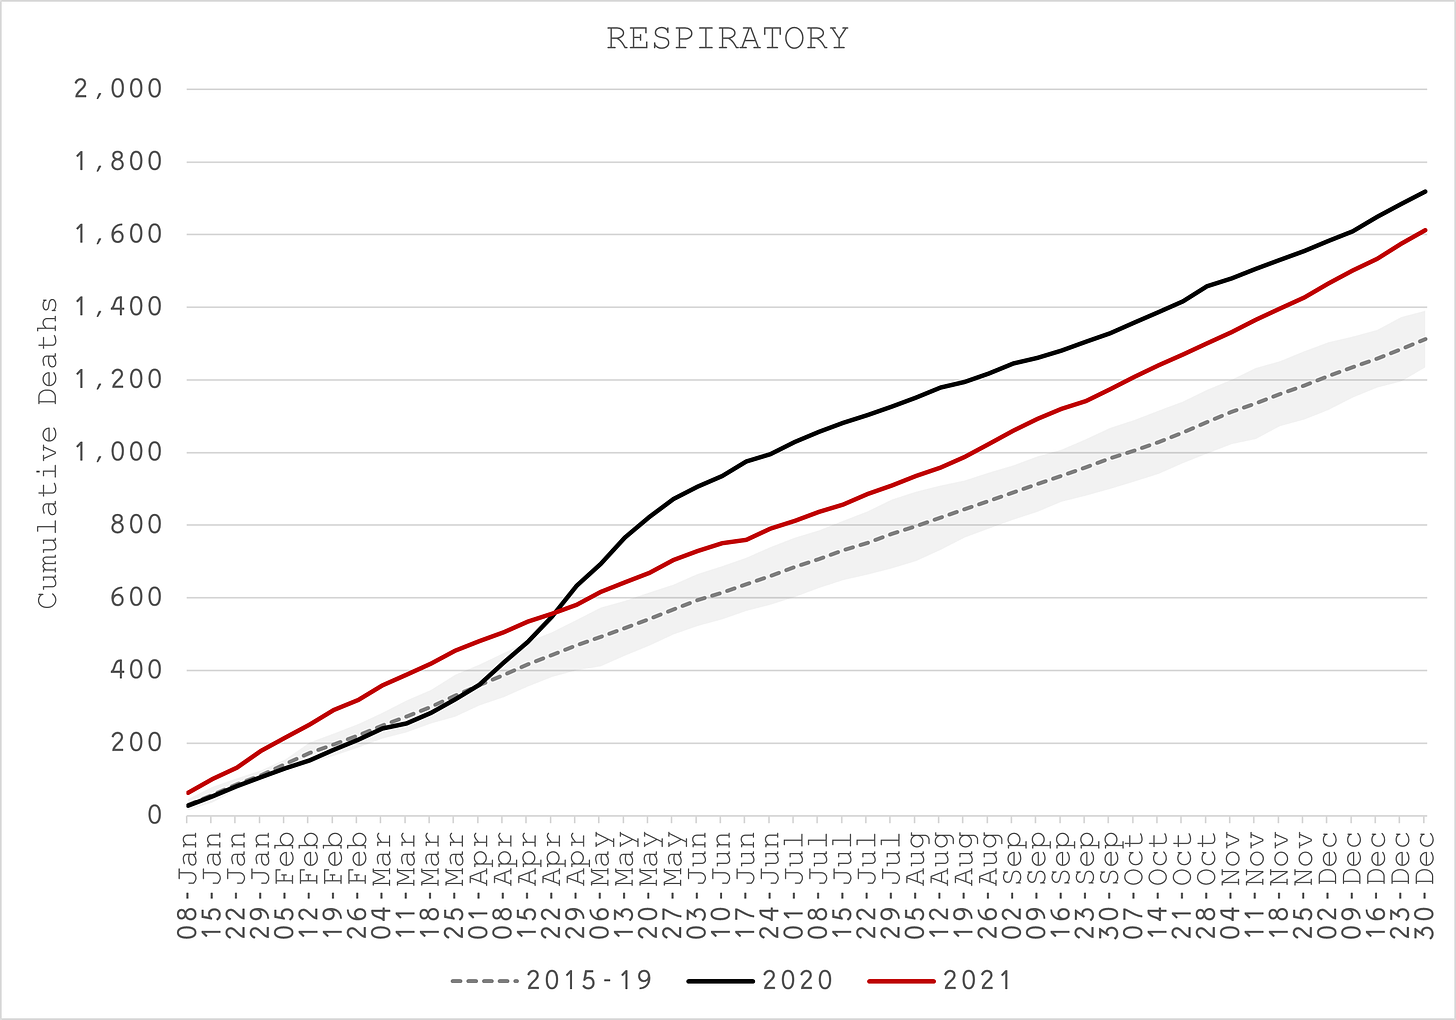
- Cardiovasculair (Figuur 24) en respiratoir (Figuur 25) zijn verantwoordelijk voor het grootste deel van de overschrijding in beide jaren.
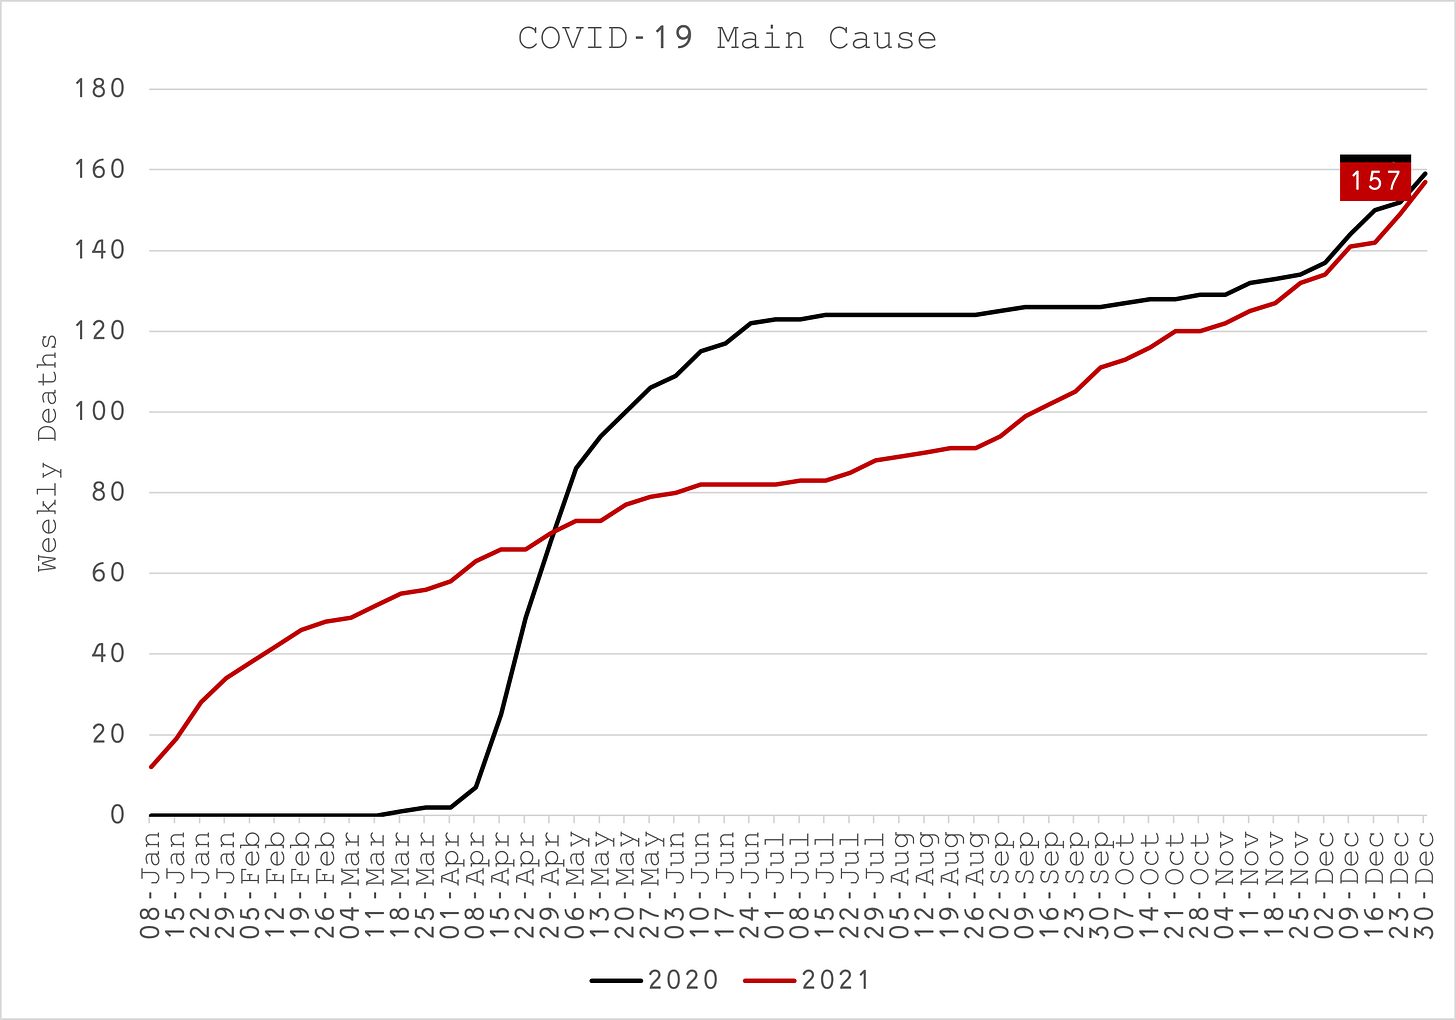
- Er zijn in beide jaren hetzelfde aantal sterfgevallen als gevolg van COVID-19 “ondanks” het vaccin waarvan wordt beweerd dat het de sterfte met wel 95% vermindert (Figuur 26). Meer ongebruikelijk is dat de COVID-19-sterfte in 2021 midden in de zomer begint, volledig buiten het seizoen. Toch is in beide jaren COVID-19 slechts verantwoordelijk voor iets meer dan 1% van alle sterfgevallen, wat niet in verhouding lijkt met de aandacht die eraan is besteed.
Sterfgevallen van 65- tot 74-jarigen
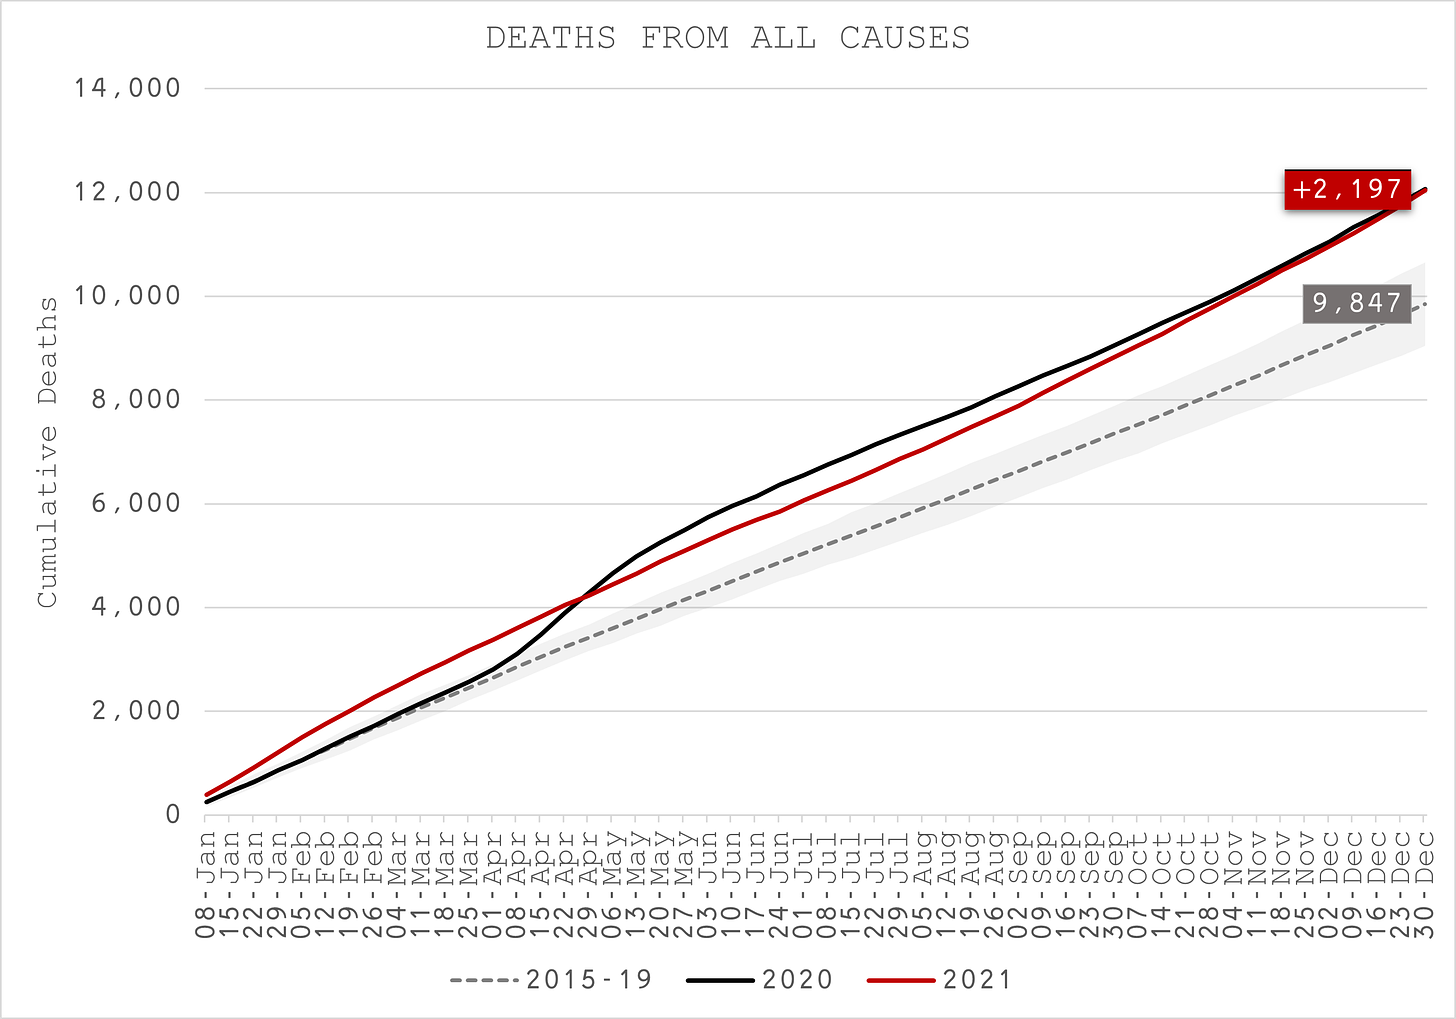
- Sterfgevallen van 65- tot 74-jarigen laten ook de duidelijke impact van COVID-19 in het voorjaar van 2020 zien. Niettemin eindigt 2021 met hetzelfde aantal doden, 22% boven normaal (Figuur 27). Nogmaals, zwarten en Iberiërs zijn aanzienlijk hoger met meer dan 50%.
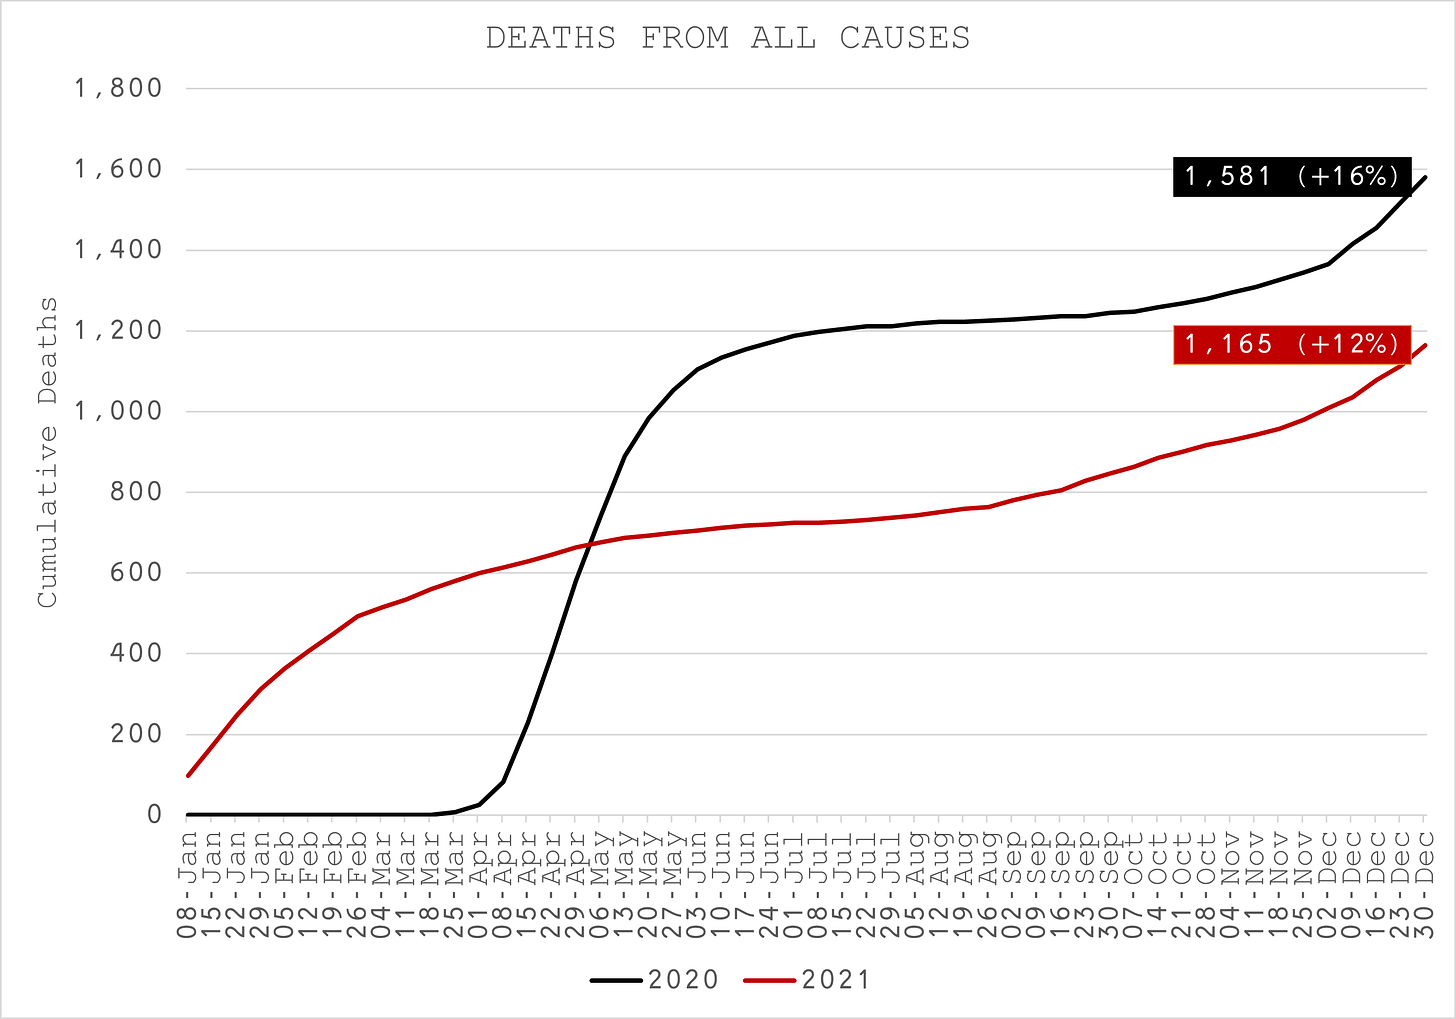
- Deze excessen zijn niet alleen te verklaren door COVID-19. In 2020 werd COVID-19 1.581 keer genoemd op de overlijdensakte, maar slechts 1.165 keer in 2021 (Figuur 28), vergeleken met ongeveer 2.200 extra sterfgevallen.
- Zelfs in deze oudere leeftijdsgroep was COVID-19 slechts de primaire doodsoorzaak bij minder dan 2% van alle sterfgevallen (Figuur 29).
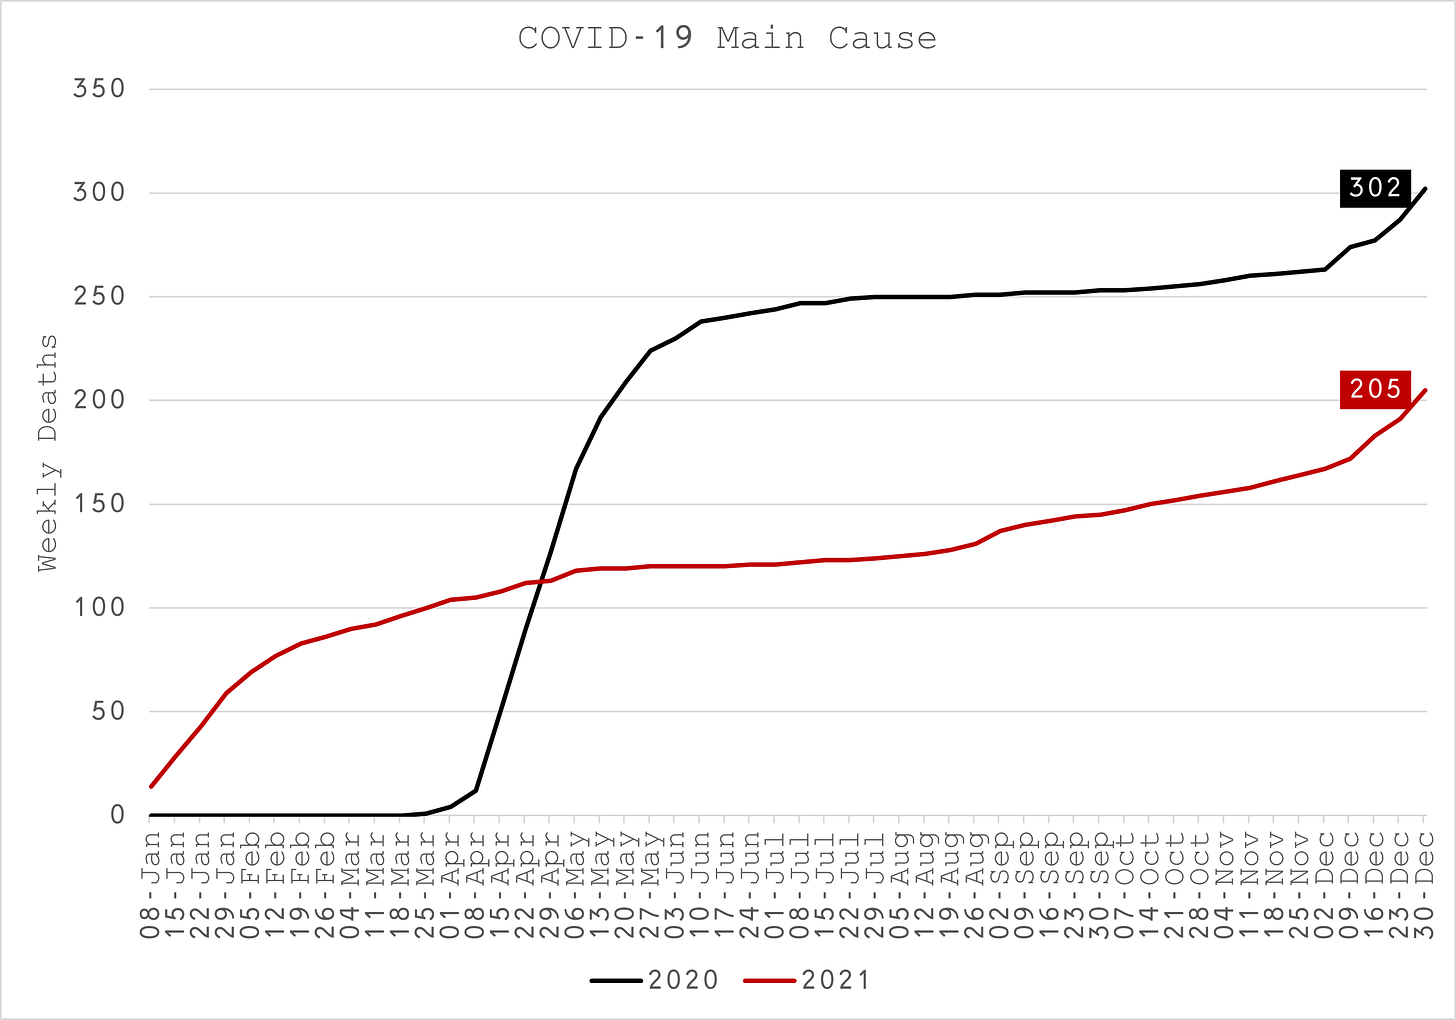
- Afgezien van de duidelijke toename van hart- en vaatziekten en aandoeningen van de luchtwegen, is de belangrijkste bron van niet-COVID-overmatige sterfte in 2020 degeneratieve ziekte (Figuur 30). Dit is waarschijnlijk te wijten aan de bevelen om niet te reanimeren in verzorgingstehuizen en het gebrek aan bezoek van familie en vrienden. Misschien speelde Remdesivir ook een rol?
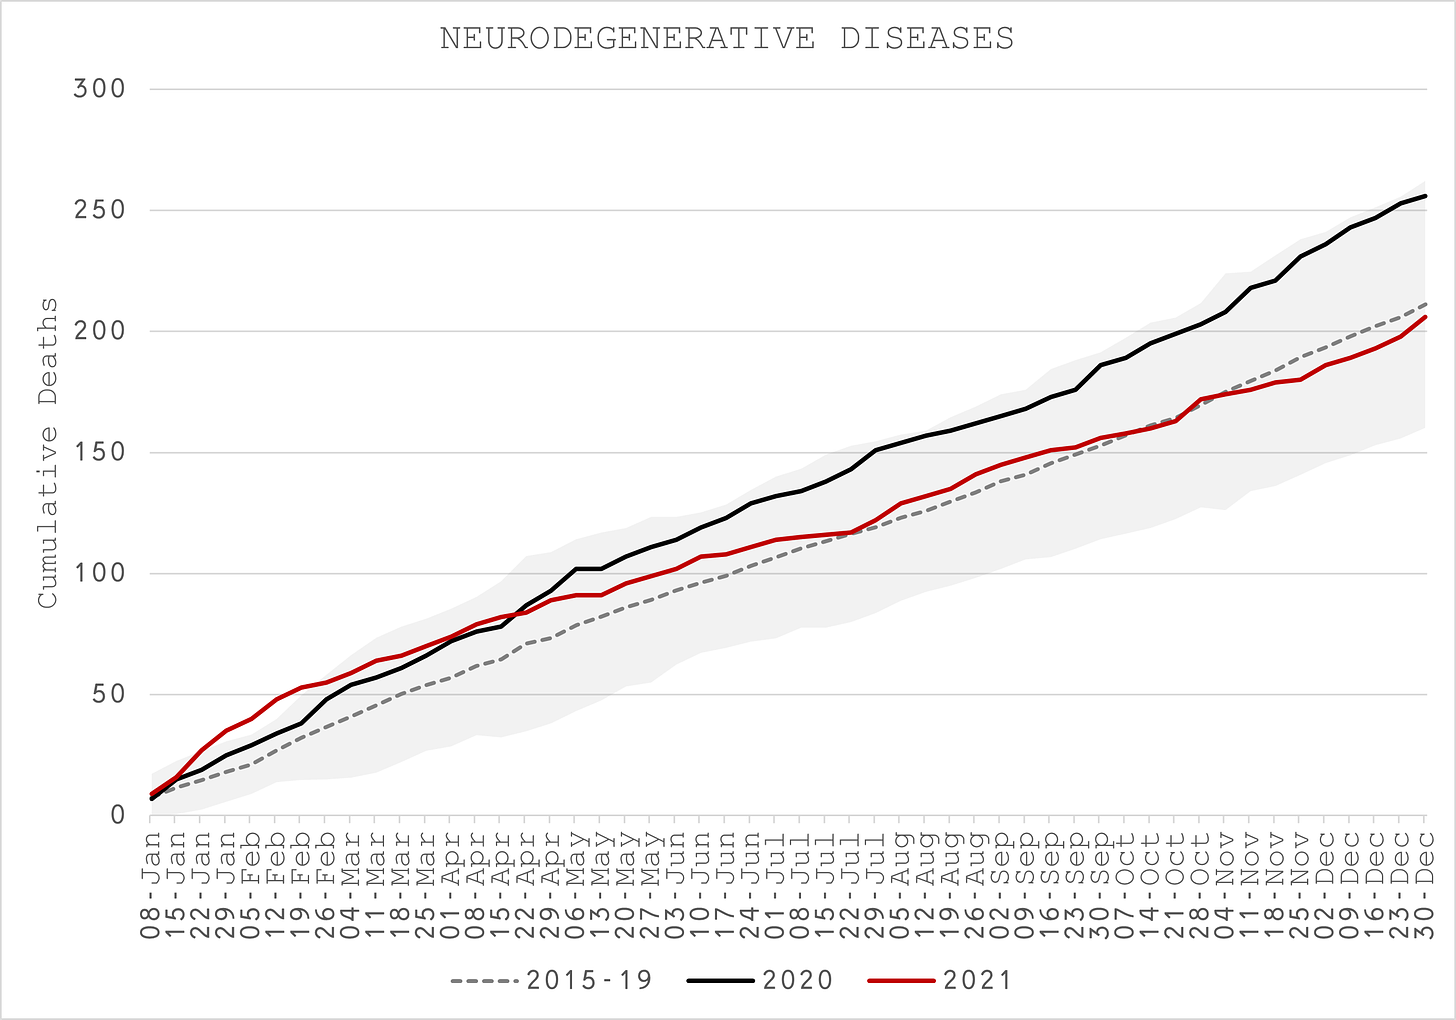
Sterfgevallen van 75+ leeftijden
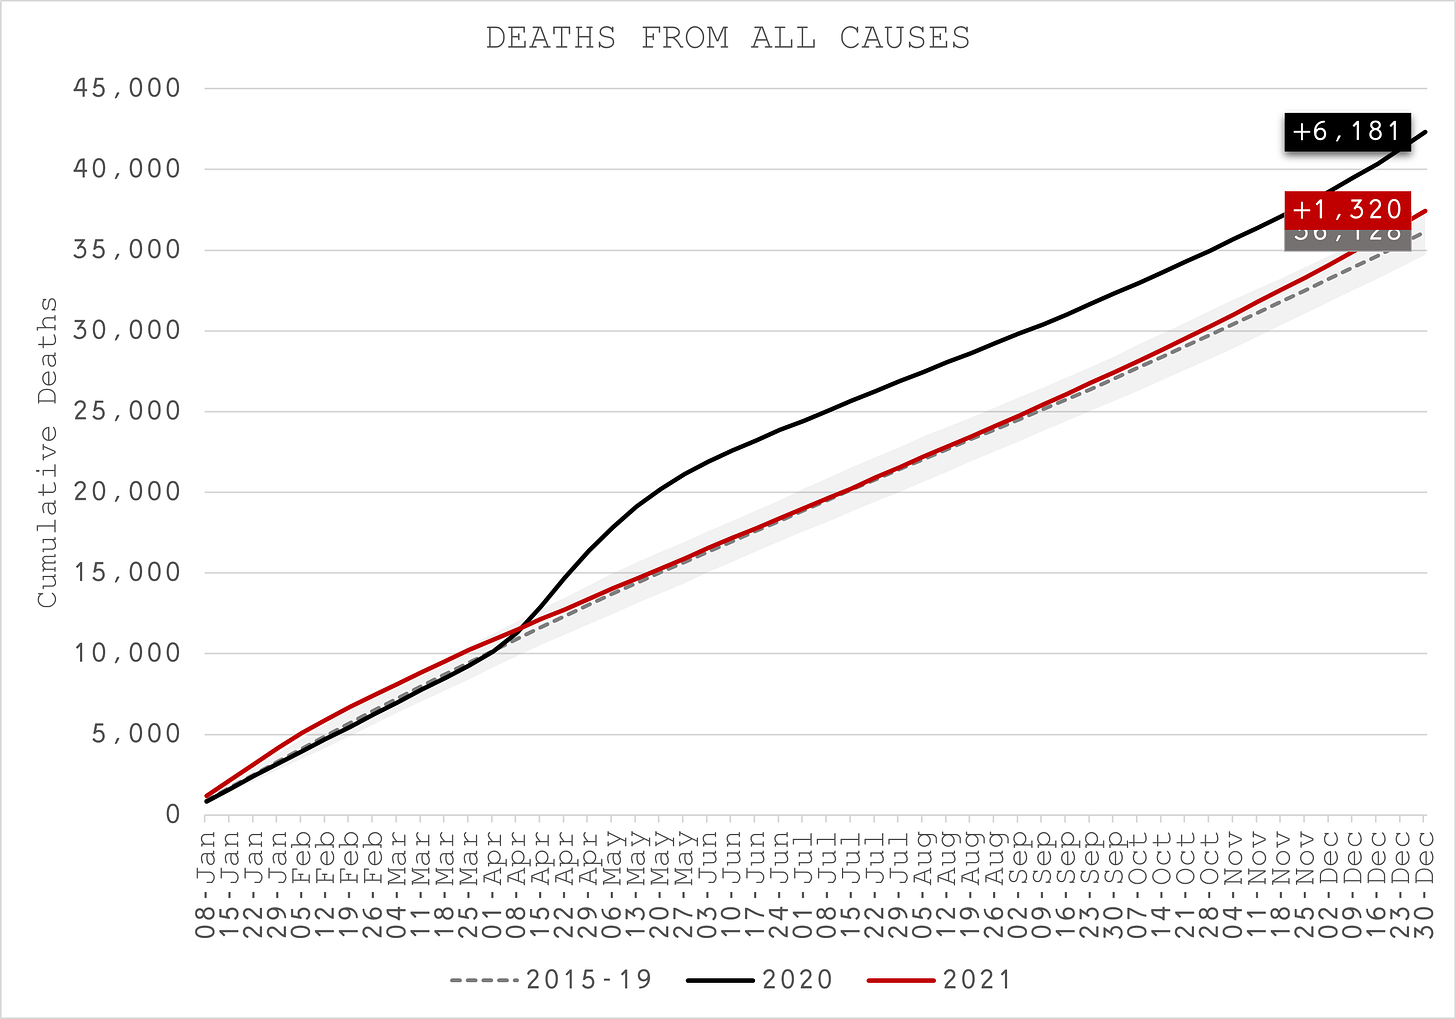
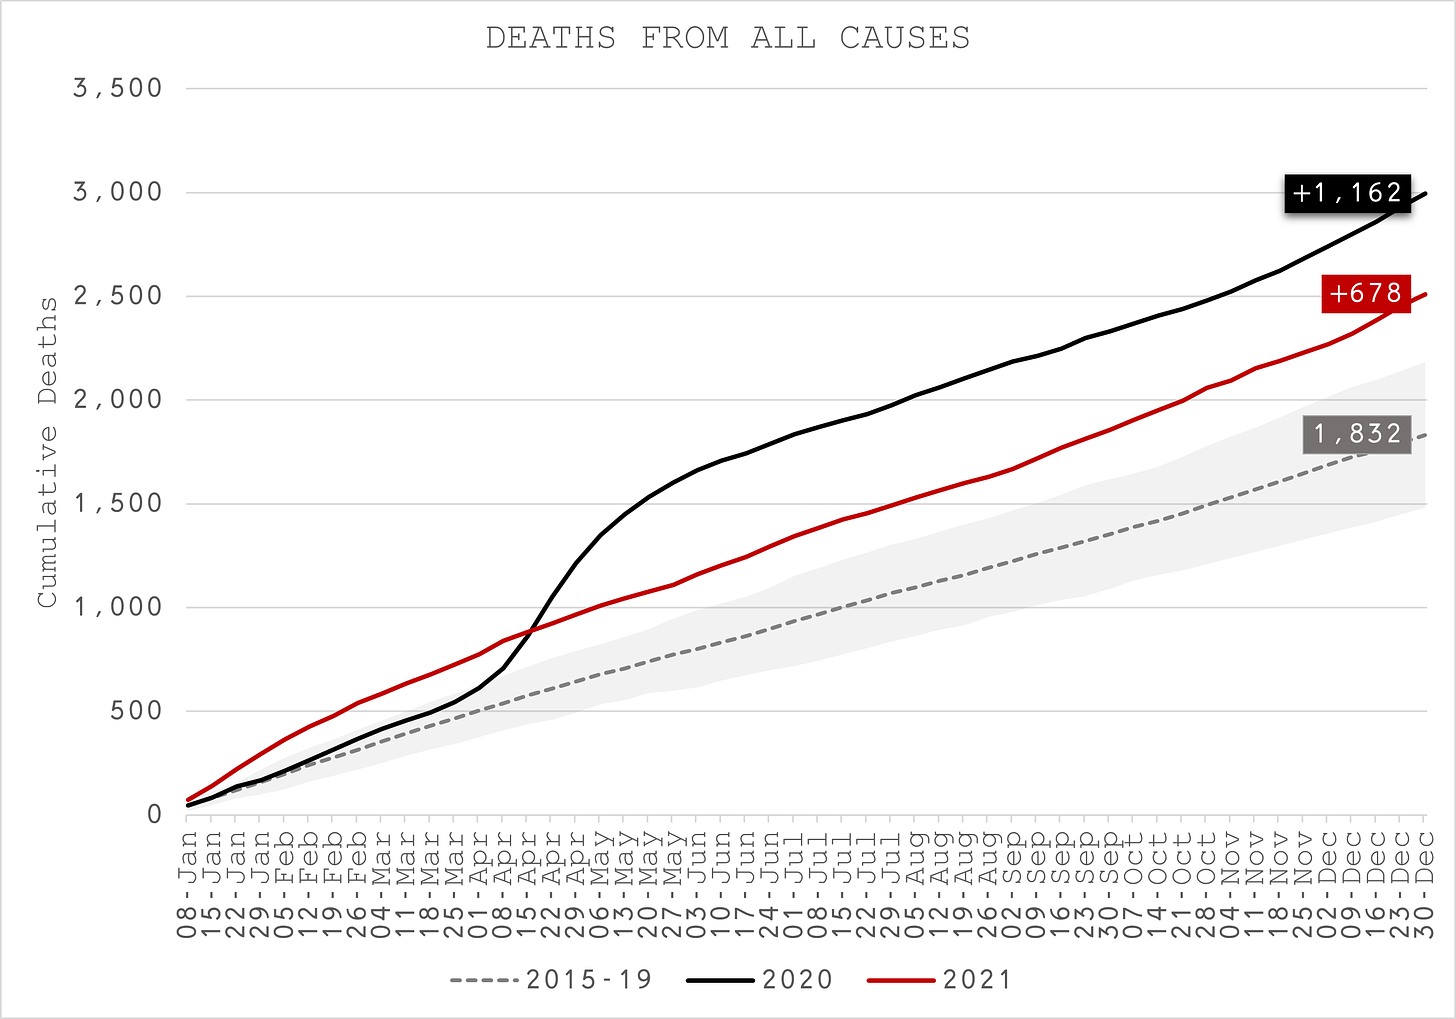
- Het is onvermijdelijk dat de sterfgevallen van 75-plussers de meest uitgesproken impact van COVID-19 laten zien, aangezien de heterogeniteit ervan bekend is vanaf de allereerste rapporten uit Wuhan en het Diamond Princess-cruiseschip. Bovendien is dit de enige leeftijdsgroep die in 2020, het jaar van de pandemie, substantieel meer sterfte laat zien dan 2021, het jaar van het vaccin (Figuur 31).
- Desondanks is slechts een derde van de extra sterfgevallen in 2020 te wijten aan COVID-19 als belangrijkste doodsoorzaak (Figuur 32). Na de seizoensgebonden winteruitbraak is COVID-19 grotendeels afwezig als doodsoorzaak voor deze leeftijdsgroep. Als er al enig bewijs was voor de effectiviteit van vaccins, dan is dit de enige leeftijdsgroep die dit aantoont en die echt van het grootste belang zou moeten zijn als het gaat om het informeren van beslissingen over de volksgezondheid. Als alternatief kan het gewoon zo zijn dat alle kwetsbaren al waren bezweken in de lentegolf.
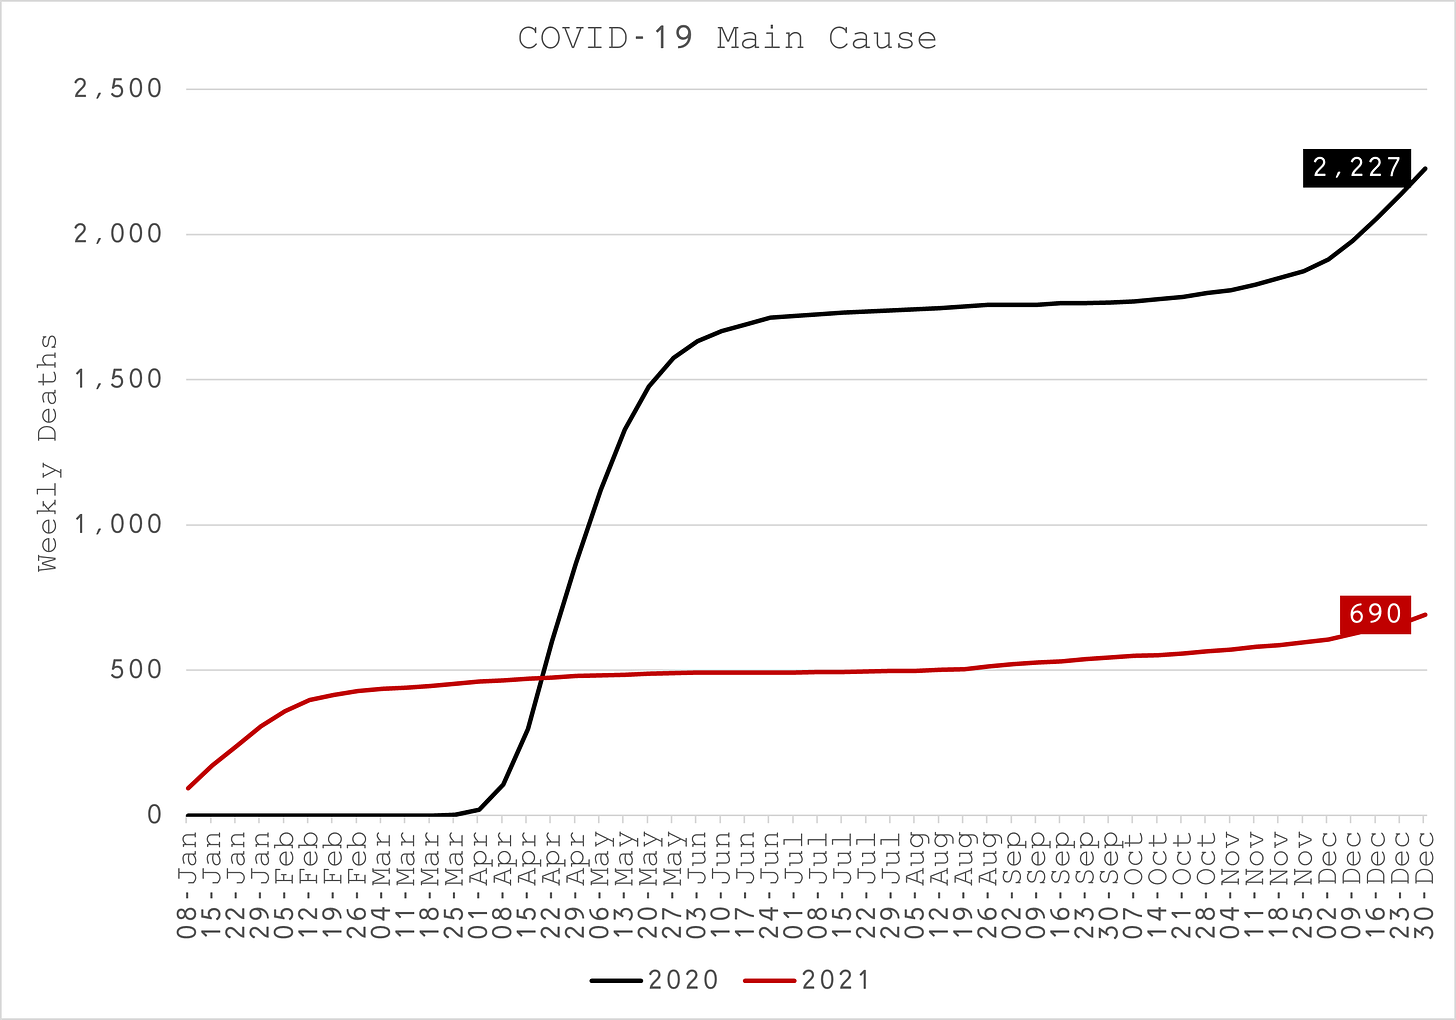
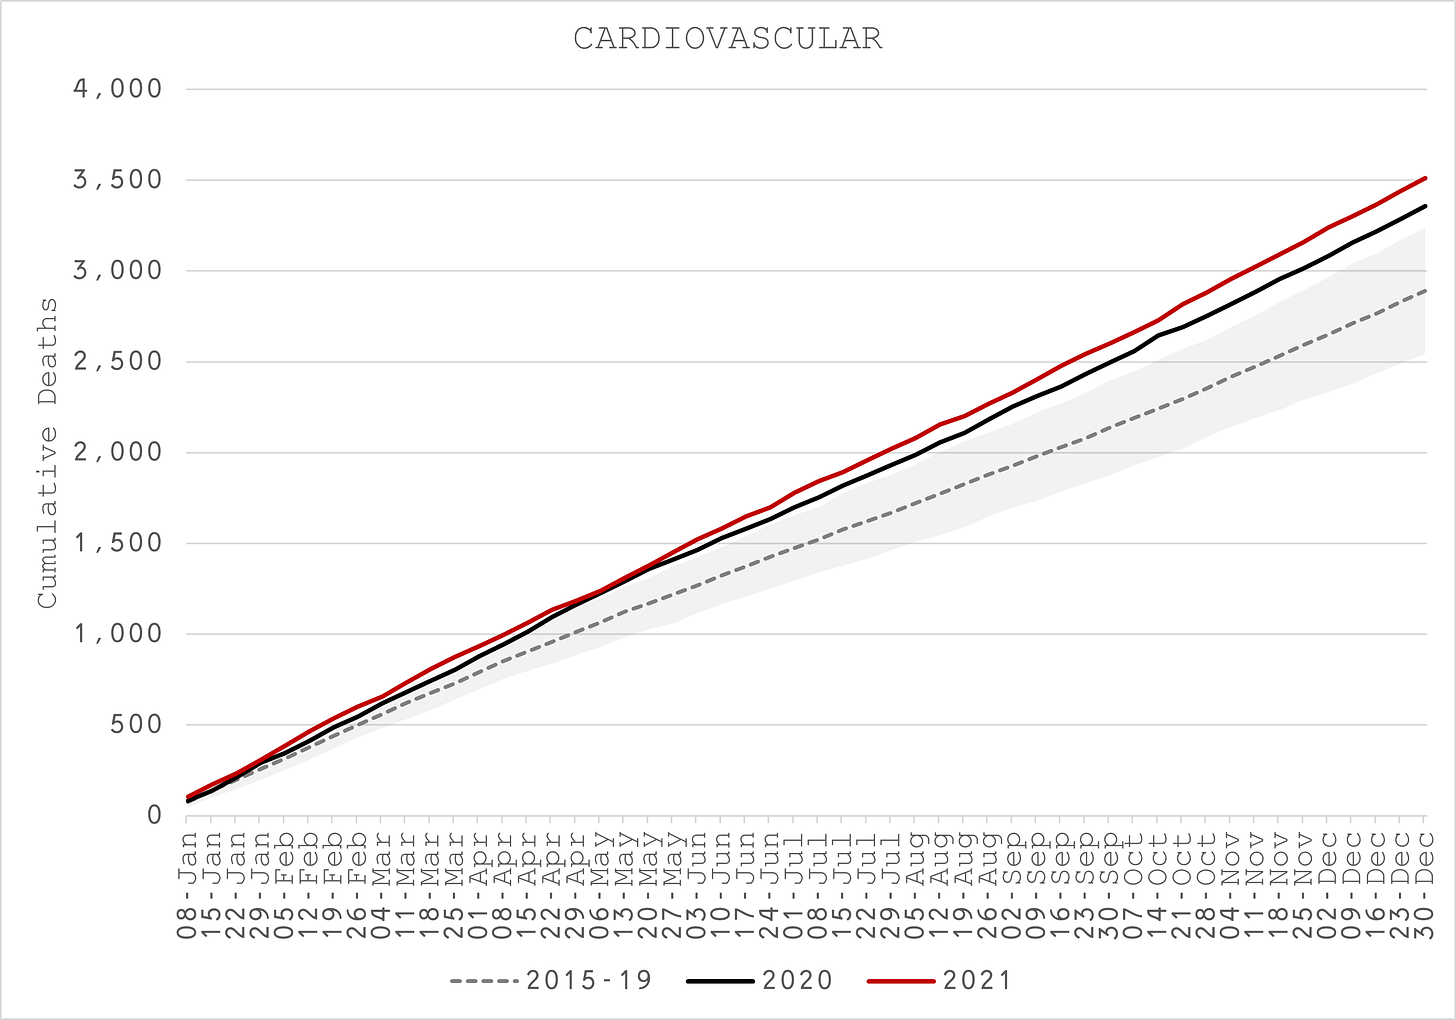
- Zelfs de niet-COVID-vermelde sterfgevallen overtreffen de verwachte sterfgevallen voor zowel 2020 als 2021, voornamelijk veroorzaakt door cardiovasculaire aandoeningen (Figuur 33).
- Ten slotte vinden we opnieuw dat het aantal sterfgevallen onder zwarten en latino’s aanzienlijk hoger is dan gemiddeld, met meer dan 60% voor 2020 en 37% voor 2021 (Figuur 34), vergeleken met slechts 17% en 4% voor respectievelijk alle etniciteiten.
Conclusion
Het is duidelijk dat naarmate je naar naar jongere leeftijdsgroepen gaat, de algemene sterfteandde sterfte aan COVID-19 in 2021 relatief slechter worden dan in 2020.
Dit staat in schril contrast met de beweringen dat het COVID-19-vaccin zowelveiligifeffectief is. Op basis van het hier gepresenteerde empirische bewijs zijn de resultaten slechter voor alle leeftijden onder de 75 jaar in het jaar van COVID-19-vaccinaties.
Bovendien blijkt dat geen van de niet-farmaceutische interventies een waarneembaar voordeel heeft gehad in termen van COVID-19-sterfteresultaten, noch als gevolg van de ziekte, noch als een factor voor de belangrijkste doodsoorzaken.
Het is ook duidelijk dat COVID-19 niet belangrijk is als enige doodsoorzaak en geen invloed heeft op degenen die het levenseinde al naderden.
Er zit veel meer in deze dataset en dat is meer dan één persoon kan behandelen. Wees gerust, er zijn nog vele anderen die aan het werk zijn om elk greintje waarheid over de situatie te onthullen.
In het kader van de voorbereidingen voor staats- en federale juridische stappen helpt het als u de auteur wijst op eventuele feitelijke fouten of weglatingen.
Thank you.

