De NOS berichtte vrijdag: "In november 3500 meer mensen overleden dan normaal". De werkelijke scoop had kunnen zijn "6.000 doden, waaraan stierven zij?". Of voor de Telegraaf "Geheimzinnige sterftegolf teistert Nederland". Het was bij de NOS echter weer een poging om de oversterfte feitenvrij op het conto van covid danwel ongevaccineerden te schuiven. Uiteindelijk klopt dat natuurlijk niet met de totale boekhouding. In NL wordt echter zo ver niet doorgerekend dus de NOS komt er hier nog eventjes mee weg. In het buitenland kunnen ze beter rekenen, zoals we zo zullen zien.

With the insertion 'partly due to the coronavirus', NOS indicates that it has not bothered to deduct the number of corona deaths from the excess mortality. These are figures that they use from rivm every day in their news, you would say that they not only have them but also trust them and find them important.
Suggestief is ook "Tijdens eerdere coronagolven werd verhoogde sterfte grotendeels veroorzaakt door Covid-19." De argeloze lezer begrijpt hieruit dat dat nu dan ook wel weer het geval zal zijn. Die Corona toch, wat een vreselijke ziekte.
Eén zinnetje in het artikel bracht mij op een idee: "Relatively speaking, excess mortality was highest in Limburg. [...] in Friesland the excess mortality was relatively the lowest."
I just checked whether that corresponded with the vaccination rate. Limburg has a vaccination rate of 83%, Friesland 80% (this varies somewhat depending on the source). It is, of course, a flimsy observation. A 3% difference is too small to see these kinds of effects. On the other hand: the vaccination rate will and must increase a few percent with draconian coercive measures... why then if it makes so little difference? Is it perhaps a threshold value above which all the virus suddenly disappears? Well, that virus keeps going around. There are certainly many other factors in this specific case: the aging of Limburg will play a major role and perhaps also the average BMI or the number of inhabitants who live close together or have a close social life, who knows.
Link between vaccination coverage and Covid admissions
It did give me the idea to look at how mortality relates to vaccination coverage in each city. After all, those figures are available and the dataset is larger. This is another detour to find out something you could determine in an afternoon if the crucial data were shared: age-stratified data on vaccination status (incl. date), date of death and cause of death. Unfortunately, we are not allowed to know them in detail, while they could still exonerate the vaccines from the hefty excess mortality in one fell swoop.
De eerste exercitie was om te kijken wat de vaccinatiegraad voor invloed had op de ziekenhuisopnames. We zien dat de ziekenhuisopnames inderdaad dalen (hoog->laag) met het stijgen van de vaccinatiegraad (links->rechts).

We also see (even though there are few cities lower than 75%) that COVID hospitalizations are halved from 70% to 85% vaccination coverage. A higher degree than 85% no longer makes a significant difference. So it is a waste of energy and unnecessary polarization to want to achieve a vaccination rate higher than 85% under duress. There are also not that many municipalities below 80%, so it doesn't help nationally either.
Link between vaccination coverage and mortality
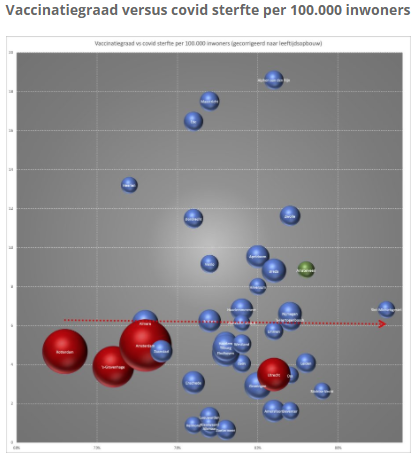
Then the vaccination rate compared to the mortality rates. Of course, mortality is highly dependent on, for example, the composition of the population. A wealthy small village with an abundance of retirees will have a high mortality rate (and a high vaccination rate). So actually nothing can be read from this graph. It could have been that there would be a convincingly lower mortality rate with higher vaccination. However, for that you need a serious disease that causes significant differences in mortality. It turns out that there is no such disease.
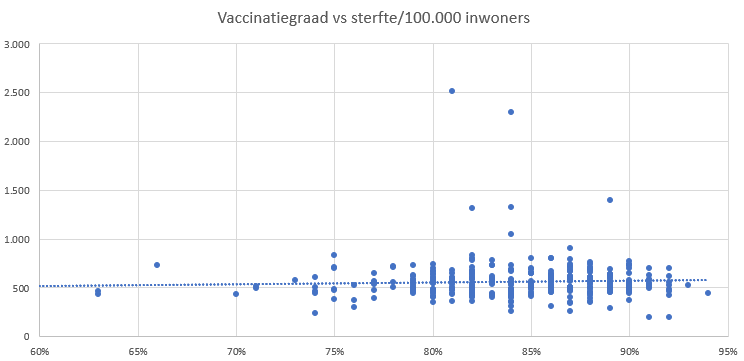
The trend line is rising slightly: more vaccination goes hand in hand with slightly higher mortality. (When choosing a different type of trend line, this effect disappears). Correcting for the average age per city did not bring satisfactory solace either, strangely enough. Excess mortality per city would be a better parameter, but we couldn't find out.
With some better data, you could think this through in much more detail. We could take the data from Belgium, or from the UK. Studies have just been published in which something like this has happened.
European Journal of Epidemiology
In the States have compared countries and states and on a better level than the exploratory beer mat above. The main finding of this statistical analysis is:
Increases in COVID-19 infections are not related to vaccination rates
S. V. Subramanian&Akhil Kumar, European Journal of Epidemiology(2021)
Uit hun interpretatie na het vergelijken van 68 landen en 2947 counties in de US citeer ik de paragraaf waarin zij verwijzen naar het wetenschappelijke "Umfeld" waarin hun waarneming past:
Growing scientific evidence on the effectiveness of the vaccines in the real world:
For example, a report by the Ministry of Health in Israel reported that the effectiveness of 2 doses of the BNT162b2 (Pfizer-BioNTech) vaccine against preventing COVID-19 infection was 39%, significantly lower than the trial efficacy of 96%. It also emerges that the immunity derived from the Pfizer-BioNTech vaccine may not be as strong as the immunity obtained from recovery from the COVID-19 virus [8]. A substantial decrease in immunity from mRNA vaccines 6 months after immunization has also been reported. Although vaccinations protect individuals from severe hospitalization and death, the CDC reported a increase from 0.01 to 9% and 0 to 15.1% respectively (between January and May 2021) in the number of hospitalisations and deaths among the fully vaccinated.
Uncertain effectiveness of Covid-19 vaccination
(University of London)
The UK data is also used for calculations. This study (pre-print, looks credible) has been released in the UK. Two data analysts from the University of London come to staggering conclusions when they comb through the data. And actually, my graphs and findings above fit in wonderfully with that, no matter how clumsy.
Their summary and conclusions are recognizable and very worthwhile:
The accuracy of any data demonstrating the effectiveness or safety of the vaccine against a disease depends to a large extent on the accurate measurements of:
- people classified as suffering from the disease;
- vaccination status;
- death notification;
- the population of vaccinated and unvaccinated people (the so-called 'denominators').
If any of these points contain errors, claims of effectiveness or safety cannot be considered reliable.
The risk/benefit of Covid vaccines is best – and easiest – measured by the all-cause mortality of vaccinated against unvaccinated persons, because it avoids the thorny issue of what constitutes a Covid case/infection. In principle, the data in the ONS vaccine mortality surveillance reports should provide us with the necessary information to track this crucial comparison over time. However, until the most recent report [7], no data in age ranges was provided, meaning that all comparisons based on age were confused (older people are both disproportionately more likely to be vaccinated than younger people and disproportionately more likely to die).
The latest ONS report does provide some relevant data based on age categories. Specifically, it includes separate data for the 60-69, 70-79 and 80+ age groups, but there is only one group of data for the 10-59 age group.
At first glance, the data suggest that in each of the older age groups, all-cause mortality is lower among vaccinated people than among unvaccinated people. [...]
Despite this apparent evidence supporting the vaccine's efficacy - at least for the older age groups - closer examination of these data calls this conclusion into question. That's because we've identified a series of fundamental inconsistencies and flaws in the data. specifically:
- In each group, the non-Covid death rates in the three different categories of vaccinated people fluctuate in a volatile but consistent manner, far from the expected historical mortality rates.
- While the non-Covid death rate for the unvaccinated must be consistent with historical death rates (it may be slightly lower than the vaccinated non-Covid death rate), it is not only higher than the vaccinated death rate, but much higher than the historical mortality rate.
- In previous years, each of the groups 60-69, 70-79 and 80+ had death peaks at the same time during the year (including 2020 when they all experienced the Covid peak in April at the same time). Still, in 2021, every age group non-Covid mortality peaks for unvaccinated at a different time, namely the moment that vaccination programs for those cohorts reaching a peak.
- The spikes in Covid mortality data for the unvaccinated do not match the actual Covid wave.
Whatever the explanations for the observed data, it is clear that they are both unreliable and misleading. We considered the socio-demographic and behavioral differences between vaccinated and unvaccinated that have been proposed as possible explanations for the data anomalies, but found no evidence supporting any of these explanations. According to the occam razor The most likely explanations are:
- Systematic miscategorization of deaths between the different groups of unvaccinated and vaccinated.
- Deferred or non-notification of vaccinations.
- Systematic underestimation of the proportion of unvaccinated people.
- Improper population selection for Covid deaths.
With these considerations in mind, we have made adjustments to the ONS data and have shown that they lead to the conclusion that the vaccines not reduce all-cause mortality, but rather cause real spikes in mortality from all causes shortly after vaccination.
[...]
We believe that it is up to those who offer competing explanations for the data to explain how and why the data is the way it is. We explained that it is very unlikely that different social and ethnic factors can explain these strange differences in the ONS dataset. In the absence of another better explanation, Occam's razor would support our conclusions. In any case, the ONS data provide no reliable evidence that the vaccine reduces all-cause mortality.
In short: The vaccines are failing, the data look unreliable (at least in the UK but in the Netherlands RIVM does not excel in this either and we are simply not allowed to see them), there is no link between mortality and vaccination coverage and other research actually says so too.
Am I perhaps cherry picking? That could be possible, but surely statistical studies should never be able to produce such results, no matter how you look at it? It's like someone sold you a container of boullion and once you taste a spoonful of it, it tastes like sugar water. That shouldn't be possible. That requires further research. The desired effect of the vaccines should be obvious, especially in such a risky action as the hasty development and reversible injection of a novelty, intended exclusively for use in emergency conditions, at the enormous costs invested in it. The capital that has now been built up in government promises calls for a collapse.
If the vaccinations have an effect at all, it seems that there is not so much less but in any case it does other people are dying. A meager harvest for so many pretensions.
The Eucalyptic Society is continued with the analysis where I stopped (het zijn bijtertjes, vooral voor die Akkermans moet je in de gaten houden), met grafieken waarop ook te zien is hoe de grote steden zich onderscheiden van het "platteland". Klik op de grafiek om naar dat artikel gegaan.