What can you do with the RIVM updates
The RIVM reports something daily about the testing capacity, admissions and deceased people. The reports require some practice in reading and interpreting.
Positive tested persons
The RIVM reports daily how many people they have tested, including the total so far. You can see that hard work is being done. It says nothing else about the degree of infection, increase or decrease.
Hospital admissions
The first key figure is the total number of patients who have been admitted to hospital, i.e. the influx. Whether they are still in the hospital is left open. We don't know how many could go home immediately. So it gives no indication at all of the occupancy of the beds or the relationship to capacity. They can probably be looked up somewhere because not a word about that either.
The other figure is the number of admissions in the last 24 hours.
Unfortunately, we are not informed about the patient outflow and what condition those patients are in.
Mortality rates
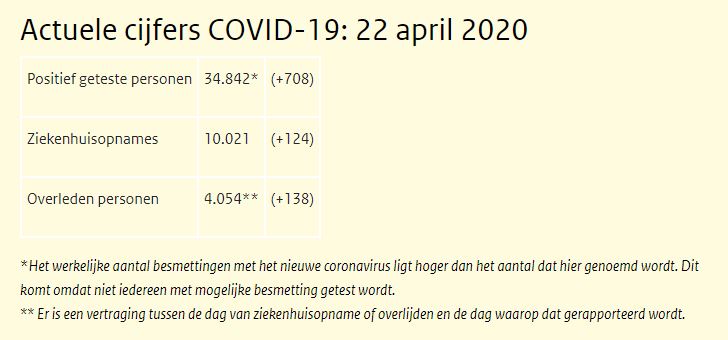
The corona deaths of the past 24 hours and the total number of people who died from corona are also communicated daily. The counter now stands at about 4,100 with the note that this only concerns people who have tested positive, so 'the actual number is higher'. Maybe I expect too much from a report. We're looking at a public page, aren't we? They again seem to be internally oriented work evaluations, timesheets with a specification of actions. So these figures also only say something about their limited testing protocol. It is not information that has any external significance.
RIVM is now working together with CBS. CBS keeps track of all mortality figures, not just corona. The law of large numbers means that you can see exactly how much 'excess mortality' there is at CBS compared to comparable periods in previous years. It is nice that we now have only one virus around, to which excess mortality can therefore be conveniently assigned.
If you follow the RIVM/CBS reports over time, you do see some kind of connection. The actual mortality rates are about 120% (i.e. a factor of 2.2) higher than the RIVM reports. That may change over time, but it's a handy rule of thumb for now. I cannot explain why the RIVM reports figures that it knows are more than half too low.
Delay
The reporting has sometimes been delayed. This invariably happens on weekends and holidays. This led to hilarious scenes when the NOS news came up with optimistic mortality and admission figures for a number of Sundays in a row (because they were not reported), only to go back to the negative on Monday/Tuesday in a gloomy tone (only then were the weekend figures added). Because on Monday there were always suddenly many more than 'yesterday'. And it went just as well!
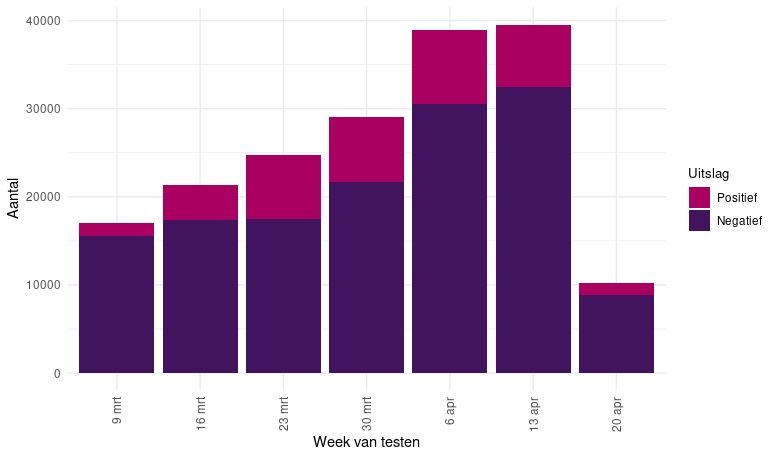
Sometimes something extra happens: a bonus graph!
The graph below (the week of April 20 has just started, which is why it is still a small bar) shows that roughly 25% and later 10% of the people they test are positive. Based on the Sanquin blood test, RIVM has communicated that the infection is about 3%. The graph below tells us that the tests are done when corona is suspected. Other than that, there is little to be deduced from it. Yes, that they usually misjudge. I wonder if that's the reason they publish it.