
Roland Brautigam pointed out figures to me New South Wales, Australia, following the previous post. They are indeed in line with the findings from the Cleveland Clinic study. Of course, these are only small numbers and a weekly overview is not representative – but there is plenty to see, despite the large margins that you have to think about. This was the screenshot:
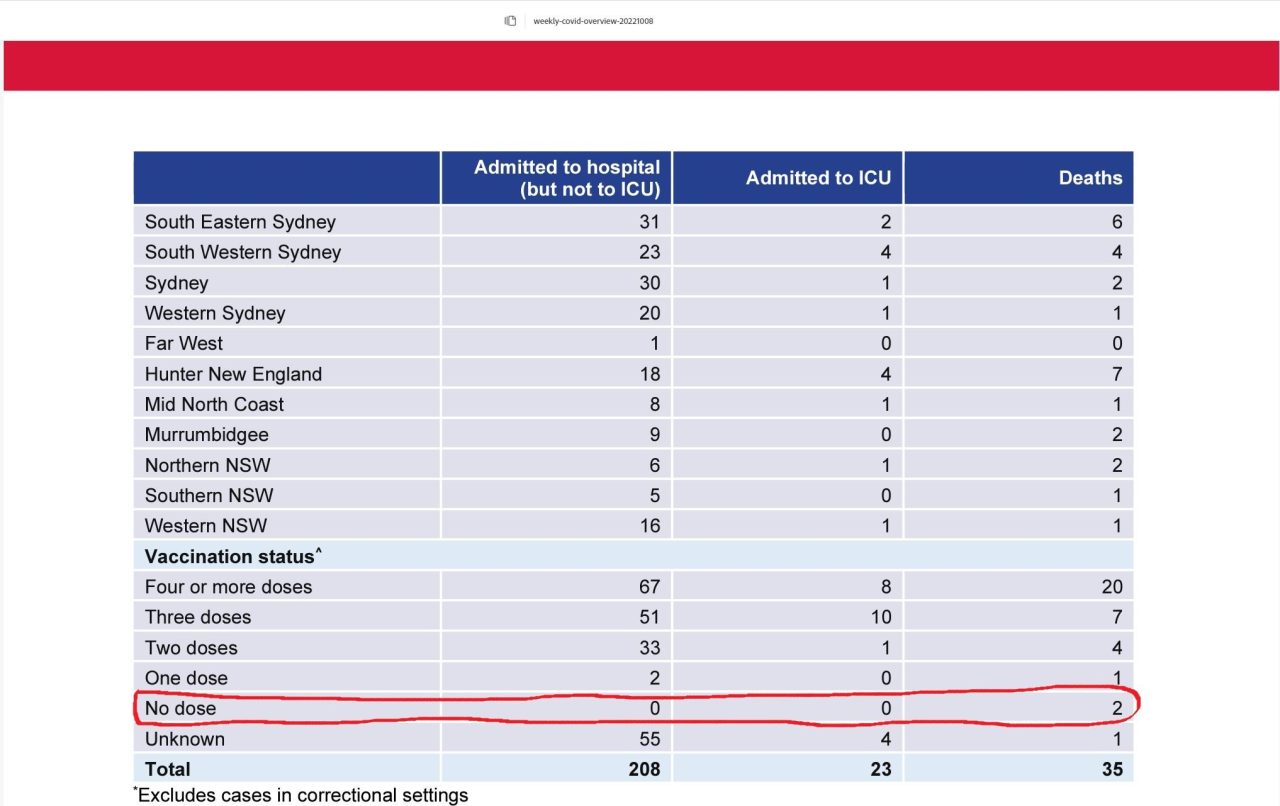
What is important here: they are absolute numbers. Then it will be said:
"Yes, but you have to compare that with the vaccination percentages. Of course, more vaccinated people are being admitted, after all, almost everyone in Australia has been vaccinated!"
Frequently heard objection
I wanted to be ahead of that, so I already did that.
Vaccination rates according to OurworldinData:
- 1 dose: 85%
- 2 doses: 83%
- Booster: 75%
85% have taken the first dose. 15% not, so they are Unvaccinated.
Of the 85%, there is still 2% who is 1 dose because 83% have taken a second one.
Of the 83%, 8% have not taken a booster, so 8% Stays on 2 doses.
75% is then divided among 3 or more boosters.
Below are the figures from the screenshot. I only ranked them from lowest to highest. In the other table, I have shown them as percentages of the total of that column.
Absolute numbers
| Share in population | Recordings | IC | Deaths | |
| 0 Doses | 15% | 0 | 0 | 2 |
| 1 dose | 2% | 2 | 0 | 1 |
| 2 doses | 8% | 33 | 1 | 4 |
| 3 and more | 75% | 118 | 18 | 27 |
| Totals | 100% | 153 | 19 | 34 |
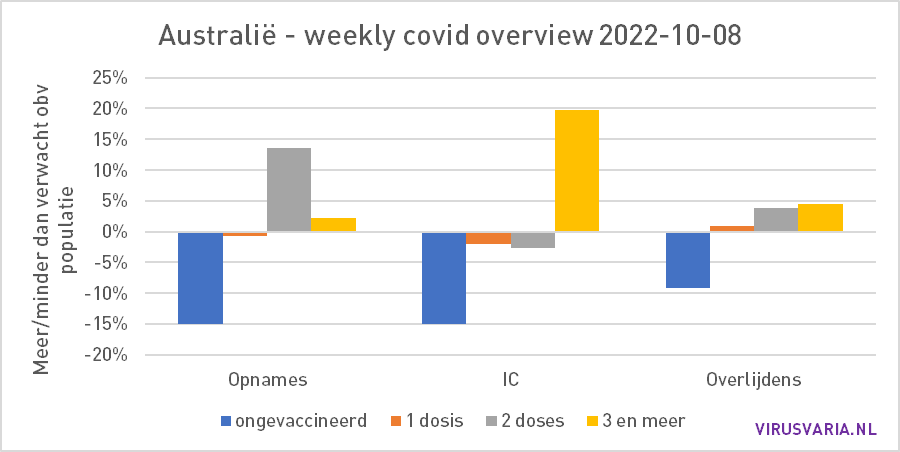
Relative percentages
| EXPECTED PERCENTAGE | ACTUAL PERCENTAGE | |||
| Recordings | IC | Deaths | ||
| 0 Doses | 15% | 0% | 0% | 6% |
| 1 dose | 2% | 1% | 0% | 3% |
| 2 doses | 8% | 22% | 5% | 12% |
| 3 and more | 75% | 77% | 95% | 79% |
The graph shows the difference between the expectation based on the vaccination percentage on the one hand and the realized admissions / ICU / deaths on the other. The unvaccinated get sick much less often than vaccinated people, less in the ICU, fewer die than you might expect – and that's not even counting the propagated vaccine effectiveness.
Some remarks: The 0 admissions and ICU and even mortality in NSW were seen from week 38 to 43 (peak flu/covid season).

The reality is that the extra boosters are now used relatively often in the elderly and people who fear the effects of an infection with flu or corona for health reasons. In other words, the group 3+ and especially the 4+ shots will not be representative of a population at all. And comparison is hardly interesting or even scientific. So you have to compare these numbers with age and medical history. You are at a few percent distortion. And what are you measuring?
The 'virus' has still not been isolated. Therefore, in principle, the PCR test is already a rogue activity! In addition, the syringe is still a genetic experiment that will continue until December 31, 2023. Maybe make more propaganda about the fact that people are just lab rats when they get the syringe instead of writing articles that are not true because the very beginning of this fear for a non-existent virus has never been understood!