
Why We Need a New Norm for Mortality Rates
This memorandum was sent in PDF form on 16 April 2025 to Dr M.C. (Ria) de Korte-Verhoef, member of the NSC faction and to the Standing Committee on Public Health, Welfare and Sport. An in-depth report, From expectations to norm mortality, has now also been published and sent to those involved.
Report: From expectations to norm mortality (PDF)
Abridged version (note, according to this post): The need for a norm mortality (PDF)
Summary
Since 2021, there has been an unexplained structural increase in mortality rates in the Netherlands. RIVM's current calculation model for excess mortality includes these recent years with increased mortality in its calculations for expected mortality. As a result, excess mortality will eventually 'disappear' from the statistics, without the underlying causes being clarified. This article highlights why a prediction of mortality should not be confused with what we consider normal or desirable mortality, and presents an alternative "Model for Norm Mortality" that is better suited for policy purposes.
The difference between expectation and norm
Government institutes such as RIVM and CBS regularly calculate mortality rate forecasts. These predictions are based on historical patterns and serve as a frame of reference (also for policy advice) to determine whether there are more deaths than expected (excess mortality) or fewer (undermortality) in a certain period.
The fundamental problem in the current methodology is that an expectation is confused with a norm.
To make this difference clear, we can look at an everyday example: the body weight of the Dutch. The average Dutch person is getting heavier and heavier. If we were to make a prediction based on historical trends, we would expect this trend to continue. But that doesn't mean that an ever-increasing average body weight should be considered 'normal' or 'desirable'. That is why health institutes use the concept of 'target weight' – a normative measure that does not automatically move with actual developments. You set a target weight, based on what is healthy. And that is a BMI (body mass index) of up to 25 kg/m2.
The trend break in mortality rates
Since 2021, there has been a continuous increase in mortality rates in the Netherlands that deviate from the long-term trend before 2020. Statistics Netherlands (CBS) has explained the sudden increase in 2020 due to Corona. And has explained the increase that has been sustained since 2021 by pointing to an ageing population (see Figure 1).
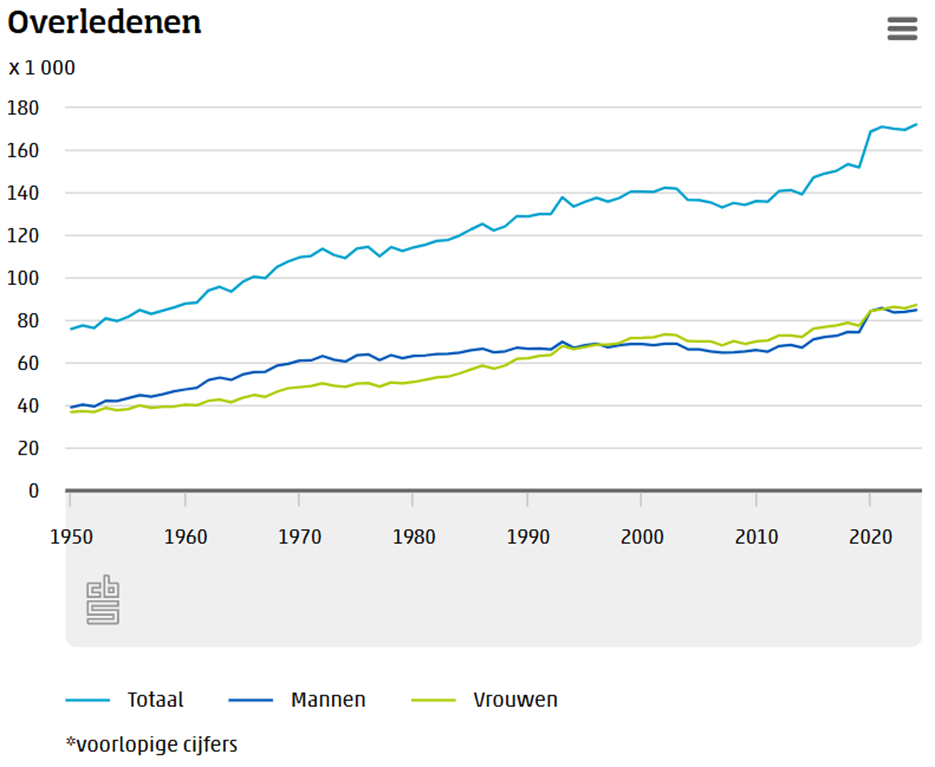
Source: https://www.cbs.nl/nl-nl/nieuws/2025/07/172-duizend-mensen-overleden-in-2024
By applying a scientifically accepted method (Age-Standardized Mortality Rate, ASMR), in which both population growth and the ageing effect are completely neutralised, it appears that there is a significant break in the trend. In this analysis, the population composition of 2019 is used as a basis for each year. As a result, the absolute numbers of deaths are no longer shown, but the mortality probabilities over the years. Based on this, Statistics Netherlands (CBS) draws up the long-term trend in absolute mortality rates. Since 2010, this has resulted in a gradually rising trend line (see the light blue dotted line in Figure 2.) from approximately 145,000 per year in 2010 to approximately 152,000 per year in 2020 (see Figure 2).
The increase in 2020, which has not returned to the previous pattern since then, leads to a structural increase of approximately 152,000 to approximately 170,000 deaths per year from 2021 onwards. The increase in 2020 is entirely attributable to Corona. But the increase from 2021 cannot be explained by Corona, nor by population growth and/or aging and is therefore "unexplained".
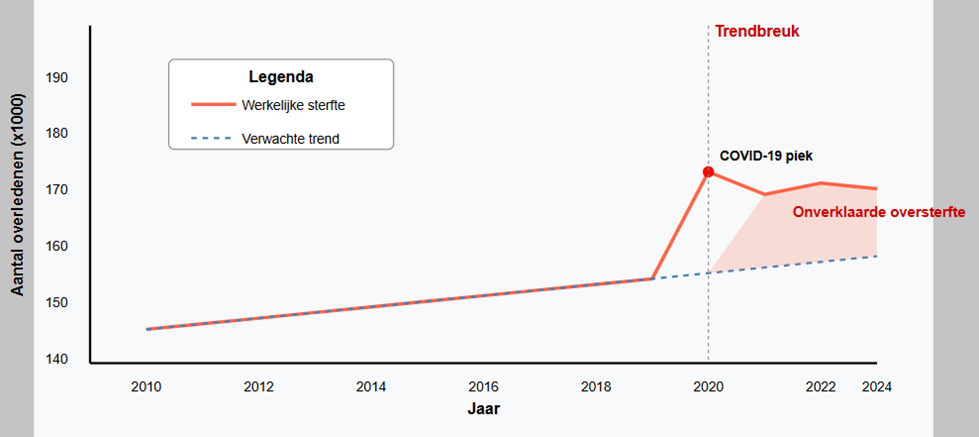
Figure 2: CBS Stylized Mortality Rates trend with trend break
The changing baseline: from CBS to RIVM
Historically, RIVM used a method in which peaks in mortality (e.g. during flu waves) were not included in the calculation of the forecast. This had an important signalling function: as soon as the reported number of deaths fell outside the expected bandwidth, there was apparently an epidemic or other special circumstance.
During the corona pandemic, CBS took over the reporting. CBS used a different methodology, based on the population structure and historical mortality probabilities. The population is slowly growing, but we are also slowly getting older. This method was better able to identify structural changes in mortality rates.
In 2024, RIVM took over the report again, but with significant adjustments:
- The upper limit was increased by 17%
- The bandwidth was increased by 34%
- The peak in expected mortality was brought forward by one month
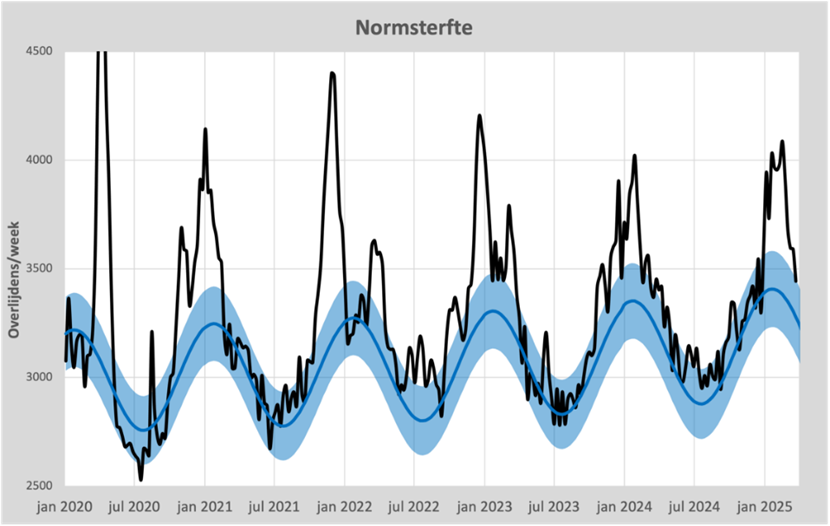
As a result of these adjustments, almost all excess mortality is now within RIVM's expectations (see Figure 3). As a result, the signal function of the mortality rates has largely been lost. Only in the event of very severe mortality waves are the figures still rated "Elevated".

Source: https://www.rivm.nl/monitoring-sterftecijfers-nederland
Figure 4 shows the increase in the RIVM bandwidth compared to the bandwidth as presented by CBS.
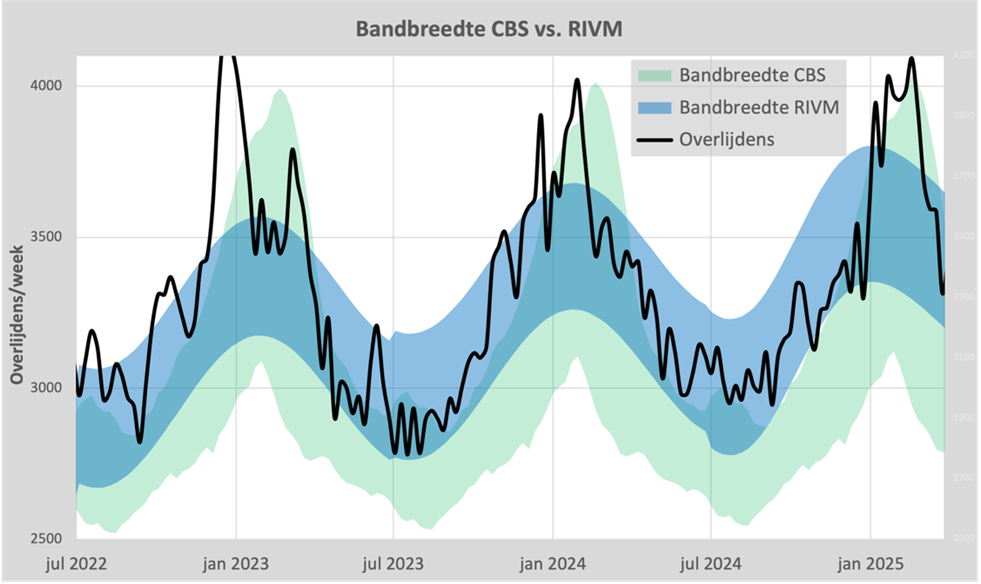
Source https://steig.nl/blog/2023/12/31/oversterfte-van-cbs-naar-rivm/ (updated version)
The Model for Norm Mortality
We have developed an alternative model that combines the best features of both the CBS and RIVM approaches: the Model for Norm Mortality. This model:
- Determines the annual average in a manner comparable to that of Statistics Netherlands, based on demographic data and historical mortality probabilities before the trend reversal. This method is described in this article .
- Calculates the bandwidth as RIVM did: a sinusoidal curve with an amplitude of 6% and the peak on February 1
The result is shown in Figure 5.
The crucial difference is that this model does not automatically incorporate years of unexplained excess mortality into its baseline calculation. As a result, excess mortality remains visible, even if it persists for several years.
Conclusion and recommendations
RIVM's current method for calculating excess mortality has a fundamental problem: it normalizes undesirable trends without explaining or addressing the underlying causes. This is not only scientifically impure, but also leads to policy choices based on incomplete information.
The Model for Norm Mortality that we developed offers a valuable alternative that:
- Make a clear distinction between expectations and normative standards
- Preserve the signal function of mortality rates
- Keeps structural changes in mortality rates visible, even if these years persist
For a responsible health policy, it is essential that we not only know what we expect, but also what we as a society consider normal and desirable. In the words of Professor of Probability Theory Ronald Meester: "After all, what we expect should not be confused with what we should consider normal."
April 16, 2025
Drs. H. Steigstra
Drs. A.E.J.C. Theunissen
"It is a capital mistake to model excess mortality with data after a trend reversal. This normalizes mortality that is not normal. Every epidemiologist should know this, and it is certainly not done abroad (Canada, United Kingdom). Steigstra and Theunissen put their finger on this blunder by RIVM and CBS."
Dr. Maarten Fornerod
biomedical scientist specialized in statistical analysis of Big Data
"In this crystal-clear report, Herman Steigstra and Anton Theunissen explain why correct modelling of mortality is essential. Existing definitions of excess mortality fall short; Steigstra and Theunissen therefore make a sharp distinction between predictions and normative standards. After all, what we expect should not be confused with what we should consider normal.
With scientific independence and statistical soundness, the authors convincingly demonstrate why a norm mortality is needed as a new reference. This report helps policy, science and society to put mortality figures in the right perspective and make responsible decisions."
Prof. Ronald Meester
Professor of Probability Science
"As a former interim director of CBS, I know how important it is for models to be clear, verifiable and scientifically defensible. When expectations are elevated to the norm, the way is open to normalizing deviations, without prior social debate or scientific consensus.
This report does exactly what is needed: it requires reconsideration. Not out of distrust but out of a sense of responsibility, because we cannot afford to fit structural mortality into our models as a matter of course, without first understanding them thoroughly.
Steigstra and Theunissen take a well-founded step towards a more objective, transparent approach to excess mortality. Their proposal deserves to be seriously considered and discussed – inside and outside the walls of institutions."
Ir. Jan G.M. van der Zanden
ex-interim director of Statistics Netherlands
Thank you for your work!
Again, the abnormal must not become the new normal and that has been explained in all clarity.
Even "Dummies" will have to understand this
Respect for you and your perseverance and many thanks for that.
Unfortunately, I don't expect the brain cells and especially the conscience to suddenly start working with the government and their clubs. They are not concerned with logic, but with deception of the people and arrogant that they are, they think they can get away with it. I would also include FvD as an addressee, because they dare to put this on the agenda, I don't expect anything from NSC because they are partly scientists and they are generally not independent, which equals unfair in these bizarre times.
It's nice that you are so persistent. Cracks have to appear in that sheet piling at some point.
I would send a copy of 'Geimpft – gestorben' by Arne Burckhardt. Saw Jan Bonte reading some examples from that book this week in conversation with Marlies at DNW. Good conversation again. All the facts combined, of course, we know very well what causes that excess mortality, but owee if you mention the 'v' word. Then you are a wappie and anti-vaxxer.
I am moving more and more towards complete distrust of all vaccines. It is also not unrelated to the 2021 craze around the Covid jabs. Everyone 'knows' that vaccines have made dangerous diseases disappear, right? And that they are safe? But what is that 'knowing' based on? Really, I can recommend everyone here to read 'dissolving illusions' (Suzanne Humphries and Roman Bistrianyk). Or Vaccine free of By Frankema. It is an eye opener, and also partly explains why 'we' have such blind faith in all kinds of vaccines. Not because of proven effectiveness but because of manipulation and propaganda. With so much confidence in vaccines, an mRNA shot is only a small step further. The broad confidence in traditional vaccines has been used to push through the -contaminated- mRNAs. With all the misery that entails.
I would like to hear the opinion of others about 'dissolving illusions'. Maybe I'm overlooking things.
This is a tribute to all the deceased and especially to the unexplained without acknowledging what happened to them! 🙏
It is all even worse because the figures are already debatable from 2020 onwards. The excess mortality in 2020 was mainly caused by the absence of flu at the end of 2019. As a result, relatively more older weaker people died from March 2020 onwards. The corona measures also caused additional deaths in 2020 because many sick people were not treated or were treated too late. People also appeared to have had a lot of stress, especially in the first corona year, and had gained many kilos on average. This is at the expense of the immune system.
Many people who (wrongly) tested positive were automatically noted as 'deceased due to corona'. See CBS figures. Because in 2020, it turned out that far fewer people had died from dementia and, for example, lung diseases. Of course, there was already an increase in general mortality in 2020 because there were also more and more elderly people. If you take all that into account in 2020, it turns out that corona in itself caused much less mortality than was suggested. That corona mortality fell further in 2021 because most had already been infected at least once or twice. But by testing more for corona in healthcare and hospitals, a much more sensitive corona test and noting it with and by corona as due to corona, many people still died 'from' covid on paper. But in reality, that extra mortality in 2021 was probably caused by the injections and (a diminishing effect) mortality due to late intervention or late recognition of a disease due to, for example, the lockdown measures. From spring 2022, you can link almost all excess mortality to the shots.
And so it is! A distant friend who we met in person again suddenly talked about the shots. He works for a pharma giant abroad so it was never a topic of conversation, apparently we didn't dare to do that from both sides. As it turns out, he almost lost his partner and child due to the first pfizer shot. As a child, they received a (live) BCG vaccination against tuberculosis in their country of origin. As it turns out, Pfizer's BCG and C-jab do not go together. And it doesn't matter how long it has been since the BCG was received. The distant friend thought it was his duty to warn us... A bit late because there was a lot of puncture damage during the party with old acquaintances. After I was also told that my former best friend has also died of turbo cancer, I turned the conversation to cheerfulness with old memories. Through trial and error, several people have woken up wide. All my phone conversations with authorities about side effects, contraindications, etc. etc. but no one could tell you anything about it during the c-jab campaigns. A former colleague who had a terrible allergic reaction after the first Pfizer had himself administered the second one under an extremely high dose of medication and just survived. That's how crazy people have been and still are. The hard numbers here are really going to open eyes, but it takes so long.
For your information:
On BCG and risk of clinical outcomes, see this placebo controlled trial.
Not sure if there is also information about the combination of Pfizer and BCG, but it may still be interesting for someone who has experienced problems with that vaccine up close
See: https://pubmed.ncbi.nlm.nih.gov/39515666/
Nice article and of course completely true and exactly fitting the analogy that if everyone gets fat, being fat is not considered the norm either (compared to normal weight/BMI)
I saw a small mistake (sorry for the moaning but I can't resist)
Where it says: 'Since 2021, there has been a continuous increase in mortality rates in the Netherlands that deviate from the long-term trend before 2020.'
It should read here (otherwise also look at the mortality graph from CBS): 'Since 2020, there has been a continuous increase in mortality rates in the Netherlands that deviate from the long-term trend up to 2019.'
Talking to the conclusion can happen to all of us. In other words: the excess mortality is not only due to 'vaccine', given that 2020 also shows excess mortality.
By the way, I am not without that sin myself (from talking to the conclusion). In an article from a few days ago I talked about a problem I had (thought..) I saw in other people's data. Partly on the basis of advice, I entered into the Socratic conversation.
-What turned out?
I was not Socrates.
I was wrong!
-Initially not a nice conclusion (for me, I am only human and initially petty in admitting mistakes...), but after I realized that it was petty not to want to admit mistakes, I frankly acknowledged my mistake to the authors. My mistake was in talking to a certain conclusion, which is that I thought that no additional pulmonary embolism had been detected in the Netherlands in 2020 (compared to previous years), because I could not see that in CBS data.
For those who want to check that: see https://www.cbs.nl/nl-nl/cijfers/detail/84069NED?dl=916AA and enter ICD 10 code I26 in the table (I26 is pulmonary embolism) and no spectacular things will happen in 2020.
What I concluded from this was that everyone who was diagnosed with covid in the hospital and then 'got' pulmonary embolism was eventually diagnosed as pulmonary embolism and thus ended up in CBS. So there was no EXTRA pulmonary embolism in 2020, it was all as usual, only pulmonary embolism in 2020 was called covid...
The article I was looking at (I could refer to it, but I think it's a bit silly to do that here... perhaps unfairly) found a 25% increase in pulmonary embolism in 2020 (compared to 2019=2500 pulmonary embolism more than 2019) and a 50% increase in 2021 (compared to 2019=5000 pulmonary embolism more than in 2019). I couldn't believe those numbers, but now I know that this was just me (I was talking to a conclusion...).
With the help of the authors, I found out that what they had published also concerns data that is NOT on the public site of CBS, these are the complications/other diagnoses that are counted after covid diagnosis in the hospital and that you can only find in the protected environment of CBS microdata.
In other words: what I could count in the public data from CBS are only the pulmonary embolisms that were counted in the hospital as the main diagnosis (pulmonary embolism without covid), while the authors were also able to count the complications (mostly after covid) in CBS microdata. I have no reason to believe that the authors have counted incorrectly and I have acknowledged that.
This may be an aside, but I have to say that I was very happy to acknowledge my mistake. Was no problem at all, authors didn't blame me and I had learned something! That's how it should be, of course.
What is interesting (I think) is that in 2020 (and 2021 too) there was more pulmonary embolism than normal. How could that be explained for 2020?
-Is covid the thrombogenic disease after all?
-or is the extra pulmonary embolism caused by all those extra actions in the hospital with covid by ventilation, remdesivir, etc.
It's a bit more complicated than this. But for a comment this seems enough to me. I can possibly explain my actual criticism (with numbers and publications), but that has to be done via email (because I have no idea how to get tables here under a comment).
But maybe the comment piece as I have given it now is also enough for the insight of eea.
If mortality had immediately returned to normal levels in 2021, 2020 would have been neatly in trend: a peak similar to the flu, but a bit more severe. And then also undermortality.
So in my opinion the report is correct: until 2020 (the Corona year) there was nothing wrong. From 2021 onwards, things went wrong. Undermortality should have continued and mortality should have returned to the old trend line. Not.
Of course, covid is also a thrombogenic disease.
Thrombophlebitus can be caused by trauma, a bacterial or viral infection.
A thrombus can then enter an artery and then cause a pulmonary embolism or damage the heart or brain.
A covid vaccination in itself can cause a bacterial infection. The question is to what extent the contents of the syringe activate, among other things, the clotting of blood, etc.
There is a Corona Schade foundation, there is a Bond tegen Overheidszaken, there is a Recht Oprecht foundation that is conducting a lawsuit against Rutte Hoekstra Kaag Hugo etc, but also against Pfizer Bourla and Bill Gates in the court of Leeuwarden, then there is the Doctors Collectief.NL being 2700 doctors and other medical scientists, they placed large anti-vaccination advertisements in the Telegraaf, on billboards along busy highways, but no one gets through to the news, the Telegraph answered a question from an English journalist, why is this not news to you, because these are rancorous wappies, they are not in the news, and apparently know nothing of the existence of the other, so that there is no cooperation unfortunately, after all, unity makes strength, thanks again for your important info !!
Hello both, I devoted 11 pages to this subject 3 years ago.
I approach the whole problem differently, and am curious what exactly you want to apply the standard to. I explain this in great detail and explain it with graphs
I was wondering if you could see my
"the misunderstanding between the CBS and the grim reaper"
Send me an app on 06 10827852 and (I'm in Greece now) I'll app the file back
Net https://www.medischcontact.nl/actueel/laatste-nieuws/artikel/oversterfte-met-of-door-covid-19 Reading, interesting, thanks!
Hello Michael,
I just read your piece on MC (thanks to LN) and the response from CBS, where they try to wriggle out of it again through a word game.
CBS says
"First of all, it is incorrect that CBS changed the coding rules ('rules of the game' in the article). CBS uses coding rules established by the WHO in international consultation (WHO, 2020)."
What they don't say is that WHO did change those rules then. On vzinfo.nl we read:
"For reasons of surveillance, the definition of death from COVID-19 differs slightly from the way in which a condition is considered an (underlying) cause of death by default. The instructions of the WHO are followed. Death from COVID-19 is defined as death from a condition related to COVID-19. This means that COVID-19 is considered the cause of death in all cases of natural death where COVID-19 is stated on the cause of death form in the causal chain. When COVID-19 and another condition are listed on the cause of death form as conditions that are part of the causal chain, COVID-19 is considered to be the cause of death."
So either they did NOT follow the WHO rules (and therefore sailed their own course) or they did follow WHO and recorded Covid-19 as the main cause of death whenever Covid-19 occurred somewhere in the causal chain.
It can't be both true.
They also invoke a distinction between Part 1 and Part 2. That Part 2 doesn't matter at all. On their own"Explanation of cause-of-death certificate" that whole distinction does not even occur.
I described this two years ago in this article.
I think I also read at the time that it was classified by software (with WHO software) but unfortunately I have no source for that. Thank you for your entry there!
Dear Michael,
I also read your article thoroughly at the time. However, that is about a fundamentally different subject.
You pointed out, quite rightly, that the mortality statistics were manipulated, so that "the normal last push" with Corona was no longer the last push. But the person in question "died of Corona". Consequence:
1. More reported mortality from Corona than was usual for "mortality from a virus".
2. Less mortality from underlying other causes. This effect in particular can be clearly seen in the graph.
Why this happened we will probably never know. But possibly/apparently there was an interest in being able to attribute as much mortality as possible to Corona.
On balance, however, this has no impact on total mortality, etc.
The new article is about the fact that after the excess mortality in 2020, there
a. no clear undermortality occurred after the Corona pandemic;
b. the excess mortality of 2020 continued in 2021, 2022, 2023 and 204, or even became slightly higher than in 2020.
And that is very serious, because there was no longer any Corona that could explain this persistent excess mortality. So to this day we are left with an unsolved riddle.
Unfortunately, the detailed data to be able to do really good research into the causes is lacking. Those causes are possible: long Covid, delayed care, vaccination side effects, (psychological) problems due to the lock-downs and possibly other causes.
De impact hiervan is echt ernstig, omdat er “gewoon” te veel mensen te vroegtijdig doodgaan. En niet een paar, maar enkel honderden per week.