
On April 1, 2025, the House of Representatives took a motion from Ria de Korte (NSC)1From Ria de Korte motion In which two questions were asked to the RIVM. Firstly, it was asked to reflect on their calculation model for excess mortality and second to explain how excess mortality could remain visible in a possible other calculation model, even if there is overdiction in previous years. Because the RIVM takes the raised mortality of the previous 5 years as a benchmark, that raised death is no longer visible as such.
Now for that reason we have been working with a model that does exactly this for some time2ResearchGate, Evolution of the baseline, See also sterftemonitor.nl. We therefore submitted a proposal to our standard mortality method that same month3PDF NORMBERFE to consider.
RIVM: We do not measure a long -term multi -mortality
The RIVM gave its response on July 114Link Respect RIVM. They explicitly state that the RIVM death monitor must be seen as a “signaling and analysis tool of acute elevation". That actually said enough, but they still underlined that the RIVM model was never even designed to identify structural changes in death; the method"does not have the goal prolonged to monitor trendsSaid the RIVM.
In simple language: the RIVM explains that they only want to see short -term peaks such as flu waves and heat waves as over mortality. To make it visible, the RIVM takes the current (raised) death pattern as a reference point. Only deviations from this are considered real "excess mortality".
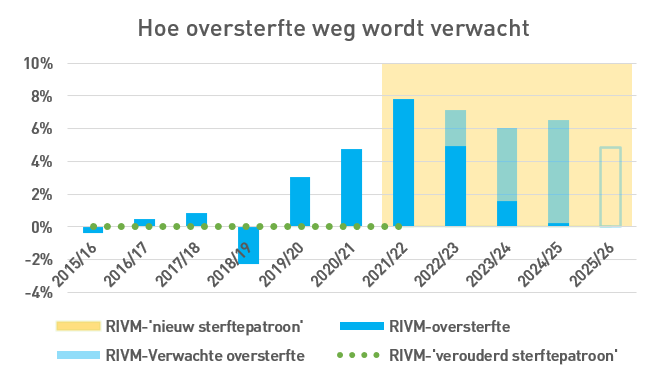
In the meantime, the RIVM does see the raised mortality since 2020. It labels this overdolution as “A new death pattern”. In the eyes of the RIVM, over mortality consists of temporary peaks on top of that level. RIVM also confirms that the death pattern was much lower up to and including 2019, by speaking of one “Outdated Pattern Pattern” When it comes to the level before the trend break.
All this implies that for that goal, as requested in the motion: keeping the overdiction visible, another model must be sought, such as the standard mortality model that we have inserted. However, our model is not taken seriously by RIVM. On the contrary, they do not pay any attention to it. Also not to concrete alternatives that could perhaps serve that goal. However, the RIVM knows about it, given their comment that there "Multiple approaches have been developed to estimate expected death." They mention two examples: Euromomo and Eurostat, both of which base themselves on a period of 5 previous years, just like RIVM.5Further consideration of the Eurostat Data apparently does not raise any questions. Here the graphs of Eurostat itself. For two years, NL has had twice as high overdolution as the EU average. Nobody scratches herself behind the ears.

And with a straight baseline (of the same data):

That the model mortality model is not reviewed is all the more remarkable because the RIVM explicitly indicates that such a desired model must be based on other indicators, including “Life expectancy and age -specific death opportunities”.
These are exactly the foundations under the standard mortality! The RIVM is served at their likes.
RIVM also calls "causes of death" as an important factor. In this era, this mainly means that the mortality opportunities in 2020-2021 for some age groups were influenced by the temporary COVID epidemic and that this would need correction. Because there are no reliable data available over this period (with/passed by Covid?), The standard mortality model is based on data up to and including 2019. In that sense, the model therefore takes into account death causes.
What does the minister say?
The minister regards the subject as dismissed. In his answer, however, he gives a completely wrong representation. He - or a civil servant who is at home in the complex over -mortality file - writes about the standard mortality, literally, that it is a model “in which the expected mortality is not assumed". With this motivation it is being served.
This is not only actually but also logically incorrect. Here is a method for calculating the expected mortality, accused of it "Don't start from the expected death"…!?
This is incompetent, illogical and circular. An argumentation theoretical explanation is superfluous to explain how impure this is. It is really very worrying.
This answer may have been slipped through something, but it is still difficult to accept that we have to do with this level of thinking where it is about our public health. In fact, it is unacceptable - but the only alternative option to understand is to assume that the truth is deliberately twisted in a way that we know as if gaslighting. That would go far.
The trend break is also unmistakable in the CBS figures. Statistics Netherlands attributes higher mortality to population growth and aging. However, that does not fit with the trend break 2021, which then would have to have taken place more gradually over several years.
The CBS statement of growing mortality (population growth and aging) raises the question of how the mortality may have been lower in 2023 than in 2022. Population shrinkage and rejuvenation perhaps?

Conclusion
The RIVM confirms that in 2021 they recognize the same trend break that you also see, looking at the above CBS graph: a suddenly raised increase in the basic mortality in 2020 (explained by COVID) that holds unexplained in the following years. For RIVM it is a new basic figure to compete for short -term peaks. For others (not least the relatives) it has been a very worrying and undesirable development, to say the least, which has never occurred this way at the macro level and has caused a lot of mourning and sorrow at the micro level.
The usefulness of monitoring excess mortality is that policy can be made on this. Monitoring public health is one of the most important tasks of the government. Ignoring unexplained excess mortality can be called negligent for institutions that have the task of monitoring public health. There is a term for this: official negligence. This sounds like an accusation, but it is intended as a neutral observation.
Neither on the part of the minister nor the RIVM, nor of the CBS, nowhere in the government, do we recognize interest in the cause of such a sudden massive multi -mortality under their own sponsors, the taxpayers, not even if parliamentary questions are asked or motions are submitted.
There is no longer any question of monitoring of public health.
AI over oversterfte monitoring
Grok: https://x.com/i/grok/share/qEGgW4wRoh25qQNkRQ64TlmaD
ChatGPT: https://chatgpt.com/c/68e2116b-0dfc-8328-b505-500b56da4f0a
There is already a follow-up to this article, based on responses from JVI and Jan van der Zanden. See the Next Post
References
- 1From Ria de Korte motion
- 2ResearchGate, Evolution of the baseline
- 3
- 4
- 5Further consideration of the Eurostat Data apparently does not raise any questions. Here the graphs of Eurostat itself. For two years, NL has had twice as high overdolution as the EU average. Nobody scratches herself behind the ears.


And with a straight baseline (of the same data):
Probably the excess mortality is highest in the Netherlands. An additional indication is that of all EU countries only in the Netherlands life expectancy has fallen between 2019-2024. A number of Eastern European countries, the inhabitants of which have been less vaccinated, plus the country of Sweden that had fewer lockdown measures and relatively many people were infected in the first year, have the highest rise in life. The countries with an above -average high vaccination rate, etc. have the least, very minimal increase in life. See article Joop.nl 15 September.
“Malta, Spain and Austria Recorded the Highest Excess Mortality Rates in June 2025 (29.9%, 10.6%and 10.5%Respectively), While Bulgaria (reprenate (reprenate), Lithuania (−8.6%), and Lowest.” Thus the EU, although that is only a Snapshot of 1 summer month.
The excess in NL has been more than double the EU average (incl. NL) for about 2.5 years. You can see that in Statesman. Just tick the Netherlands in the first graph (EU is already checked).
It is not understandable that it is not being acted on? Also not through room, doctors, health insurers, etc.?
This therefore corresponds almost seamlessly with life expectancy trends.
Certainly, life expectancy is derived from mortality rates.
I understand. See my response life expectancy 2019-2024.
Addition: From February 2019, you can now register a stillborn child in the Netherlands and also children who die within 24 hours of birth. This last group was also not (previously) registered/registered. If they are now included/counted in the statistics, this explains, among other things, their lowest position in the EU life expectancy statistics.
The number of stillbirths had fallen considerably to approximately 400 until 2019, but then increased to 461 in five years. The number of live births that die within 24 hours will therefore probably also have increased slightly.
Good point. That is partly why it is so crucial to map mortality per age category; that filters out this change. Unfortunately, life expectancy is also a model and is therefore sensitive to all kinds of noise.
Any more objections to this simple KPI? I still don't understand why I didn't think of that sooner.
One learns by doing/thinking.
This group is now being halved in the 'norm mortality'.🙃
That is why you should not calculate on the basis of an arbitrary life expectancy, but on the basis of mortality risk per age. And don't merge cohorts, because then you get strange forecasts. Especially at the age associated with the baby boom. When an age moves through the baby boom line, you get a strange jump. And even then…. The baby boomers are not evenly distributed over the year: the top is 9 months after May 5!
You can calculate life expectancy for someone who has lived to be at least 1 year old. Then early death won't bother you
Hey, is that so? Because in Sweden they also made a lot of money. And if there is no excess mortality there, it would be due to something other than the lampreys. Postponement of care? Mental stuff? Still Long Covid? Etc.
Indeed, all questions that will be investigated as soon as the data is released, deo volente.
Sweden: Natural protection that preceded the injection also had a protective effect against the injection? Or has Sweden been lucky with the batches (see also comparison with their neighbors) and has the Netherlands had enormous bad luck?
Postponement of care: Temporary postponement of care may have contributed somewhat. It doesn't have the substance to cause a drama like this. And if Sweden is a counterexample: there are also people against deferred care all kinds of counterarguments.
Mental issues: will certainly have played with this and that. I have not been able to find any previous cases where this resulted in tens of thousands of deaths. Pay attention to the fear narrative.
Long Covid: PAIS has always been there. About 93% of the Long Covid patients (at least those who reported to the Long Covid Center) had been vaccinated. Complaints are almost identical to the vaccination side effects, etc. Anyway, examined extensively.
Etc. etc. etc. indeed... Let's speculate, hoping to get some momentum going!
Beats. Life expectancy has increased relatively much/excess mortality is relatively low in Sweden. One of the suspected reasons: Thanks to few lockdown measures, many more people became infected with Covid in Sweden, especially in the first year.
Naturally built immunity works much better and much longer than 'immunity' obtained through an injection. I suspect that this natural immunity also (partly) works against the disadvantages of the covid shots. I also understand that a large number of doses have been rejected in Sweden. Perhaps in other countries it has slipped through.
Excess mortality there too, but slightly less. Aspiration?
Good question! How is it possible that 2023 has lower mortality than 2022?
May I ask a counter question? Why is it that 2019 has less mortality than 2018?
Was 2018 excess mortality, or 2019 undermortality? Was this possibly excessive? And what does this do to the standard mortality rate?
Indeed. Actually more of an extra counter question, the same but in different years. You will have to apply corrections and that is where the party begins. With the flu, that answer is quickly found, but yes, if there is no explanation...
You can also take it as a standard that there is a mortality wave almost every year. Sometimes a longer 'increase', sometimes short and intense. And once every 6 years there is hardly any increased mortality
Modeling means making choices. The question is whether those choices are justified or not.
And with your 'standard mortality', years with mortality waves are directly compared with years without a mortality wave. In fact, the year without a mortality wave was the last year of the data series, which naturally gives a lower expectation for the following years.
These kinds of problems are inherent to models and their choices.
Therefore my proposal: stop that and properly report the mortality figures /100,000/category. If, with their wobbles throughout the year and sometimes over years, they are structurally 10 to 15% higher after 2021 than before 2020, then structural excess mortality from 2021 in that age category has been irrefutably proven.
And then you can add up all those age categories if you want….
Prove me wrong!
Once again: then we do not have a conclusive explanation as to why. From when. If you also divide the years into quarters. But I don't know whether that data (mortality + population size/age) is available.
Serious…? You think this not clear enough?
You mean that you plan a flu wave in advance for every year? One year nothing, the next year 8000?
And in addition, we always have to deal with shifted mortality. That is why there will be less mortality in 2019 as a follow-up to the severe flu of 2018. So 2018 will increase the forecast and 2019 will decrease it proportionately.
No, don't schedule.
My proposal is: simply present the mortality per age category per 100,000. Then you will automatically see that during a flu year it will be higher. AND a little lower the following year. But over several years you will see an unmistakable trend (reduction) and suddenly an increase from 2021. And then you will no longer have any discussion about models and corrections, etc. etc.
That's obvious, isn't it?
And your report therefore shows no total excess mortality. But excess mortality per age category. Much more transparent. And irrefutable.
Or am I overlooking something really stupid here?
Beats. And the excess mortality also became relatively high in 2020 because there was no flu wave in the autumn of 2019.
The lockdown measures and the relatively large number of weak people have therefore increased excess mortality even further from March 2020. In 2021, the lockdown measures, postponed care and delayed diagnosis of fatal diseases, enormously increasing obesity, plus the 'vaccines' were responsible for (extra) excess mortality. After that, the risk of death from corona fell considerably, but the share of 'vaccines' in excess mortality increased enormously. The fact that (quite a few) corona deaths are still being registered is because 'died with corona' has also been counted since November 2021. (After this it is mandatory worldwide by the WHO)
And the banned primary care and the banned medication and the experimental lethal treatments in hospitals and the fatal protocols in nursing homes. Have I forgotten something terribly?
Certainly. The (possible) danger of Covid19 was inflated to such high proportions that millions of people became more stressed and were more likely to have a heart attack. In addition, stress affects the immune system.
There was a big flu wave in 2018, that's why.
Beats. Plus there was no flu around at the end of 2019. It was only at the end of January and beginning of February 2020 that the flu started to emerge, which was taken over by Covid19 in early March. Because the flu increase in February was mainly based on reports in hospitals and GP practices, these reports may also (largely) be Covid infections. After all, there was hardly any testing for corona at that time.
Let me put it this way: There was a 'major' flu wave every year. Except 2019.
The question then is. Are we going to correct all these years by correcting for excess mortality due to the flu wave? Or should we say better. Every year there is a mortality wave, let's correct/increase that in 2019, so as to be more in line?!
It is better to correct 2020. More people died there from corona, because there was no flu in 2019. It's all mortality shifting. The moment of death is 90% determined by your own health. The exact moment due to a “last push of illness” such as flu or corona.
I'm not so convinced about excess mortality following undermortality. This is usually short-term (number of weeks) and not a one-year shift.
Usually, during a major flu wave, you see a steep decline with under-mortality.
You do not see that effect with under-mortality. At most, slightly higher mortality in the summer, or an excess mortality peak during a heat wave.
But not quantities that will make up for the under-mortality in the following winter.
There have been periods of under and excess mortality before in the past. But I see no law in that we 'always' see excess mortality after undermortality.
I also do not think that the first three corona waves are comparable to flu, in a largely naive population.
There must be some who would have been pardoned for a year. But this will be a very small part.
After each year with exactly expected mortality, you can expect significant excess mortality. You don't even need under-mortality for that. Saving a reservoir is very possible without significant under-mortality, neatly within the bandwidth and even close to the baseline. This can be seen at annual level.
You can see it best in the seasonal graph. 2017 and 2018 both saw some excess mortality (flu), which was compensated in the course of 2019. We were back to zero. You also see the line going down again after each flu wave (decreased mortality), not for a month or so, but usually until the next wave. Undermortality is the response to excess mortality.
Excess mortality at weekly level shows the normal seasonal fluctuation when you compare with the same weeks in previous years from which you caught the flu. That is what RIVM does.
The RIVM weekly report only says something about that week. However, it is impossible to predict exactly when the normal seasonal peak will occur.
The seasonal graph (based on the Standard Mortality) provides a different insight. In addition to the RIVM method. Actually it is the other way around because all the information is also in the annual graph: a steep slope means a week with weekly excess mortality.
We are talking about UNDERmortality after OVERmortality. That takes about a year. See this article we wrote about it.
https://steig.nl/2025/09/veiligheid-en-effectiviteit-van-de-covid-19-vaccins-in-nederland/
A new death pattern says RIVM (in periods with few infectious diseases).
Could, but then I want to see causes.
Covid is of course obvious, but why only from autumn ’21?
That pattern should already be visible during/after the first wave of spring '20?
The “unexplained” aspect is the biggest problem. More difficult to accept than mortality itself, no matter how bad. Or maybe that is precisely why, precisely because the mortality is so bad, the nonchalance with which it is dealt with is exasperating. The deaths cannot be reversed, but the nonchalance can.
All those models is of course nothing. Certainly not if it is not necessarily necessary.
On closer inspection, it is much better to have a kind of "absolute relative norm". And that standard already exists:
Determine the mortality per 10 (or if necessary 5) year category and report it per quarter (or if necessary per month). It is aging and greening proof. Then you quickly see how many people per year die of each age category per year. There is no mess with that. For example, if, for example, many more people die in the 40 - 50 years or in 80 - 90 years, then you know something is going on.
This is:
1. ✅ Available immediately
2. ✅ Real-time reportable
3. ✅ Model independent
4. ✅ Transparent and understandable
5. ✅ Immune for "new normal" tricks
The fact that this data is not central to the over -damping debate is significant….
Statistics Netherlands is already publishing these figures, as far as I know. These figures are tough indicators of declining or normal death or over mortality.
I think we can make all kinds of complicated models go better. They always have their limitations and in the end you will end up with the above more valuable indicator.
So let's present the mortality per age category crystal clear again in the years from, for example, 2015 - 2025. Then over mortality in, for example, the lower ages, where there was hardly any corona mortality, is immediately up. And that is irrefutable.
The average life expectancy (now around 85 years) can then be used as a outcome measure. It is also difficult to mess around with that, although there is already a formula and therefore a model. It is a number that can also conceal underlying data as a result of aging or greening. Nevertheless. If there is excess mortality, you will see that indicator fall fairly quickly. And that also happened in 2021, 2022 and 2023. The life expectancy is now again at the old level, so the overdolution should be practically gone.
All life insurers make use of this objective data in their actuarial tables. And the increase in the state pension age is also based on these indicators.
I don't understand that I have not brought this forward before. Or do I miss something?
Then of course the question remains: where does this excess come from? That will be difficult because of the HVE. But a shift in the causes of death in that overdiction can probably already give an indication.
Life expectancy for both sexes in 2020 and 2021 fell sharply. In 2020 it was back at the 2015 level. (CBS)
After that, it remained the same in women until 2025, but rose some of the men every year. The women have been vaccinated more often and have reported almost twice as many complaints to the Lareb than the men. But women also got sick (seriously) after a coronabes infection. See also my response above.
Maybe you overlook that you always need an expectation to test. Even if you do it per year of birth, like us. That is therefore by definition modeled.
It sounds very easy: "You see that soon enough". Unfortunately, that is not the case because something always fluctuates. If you want to do it convincingly, it really becomes a bit more complicated.
As for your reference to actuaries: they have made very strange jumps in recent years with their prognoses. Watched nowhere. Whitewash The difference in the prognosis for 2024, made in Q2 and the prognosis in Q3. There is three months in between. Advancing insight? But they were hard indisputable figures, right?
Life expectancy is now at the level of 2019. If you extend the rising line of the decades before, the life expectancy should now be about half a year higher than it is today. If so, we would be on the normal line again. What could be the reason that this correction did not take place and we were still set in time 6 years ago?
Thanks again for the useful calculations because it remains desperately needed. In the meantime, the relatives remain quiet, very quiet. Colleagues of the man who lost his wife and son (proven) to the puncture are even quieter. Where we used to play with mourning tires at our association and talked about people for a long time, they are now being silenced. Also, the seriously ill is no longer mentioned. "Does anyone know how it is .... is?" I asked on a full terrace of the association last week. It became silent and so I asked again. Some sputtering came, nobody knew them. The person was the face of this hospitality industry for years and years and some small calls had been made about sending well cards to the hospital but then it became quiet. People don't deserve that either. A colleague assumed that we have it easy for us because he has a hard time with his doormat full of calls for punctures just before his 60th birthday because he does not know what to do ... So in the meantime in the meantime, he focuses on the anger with this man, but his anger again. In the meantime, the Lareb Update the serious side effects, which I think the deceased also fall under, whether it is the most natural thing in the world ... Oh, it is apparently it too. We're going to see it!
Yes, poignant. I remember from one of the speakers at a funeral that the deceased had had a nice dinner with him on Wednesday and was found dead at home on Friday, cardiac arrest. The cleric who led the service said: “Corona still got him.” There were some acquaintances of mine, they nodded seriously. It's really worth crying over.
That “expectation” is simply the objective number:
x deaths per 100,000 from 40-50 years and
y deaths per 100,000 from 80 – 90 years etc.
That is a hard, absolute (relative) number as a standard, which cannot be messed with. And the better the health and care, the lower those figures will be.
If you apply all kinds of models to construct an “expectation”, you make it opaque and vulnerable to criticism.
The mortality per age category is irrefutable. We have made things way too complicated for ourselves.
Prove me wrong!
Your proposal is a model that simply compares the absolute numbers with those of the previous year, if I understand correctly.
One year is generally seen as far too short a reference period. There are trends, there are flu peaks, there is an aging population, population growth... You don't take all of that into account because it becomes too complicated. Very pragmatic, of course. 🙂
Or you judge that afterwards, with the wet finger of an expert committee. It might make the assessment easier, but I have my doubts about whether it would also lead to reliable, correct and somewhat consistent policy.
No, it is a “relatively absolute” number: number of deaths per 100,000 per year per age category (5 or 10 years). If necessary every 2 years.
That is why it is an “absolute key figure per 100,000” that is not subject to all kinds of circumstances. Aging? No problem, a certain age category will simply increase, but mortality should remain the same. Unless people become (un)healthier or there is an external factor. So with flu/Corona/{and we think} vaccination that number will be higher. Because corrections have already been made for size and shifts of cohorts from one age category to another. That is by definition included in that KPI.
Of course it is true that if you suddenly “import” a large (un)healthy cohort, the mortality rate of that cohort will go up/down. But you can expect that Ukrainians and Asylum Seekers who receive our care will immediately copy our mortality level (approximately). And if the group becomes 30% larger, the mortality is of course 30% higher, but the mortality per 100,000 (if all goes well) remains the same.
So it cannot be tampered with. And excess mortality is immediately visible.
Again, I don't understand why we were so difficult with expectation models before. But sometimes it is difficult to see directly the path of greatest simplicity. But perhaps Herman still has an objection?
So it is super simple and corrects, as far as I can think of, everything that is relevant.
Again: prove me wrong.
You mean to say that the hard figures [normal + mortality due to vaccination] are hard enough to serve as a reference?
And the fact that life expectancy is now at pre-corona levels says nothing about excess mortality. Suppose we bomb a village of 10,000 inhabitants every year, leaving no one alive. Then there is an excess mortality of 10,000. But it does not affect the life expectancy of the survivors. Unless they think: tomorrow it could be our village's turn.
There are various views of “life expectancy”. Before you start a discussion about it, you must first determine whether you are talking about the same thing. “Life expectancy” has fallen significantly during the corona years. Of course, that has nothing to do with the expectation of how old the survivors will live - what you would expect from such a word. It is a sloppily hijacked jargon concept. It's more like “average age of death”. I don't see the whole "expectation" aspect in it.
@Anton: Completely agree: life expectancy is too complex/vague a concept that is heavily modeled. And therefore it can have different outcomes depending on what you include. This is not possible with mortality / 100,000 / category.
That is why we do NOT work with life expectancy at all, which is a derived parameter. We only consider the mortality risk, a trend over the 10 years prior to corona. You multiply that by the population size for each age. Simple model
Mi. is that too complicated, because you publish a total mortality figure, which is subject to discussion (with corrections for handling), and that is also available immediately. Even though it basically comes down to the same thing.
If you do not totalize, but simply leave the (excess) mortality per age category unchanged (and if necessary total that mortality afterwards), then it is irrefutable. No model. Just plain numbers that you then add up. Instead of first a model that already contains totals.
In short: it makes your model unnecessarily non-transparent.
That's how we do it too. Everything by age in 1-year cohorts. You can then add whatever you want. So no model.
OK, then I missed that.
If that speaks volumes in terms of excess mortality per 1-year category, surely there can be no more discussion about it?
Well, you keep us on our toes, but there is no discussion from the state's point of view. The minister does not want to pay attention to this, arguing that this model to determine expected mortality is not based on expected mortality.🤪
I certainly mean that. And I had also already noted that the “life expectancy” indicator is again a fairly complex model, and is therefore susceptible to concealment/masking, as you yourself illustrate. So that number is not very useful for studying excess mortality, although there is certainly a relationship; but that relationship is far too indirect.
But not the mortality per 100,000 per age category (as far as I can think...). This is hard and should be constant or should decrease slowly through improvements in prosperity/well-being/care. So structural excess mortality in this directly translates to a higher number per 100,000. Without model or other fuss.
I feel a bit like Galileo: and yet the earth revolves around the sun... How can you not see that?
I'm too lazy to do it accurately myself. But I did it quick and dirty in CBS data/statline (so as you, Jan, suggest). There the given age categories are 0-65, 65-80 and 80+. The excess mortality in the years 20-23 was (if I remember correctly) within all three age categories and was 10-15%
(Method: deaths per 100,000 parts over the calendar years with 2019 as reference year). In 2024 you will no longer see excess mortality for people aged 0-65 and above 65 only a little (up to 3%).
CAVE: I'm doing this by heart and memory can be deceiving. But I invite everyone to look at statline themselves and redo the calculation.
Yes, that's how I did the math in the beginning (also with ASMR correction, by the way). Herman showed me how to do it more accurately.
But you no longer see excess mortality in 2024: compared to which reference? compared to the year before? And do you perhaps have an idea why it drops from >10% to virtually 0% from one year to the next? That's special, without a significant flu peak or anything like that.
Quick and dirty, that is: I looked at statline and wrote something on a piece of paper and then threw it away.
But what I remember is that I took 2019 as a reference year, split it up for 0-65, 65 and 80 plus, determined deaths per group per 100,000, and then calculated per year per group. I have interpreted the decrease (to 0): if there are no more measures (such as deferred care/changed care) and there is no longer (active) vaccination, the excess mortality will return to 0.
By deduction I conclude that the excess mortality is/was therefore a result of measures and vaccination.
Not a perfect rationale (Popper says…), but what's good enough for Sherlock Holmes is good enough (for the moment) for me.
"There is no longer any question of monitoring of public health."
This has been known since March 2020 and for the rest it is of no importance what all those wrong authorities do with bad people.
The excess mortality is visible every year as long as there is no underpastic.
Moving a baseline does not change the perception, only for those who don't understand.
But they will never understand, that too has become clear from March 2020.
The problem is: what is that baseline? Difficult complicated models. So subject to debate.
See my response above.
Just take the mortality per 10 or 5 year age category.
Objective, irrefutable, crystal clear, it is already being reported.
And then you immediately see how much excess mortality there is per age category.
Our model is very simple. The simplest model is that you assume that life expectancy will not change. The composition of the population does, because we get a year older every year and people also die. That is a simple calculation, nothing complicated. CBS knows how many inhabitants we have per age halfway through the year.
It is a bit more complicated if you take the long-term development of the mortality risk into account. We know this from, for example, 2010-2019. Subsequent years are no longer allowed to participate.
Even a simple model suffers from assumptions and is therefore by definition subject to discussion.
Therefore: mortality/100,000/category. No model. Cold numbers. No choices. And the numbers speak for themselves.
Or not? Where am I overlooking something? Because it's so crazy that we didn't see this before...
CBS also adjusted expectations, see this graph by Herman Steigstra
https://steig.nl/wp-content/uploads/2024/11/Prognose-CBS-vs-sterfte-768×501.png
from his article https://steig.nl/2024/11/cbs-is-de-weg-kwijt/ (nov. 2024).
By the way, perhaps we are never doing well enough for the authorities that do not (do not want to) see the persistence of excess mortality anyway: they miss a simple calculation because it is too simple (accustomed to complicated models themselves), a precise, detailed calculation will not meet their own precision/assumptions, etc.
Another one like that from February 2024 here (with Hans Verwaart)and from December 2024 here (with Herman).
A compelling argument is also “international consultation” and of course “accredited institutes”.
Not a word about the output.
Clear and good discussions. What is frustrating is that it doesn't seem to be making any progress, and that 'we' continue to be surprised why the facts are not taken seriously. This does not only apply to the Covid / vaccination file, of course.
Recently I started thinking about 'collectivism' after reading 'the road to serfdom' by Friedrich Hayek.
Wrote something about it on substack. Perhaps it will also help others to better understand why so many people are unwilling or unable to recognize how they are being manipulated (I think). If anyone is interested, the link is below. Anton, if you don't like this, feel free to delete it.
https://ceesmul.substack.com/p/the-road-to-serfdom-in-de-21ste-eeuw
I see it as a discussion piece. Certainly not a final conclusion.
I approve Cees, for this time 🙂 What you call collectivism fits well with the globalists. I think those are the current opposites (in extremo): globalists vs sovereigns.
Thank you, Anton:-)
I think it's more nuanced. I see collectivism as a container concept that can include all those other 'isms'. In my piece I quote Friedrich Hayek because he warns that collectivism can progress to totalitarianism. I'm trying to better understand why we see things so differently (thanks to c for the suggestion, but we're crossing Europe and I'm trying to limit my activities a bit). Collectivism fits in seamlessly with this. Collectivists are contrasted with individualists, or sovereigns, and there are also gradations. Or the classical liberals. 'Liberal' in America, but also in the Netherlands, now means something completely different from what was understood by liberal in the 19th century. That doesn't make it any easier. Liberal in America is now associated with the Democratic party.
The collectivist thinks it's fine that the government sets the rules. Because the collective knows what is good for the mob. The collective also has blind faith in the feasibility of societies. The other side believes that the government exists to serve the citizen, and that there should never be any coercion by the government.
The collectivists consider themselves to be fighting for the right cause. No one ever sees themselves as a bad guy. Everyone wants the Earth to be saved from destruction, right? And everyone has the right to good health, right? The collectivists fight hard to combat all these - often alleged - dangers. People who go against that or dare to have a different opinion must be bad, because the collective is good. I'm afraid it's not much more complicated than that.
The collectivists themselves do not know that they are part of a collective, they assume that they make their own choices based on independent information. What does not fit into this is by definition disinformation, even if it comes from once highly regarded scientists such as Ronald Meester, Peter McCullough and so on.
A collectivist society does not just arise, in our case it has taken decades. This also includes Ewald Engelen's 'university car wash'. Ultimately, a 'highly educated' elite is created that actually agrees on everything.
Globalism is something else I think. The model of a large free market where large companies move their interests around the world stage like chess pieces has gone too far, that's for sure. They get their cheap staff where it suits them, they pay taxes where they are the lowest. The globalists probably also form a collective, but I see particular danger in the collectivism of institutions and government agencies.
Actually, it's far too long a story, and I'm afraid I can and want to make it much longer. But I'll stop for a moment.
Recommended: Kees van der Pijl at soul session blckbx. So let's put it briefly in my own words. 80% followers including creeps and 20% self-thinkers, the latter can reach 25%. I hope for a complete overturn and then the majority of that 80% will have been in “the resistance”. we will have to increase that. Kees' father experienced it as a football fan on Sundays while the entire village went to church, something like that is not appreciated, to say the least. And some other stories that are very recognizable. With hard evidence (presented under virusvaria) and when people are no longer allowed to go on a flying holiday (or cannot because they are ill or dead), things will certainly move. In the meantime, I promise to do my utmost to prevent any more misery!
To understand the government's lukewarm, negative response to 'norm mortality', and to interpret CBS's complete silence, you may need to look at another, politically sensitive, policy area where a kind of 'norm mortality' already plays a major role. This also opens up a new perspective on the socio-economic consequences of the COVID-19 crisis. Additional material for cost-benefit analyses?
I summarize in 8 points:
1. There has been an implicit 'standard mortality' for some time, namely in the context of the policy of systematically increasing the state pension age. This policy started in 2013 and in 11 years the state pension age has been raised from 65 to 67 (effective from 2024). Further increases (up to age 72) are planned in the coming years;
2. The justification for the policy was the trend increase in the remaining lifespan of 65-year-olds predicted by Statistics Netherlands, i.e. the DECREASE in mortality rates for people over 65. Increasing the state pension age by 2 years should therefore correspond to an approximately 2-year higher remaining life expectancy of 65-year-olds in 2024 compared to 2013. These 2 years are approximately 10% of the total remaining life expectancy of 65-year-olds in 2013 (roughly 20 years). On average over an 11-year period, the decline per year should amount to approximately 0.9%. You should also compare this factor per year with 'volume effects' such as aging to determine how the total mortality of people over 65 has developed;
3. Unfortunately, a 10% increase in expected remaining life did not occur in 2013-2024. CBS's predictions turned out to be too high. The remaining lifespan of 65-year-olds in 2024 is barely higher than in 2013. For time series, see:
https://www.cbs.nl/nl-nl/nieuws/2024/45/prognose-levensverwachting-65-jarigen-20-96-jaar-in-2030
N.B. Open the first table of this document;
4. The too low expected lifespan was not only the result of the significant increase in mortality during the COVID-19 crisis, because even in the period 2013-2020 there was no observable increase in the remaining lifespan at 65 years (early 2013: 19.6 days, early 2020: 19.5 days). In other words according to the 'pension policy standard mortality', there was actually already 'excess mortality' shortly after the start of 2013. It is true that COVID-19 mortality is a major new problem, see point 7;
5. Nevertheless, the government (Rutte cabinets after Rutte-1, and the Schoof cabinet in 2024) continued to raise the state pension age in 2013-2024. CBS has also never raised the alarm about its own far too high predictions. The result was that after 2013, people gradually had to give up more and more of their pension (in terms of time and money), without getting anything back. At the beginning of the period this sacrifice was still limited, but now it can be said that a major social problem of unequal treatment of pensioners has arisen. Time for a parliamentary inquiry?
6. The CBS forecasts that were too high were one-sidedly based on developments in 2000-2010. However, that decade was certainly not representative. In 2000-2010 the expected remaining lifespan of 65 year olds indeed increased by 2 years, but in the fifty years before 2000 this increase was only 3 years! Given that history, it is astonishing to see how a statistical agency can make long-term forecasts, simply extending developments in a relatively short, exceptional period (decades) into the future! But yes, for Rutte-1, CBS's reputation was only in the field of 'descriptive statistics', they never did 'explanatory statistics' before;
7. But there's more. We are not only dealing with a failure to increase the remaining lifespan (at least 10% over 11 years) but also with an additional decrease of 10% in the expected lifespan due to much higher mortality in 2020-2024 during the COVID-19 crisis. This is a major problem for anyone who wants to convince the public that the state pension age can be increased further. This is now being advocated again, during election time, by the VVD.
The decrease in expected lifespan in 3020-2024 is not apparent from the CBS table in the November 2024 report, but is unmistakable, because according to the definition of 'statistical expectation', the expected remaining lifespan at 65 is no different than the weighted sum of the years and mortality probabilities for all ages over 65. If there is a 10% higher mortality across the board, this should sooner or later manifest itself. translate into a 10% decrease in the remaining life expectancy of 65 year olds. So instead of an addition of 2 years compared to 2013, life expectancy should actually be reduced by 2 years for people who are retiring now. The remaining age has now become 17.5 years again, just like in 2000, a decline of a quarter of a century!
8. CBS does not dare to show this in the table. To justify this, CBS referred in previous reports to the incidental nature of the increased COVID-19 mortality, including references to experiences with the Spanish flu after WW1. Now that higher mortality continues, this is no longer possible and CBS has chosen NOT to portray the consequences of the crisis in any other way. CBS writes in the November 2024 report that the prediction of the life expectancy of the Dutch population will from now on no longer be based on trends in the Netherlands, but on trends estimated by an 'international model'! CBS will not make any further statements about this model. So from 2020 (beginning of the COVID-19 crisis), expectations of the remaining lifespan for the Netherlands are given based on the international model (NATO?)…
JVI, great piece!
I don't think the article is very objective. But maybe I'm not reading properly or I don't know something...
CBS neatly reported on 11/8/2024 that life expectancy has decreased. https://www.cbs.nl/nl-nl/nieuws/2024/45/prognose-levensverwachting-65-jarigen-20-96-jaar-in-2030 And also that this is due to Corona (obviously not due to vaccinations, but they don't know that there and they don't talk about that; but we wappies know better...).
And shortly afterwards (11-11), the minister froze the state pension age for 2030 cfm on that basis. the law. https://www.awvn.nl/pensioenregeling/nieuws/aow-leeftijd-in-2030-67-jaar-en-drie-maanden/#:~:text=Net%20als%20in%202028%20en,geen%20sprake%2C%20meent%20de%20minister. He reported that the decrease was actually enough to lower the age, but that is not allowed by law. And he expects that the decline is not so structural that it is not necessary to adjust the law. The expectation is probably (but that is my speculation) that from 2031 or 2032 the state pension age will rise again because life expectancy has increased again.
And the VVD election manifesto simply states that the state pension age increases as life expectancy increases. I think that's been there for years. And also that the link between AOW (and WIA and WW) with minimum wage will not be abandoned; the link with Social Security and that type of minimum benefit. Mi. completely right.
I really don't understand the criticism in your article. C.q. I can find no facts to support the criticism.
What is really wrong with CBS is that they keep coming up with excuses (possibly on behalf of VWS, where the CBS director was here for the director!!!) to withhold detailed data about mortality and vaccination status. That is really very serious and bad.