
In our previous article, both published on this site and on maurice.nl, we indicated that in the recently concluded year 2024, there was approximately 30% excess mortality in the group of women between the ages of 40 and 50. This article was even covered in the excess mortality debate on 20 February. Mr. Thiadens on behalf of the PVV read out some passages from our article to demonstrate that excess mortality is still taking place in the Netherlands. In the article, we also emphasized that when using a different baseline, "the percentage excess mortality will not be 30% but 25 or even 20%".
We thought it would be good to take a closer look at this, also because there has been criticism from various sides of our article with these figures.
We have deliberately chosen to use a widely used linear regression model to determine the expected mortality, in which the period on which the regression is based has sufficient length. We have therefore chosen that this period has a length of 10 years. Because corona was an extreme event, which made its appearance in 2020, this means that the last year that could be included was 2019. Thus the first year will be 2010. We have made this analysis for each age group and for men and women separately.
In the follow-up study, we will compare our analysis with:
- The CBS forecasts from 2019 to 2024 (a total of six);
- Linear regression with a five-year period, 2015 – 2019;
- Exponential regression with a ten-year period, 2010 – 2019;
To start with perhaps the most important conclusion for many: that 30% excess mortality in 2024 is not reflected in the other methods or CBS forecasts described here. Was that outcome wrong? No, it was a first estimate, in which we already explicitly mentioned that other methods would lead to lower percentages of around 20%-25%.
However, the fact that those percentages may be less high does not mean that there is nothing wrong at all. On the contrary, we will see that seven of the nine different calculations show excess mortality for 2024 that is greater than 10% with a average (of those seven) of more than 22%.
In our article last week, we also reported that mortality in this group had also increased considerably in the other corona years. We will also pay attention to that in this article.
The CBS forecasts
Every year in the autumn, CBS makes a forecast of expected mortality in the next 40 years or so. This will start in the autumn of the first year, publication will follow in mid-December. The first forecast we pay attention to dates from December 2019 and focuses on the period 2019 – 2060. This is the last period prior to the corona years, which means that the results should provide the most reliable baseline. The numbers are not disturbed by noise.
We look again at the mortality per 100,000. The forecast for 2019 comes to a clear conclusion in 2020 and 2021 Lower than the 10-year linear trend line (see also the next figure, the yellow line). In 2022 it will be just below it and in 2023 and 2024 it will be clearly above. The angle of inclination of this forecast is clearly smaller than that of the linear trend line. We have difficulty understanding that the forecast in 2020 starts at such a low level.
The forecast for 2020 was published in December 2020 and is therefore influenced by corona mortality and uncertain expectations regarding vaccine effectiveness. This forecast (see the green line in the figure below) shows values for 2020 to 2024 that are clearly above the linear trend line. More mortality was expected that would also last for several years. The angle of inclination of this forecast is certainly at the beginning in line with the linear trend line (decreasing further in time) and is therefore clearly larger than that of the previous forecast.
The forecast for 2021 is different. Those who wanted to could get a vaccine, which made the world look brighter again when the prognosis was drawn up. That preparation will have happened just before the largest excess mortality wave in recent years in November 2021. The curve is completely above the linear trend line, but it will touch it in 2022 and is also completely below that of 2020. The year 2022 therefore has almost the same excess mortality both in that forecast and in the 10-year trend line.
The fact that the forecast for 2019 and 2021 will be almost the same from 2022 could mean that CBS sees this as the beginning of the normal trend. Normal then means a trend without serious disruption.
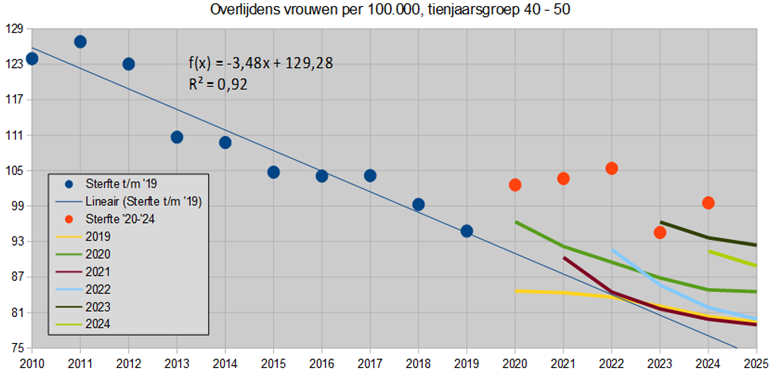
The curve of the 2022 forecast is also creeping towards that normal trend, but needs a little more time to do so. In essence, it is already recognised that excess mortality is expected in 2023 and 2024. This is even more true for the 2023 forecast, which comes out as the highest of all forecasts. This means little excess mortality if that curve had been used as a baseline. In fact, the line is so high that mortality in 2023 is lower than expected earlier that year. Actual mortality in 2023 is considerably lower than in 2022. Apparently, CBS had expected that the downward trend in these mortality rates would have continued and is constructing a curve for 2024 that would actually – if you were to extend it to the left – cut the red dot of 2023.
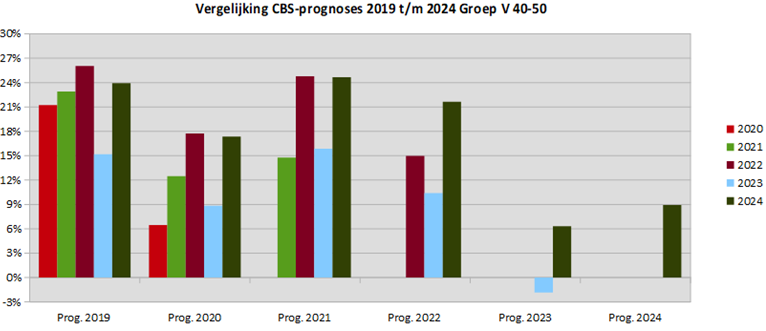
In summary, it can be seen that in the year 2022, an excess mortality of more than 21% occurs in two forecasts and in the year 2024, this is the case for three forecasts.
The conclusion of this chapter is that the forecasts for 2019 (pre-corona) and 2021 for the years 2023 and 2024 deviate slightly from the 10-year linear trend line, but not for 2022. We will see at the end of this article that the total excess mortality based on the forecast 2019 is almost the same as that based on the forecast 2019. the linear trend line.
Linear regression model, five-year period
Someone who has looked closely at the picture above, and specifically at the blue dots, will think that linear regression of the seven-year period 2013-2019 would provide a more reliable baseline. Now it is common with this kind of calculation to take periods of five, 10 or 15 years etc., so we will do that. We do the same only for the period 2015-2019.
The picture also shows the six forecasts of Statistics Netherlands:
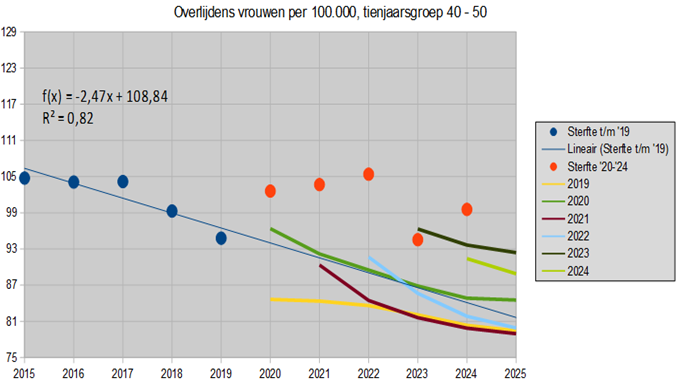
The scale of the X-axis has been adjusted to the fact that we are considering a five-year shorter period. In this way, it can already be seen with the eye that the angle of inclination of this trend line is smaller than in the first picture. The R² also appears to be equal to 0.82, which was 0.92 in the first picture. This can be a maximum of 1, then all points would be in a straight line. A lower R² therefore means a baseline, which would be a less good predictor of excess mortality. However, a higher baseline does mean lower excess mortality.
As for the CBS forecasts, three of them end below the linear trend line, including that of the pre-corona year 2020. The 2020 forecast for the years 2021 to 2024 is close to the trend line. Three forecasts are completely or almost entirely below the trend line. Perhaps CBS also made this calculation, but put it aside?
Exponential regression model, ten-year period
The fact that mortality in an age group can never become negative means that in the future a trend line will have to have a smaller angle of inclination. And eventually it will run almost horizontally just above 0. This is possible with an exponential regression model. The six forecasts of CBS are also indicated in this picture:
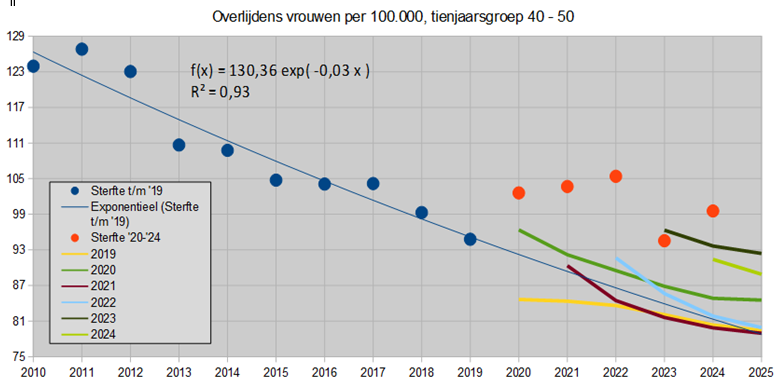
The R² of this model is the highest of the three. Applying this model could therefore well provide a reliable baseline. The CBS forecasts for 2019 and 2021 are entirely and almost entirely below the blue trend line, respectively. These will come together in the vicinity of 2025. If this trend line were to be used as a baseline, which would not be illogical in this age group, excess mortality in 2022 and in 2024 would be almost 20%.
Average mortality in the years 2020 to 2024
The years 2022 and 2024 show the highest actual mortality compared to the forecasts and the trend lines of the linear or exponential regression, respectively. But mortality has increased considerably in all years. For each of the nine models used to determine a baseline, we calculated average excess mortality for the years 2020 to 2024, where applicable. The latter means that, for example, the 2023 forecast only provides an expectation for 2023 and 2024 and not for previous years.
The average excess mortality is shown in the following table, which is sorted from maximum to minimum:
| Model | Percentage |
|---|---|
| Prediction 2019 | 21,85% |
| 10-year linear | 20,62% |
| Forecast 2021 | 20,01% |
| Forecast 2022 | 15,68% |
| 10-year exponential | 14,61% |
| 5-year linear | 13,63% |
| Forecast 2020 | 12,57% |
| Post-corona forecasts | |
| Forecast 2024 | 8,92% |
| Forecast 2023 | 2,23% |
What we see is that an average excess mortality greater than 20% is calculated three times. This includes two CBS forecasts and the 10-year linear regression. Four times a value between 12.6 and 15.7% comes out.
The fact that two CBS forecasts (including the one from 2019, from the pre-corona period that even shows the highest average) come close to the 10-year linear trend line indicates that the choice to work with it was correct. It should be noted, however, that for the linear trend line, approximately 30% excess mortality in 2024 is calculated. In the forecast 2019, the highest value is over 26% and this will take place in 2022. In the 2019 forecast, the highest values are almost 24% in 2022 and 2024.
Finally
It is quite possible that the application of a linear regression based on a period of five years or non-linear regression can actually lead to Higher excess mortality. An example of this is mortality from cardiovascular diseases. In this article shows that for both men and women, the expected mortality has started to decline faster and faster for some age groups towards 2019. The graphs look like this in age groups where this is the case:
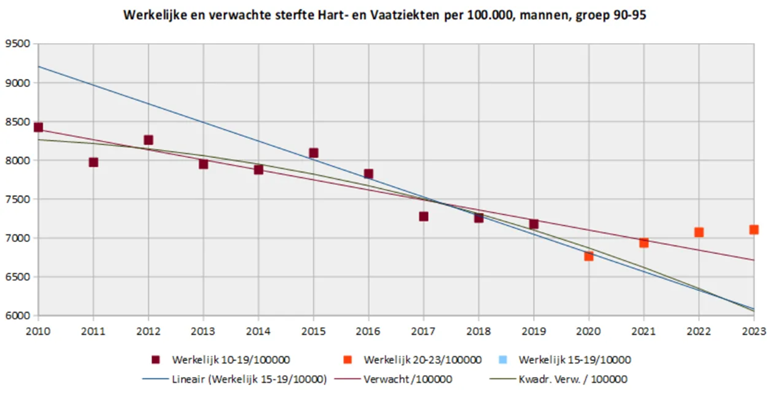
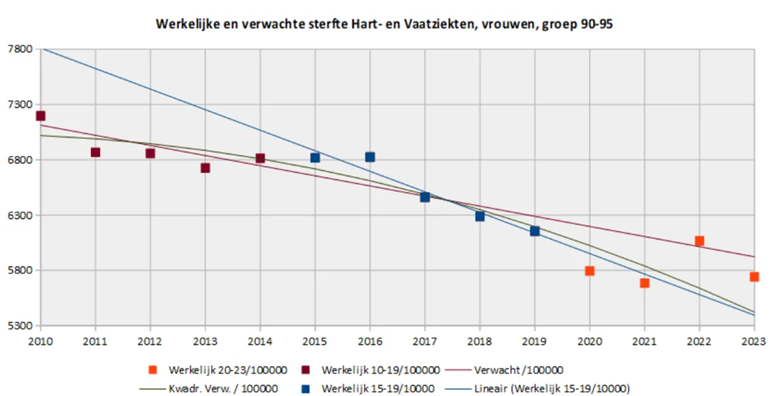
The pictures are reminiscent of train tracks crossing each other. The train comes from the left and changes tracks near "2017" and continues on the line that runs from the top left to the bottom right. Of course, this phase will have a limited duration, because eventually mortality will of course run almost horizontally.
This example illustrates that it can certainly happen that a linear regression with a 10-year period as a basis does not have to lead to the highest excess mortality.
Conclusions
- Application of models for regression other than the 10-year linear regression model leads to lower excess mortality in the total mortality situation in the group of women between 40 and 50 years of age. If you want to apply such a model, the exponential model based on a 10-year period is also preferred, because it has a higher R² (i.e. provides a more reliable baseline) and also fits better with various CBS forecasts than the linear regression model over a five-year period.
- The pre-corona CBS forecast of 2019 goes reasonably well with the 10-year linear trend line, although the slope of the curve is smaller. As a result, if this forecast had been used as a baseline, excess mortality would have increased in 2020 and 2021 and decreased in 2023 and 2024. Post-corona forecasts provide a different picture.
- If you look at the entire five-year period (2020 to 2024), the application of two CBS forecasts and the 10-year linear regression as a baseline shows that there is an average excess mortality of 20 to 22% in these five years. For five years and no prospect of improvement or going back to the normal situation before corona, that is a worrying observation.
Postscript [ed.]
The last two forecasts, CBS 2023 and CBS 2024, show that there is more going on than just following trends. People try to get desperately in the direction of reality with the predictions. In this way, we lose sight of the unhealthy excess mortality. We have argued for a standard mortality before. With climate we do not base ourselves on the temperatures of the last 10 years because then there was nothing wrong, after all, we neatly follow the expectation. The same goes for target weight. We don't increase that if everyone gets too fat, do we?
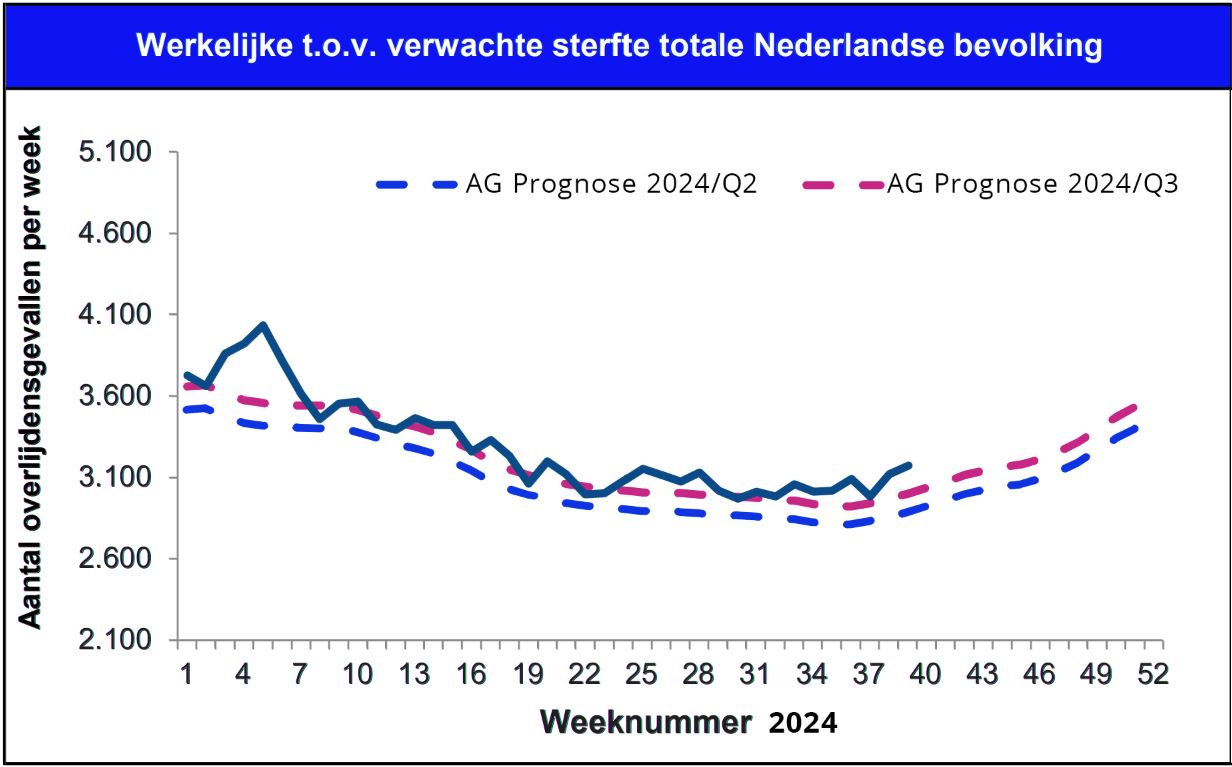
Some like to work with forecasts from the actuarial society. To illustrate, here are two forecasts for 2024. The blue dotted line is their forecast from the second quarter, The purple one quarter later. It will be clear that it is better in the direction of mortality up to that point: less excess mortality.
A healthier life expectancy and stable norm mortality is elementary for a finger on the pulse of public health. The government no longer provides for this.
Nice that you put some nuances Hans. I agree with you that there really is something going on, but 30% was 'grossly' exaggerated in my opinion. A regression line depends on its data points, and if they have a slightly larger deviation from the start year and the last year, it can give (too) large deviation.
In addition, there are also some comments to be made about those forecasts. Although I don't have the deeper zoomed-in forecasts of 40-50 exactly in mind.
But I'm glad you put the necessary nuances. That always has added value for me, when one indicates any weaknesses and strengths in a calculation.
I saw it too (also learned 😉 from you years ago) but in the run-up to the debate I didn't mind at all shaking the tree. You can discuss any baseline, so I will discuss this -otherwise very common, perhaps most used- method.
Thank you for this excellent review!
I almost completely agree with the conclusions, but an average of good and less good methods doesn't mean much to me. On one point I see it a little differently:
The fact that three CBS forecasts (including the one from 2019, from the pre-corona period) are very close to the 10-year exponential trend line - where that trend line is also more logical and has a better correlation with the data - indicates to me that the choice to work with it is really preferable.
And with that, the excess mortality for that group in 2024 was still more than 20%.
I understand your point Bonne regarding your 1st paragraph. The 40-50 group should not experience any effects of corona. and the subsequent interventions (measures, vaccinations). If there had been significant corona mortality, it will have been very low in 2023 and 2024, around 10. That cannot explain the excess mortality.
I notice 2 things, without an explanation.
1. What is the reason that in 2023 the mortality of that group is suddenly much lower again?
2. Is there any insight into the (additional) causes of death of all the higher mortality of this group of ladies? By the way, it mainly concerns women before the meno-break, so in the childbearing age. Would that give the beginning of an explanation?
Yes, that 2023 is striking, no idea... But group 40-50 is beginning menopause (usually 45-55 but also earlier or later) so there are new complaints for the women concerned.
Anton, can you take a look at this too? I don't understand it. I come up with lower mortality for women aged 40-50 years if I take the raw figures from CBS. Did I do something terribly stupid?
http://disq.us/p/32gxwzv
I have informed Hans, in case he does not receive any notifications. Doesn't it have to do with the fact that you share on the entire population? In groups with low mortality rates, there is no effect. But I'm happy to leave this to Hans, he did the math.
No, it is not. I plotted the mortality per 40 million. Of course, the absolute numbers are much smaller than in the elderly. But relatively it is only not correct if the cohorts 40 – 50 have changed very substantially in the number of inhabitants compared to the total number of inhabitants. I don't expect that to have shifted much..... Migrants have mainly arrived who are a little younger than 40. So that would make the relative mortality slightly lower. On the other hand, previous migrants have now reached 40 -50. Boomers were already past that age. So seems like a very small effect to me, but I could be wrong.
The crux is the downward trend in mortality in the period 2010-2019. The trend is downward. If it hadn't been for corona and all the interventions, that downward trend would have continued.
I have put an answer with a picture on Maurice's site.
http://disq.us/p/32gzsqq