
The vaccines have been offered to almost all residents, but was that justified? Was the level of protection proportionate to the risks that all medicines entail? And what do we think of the costs? Should everyone be eligible for a vaccination? In this article, we explain that in 2021 the vaccine could only be given responsibly to people over the age of 80 and in 2022 even only over the age of 95. An article by Herman Steigstra in collaboration with Anton Theunissen.
Death risk all causes
The vaccine should protect against the risk of dying from the consequences of infection with the SARS-Cov-2 virus. It should also reduce the pressure on the ICU and the risk of getting sick in general, but that is difficult to measure and so we will leave that out of consideration in this article.
Let's start with a definition issue. Vaccination prevents the cause of death COVID-19 but if a patient subsequently dies of ordinary pneumonia, we have made little progress. That is why we look in particular at total mortality. We have a Extensive analysis published of the development of mortality since 2000 and can therefore not only make a prognosis for the corona years, but also a calculation of mortality in 2020-2022 broken down by age. This graph (derived from the figures in this publication) is our starting point:

Here we see the baseline as a blue line that represents the expected number of deaths per year for each age.
The thick orange and green lines represent excess mortality in 2020 and 2021 respectively. The thin lines are the total mortality in 2020. We see that this excess mortality is more or less proportional to the baseline.
On average, this excess mortality caused by covid-19 was around 9%. For 90+ a little less, from 74 to 82 years a little more.
For 2021 (green, the first year of vaccination), we see a clear shift in the excess mortality to lower ages. It gives the impression that the elderly enjoyed protection from the vaccine, but that the lower ages are responsible for the unexplained excess mortality.
In order to be able to better assess these figures, we are making two adjustments: we are going to standardize on the number of inhabitants for each age, so that we will get a mortality rate. We are also going to use a logarithmic axis, because there will be large differences in mortality probabilities. This will then be the new graph:
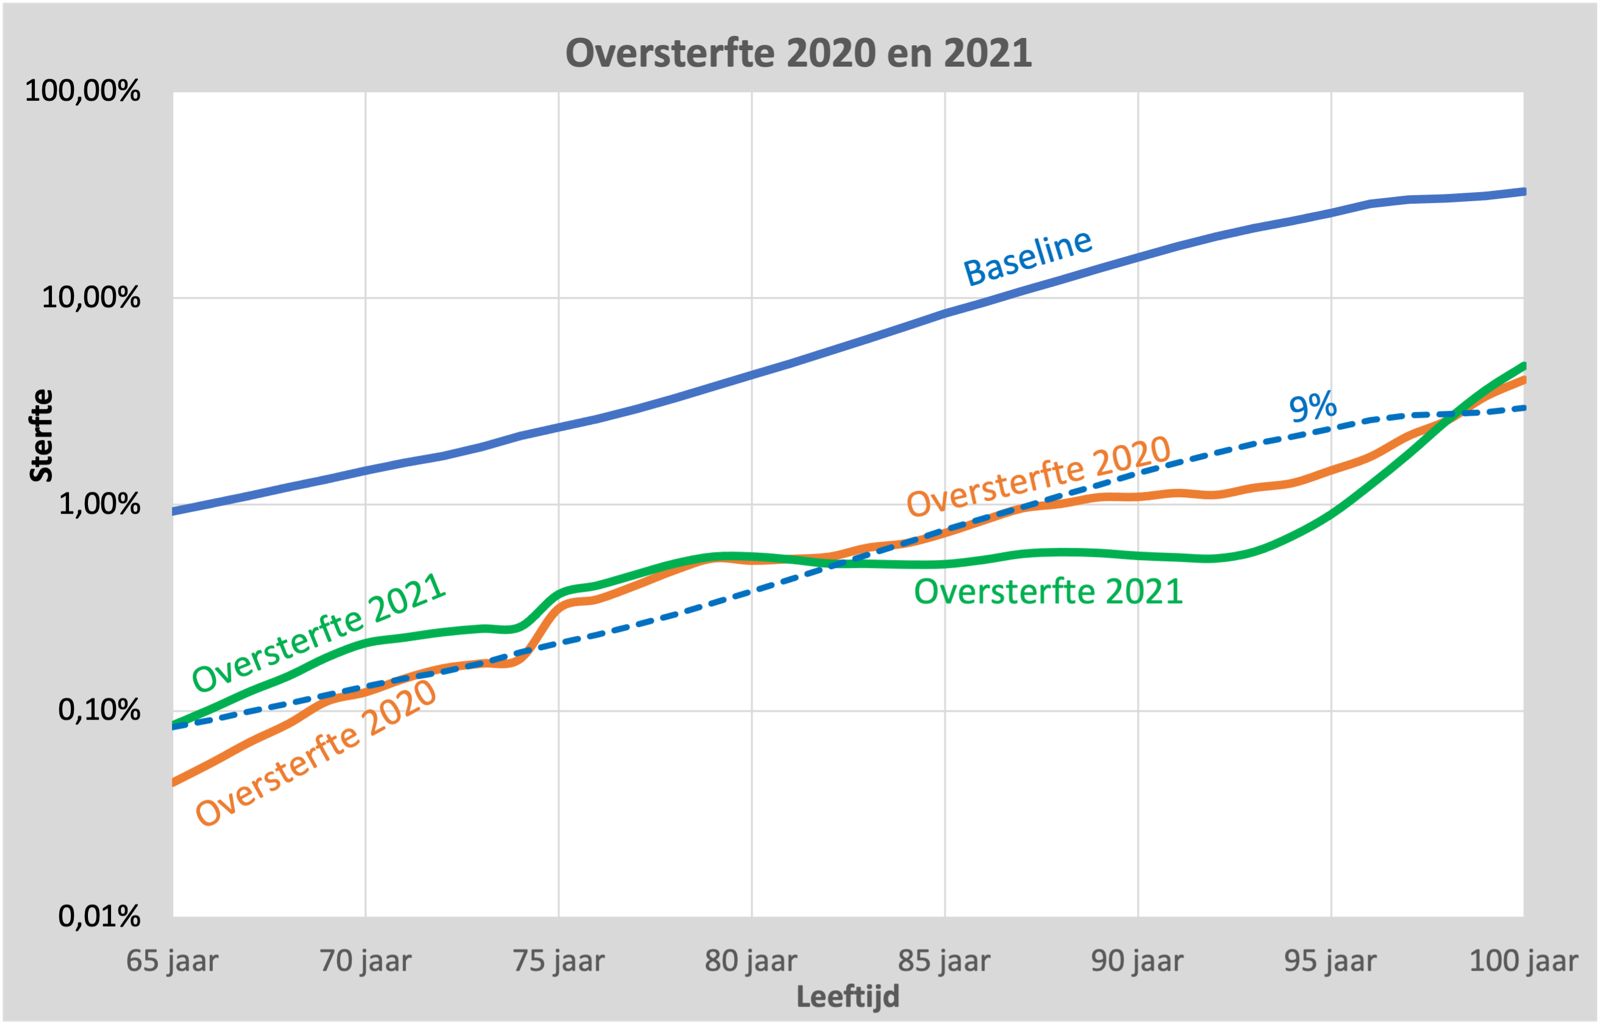
In this graph, we see the mortality rate per age as a blue line: the baseline. For example, for a 65-year-old, the chance of dying that year is 1%, for a 90-year-old 16%. This is the multi-year forecast for all years up to and including 2020. But in 2020, there was excess mortality due to the corona pandemic, which resulted in a total excess mortality of 9%. If it were the same for all ages, we would get the blue dashed line. In reality, we found the orange line as excess mortality. We see that the general picture is that all ages were indeed affected equally in proportion. In absolute terms, of course, it was the elderly who were the most vulnerable and therefore had the most mortality.
Vaccinations were carried out in 2021, so you would expect that the combination of built-up immunity and protection from the vaccines would result in fewer deaths. But nothing could be further from the truth when we look at the green line. However, we do see a 50% decrease in excess mortality for the elderly (over 85 years), which is good news. But for everyone under the age of 80, excess mortality actually increased, which is strange. We'll come back to it later.
Covid-19 death risk
If we look separately from excess mortality at the probability that covid-19 will cause the cause of death then we have to look at the protection that the vaccine offers us. We published about this in this article which is based on the released CBS figures, from which we can make a good estimate for this VE (=Vaccination effectiveness). We published this graph for the VE in it:
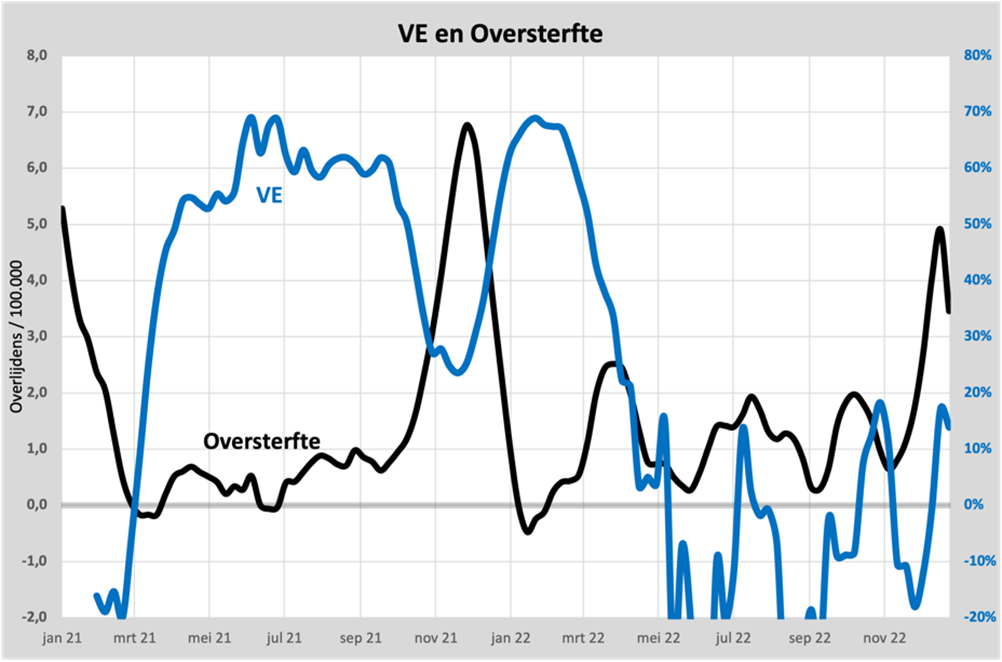
If we look at the VE, we see that it was around 60% in the summer of 2021, but just when the Delta variant appeared and we desperately needed the protection, the VE was only 20%. For further calculations, we are in favour of the vaccine and calculate with an average VE of 50%.
For 2022, protection seems to have completely disappeared after the appearance of the Omicron variant. We will then calculate with a protection of 25%.
Number Needed to Vaccinate
We have now gathered all the necessary information to perform a calculation of what is called "Number Needed to Vaccinate" or NNV in healthcare. That is the number of vaccinations that must be administered to prevent one death. For example, with a serum against venomous snake bites, it will be a little more than 1, because after a bite from a snake you usually die, but after administering the serum you usually survive. With a vaccine, that number will be much higher, because you will have to administer many thousands of vaccines to prevent one death, but how many? We're going to calculate that now.
The first number we need to know is how many deaths are potentially preventable. We assume that there will be as many deaths from covid-19 in 2021 as there was excess mortality in 2020, which seems to be a reasonable starting point. So we ignore the build-up of natural immunity. We also know the approximate vaccination rate and it was done three times in 2021 (baseline and booster). By multiplying and dividing all these figures, we can calculate for each age how many vaccines were needed to prevent one death with cause of death COVID-19.
In 2022, we see that mortality from covid-19 was much lower and the protection of the vaccines was also halved. We can now graphically plot the two NNV values:
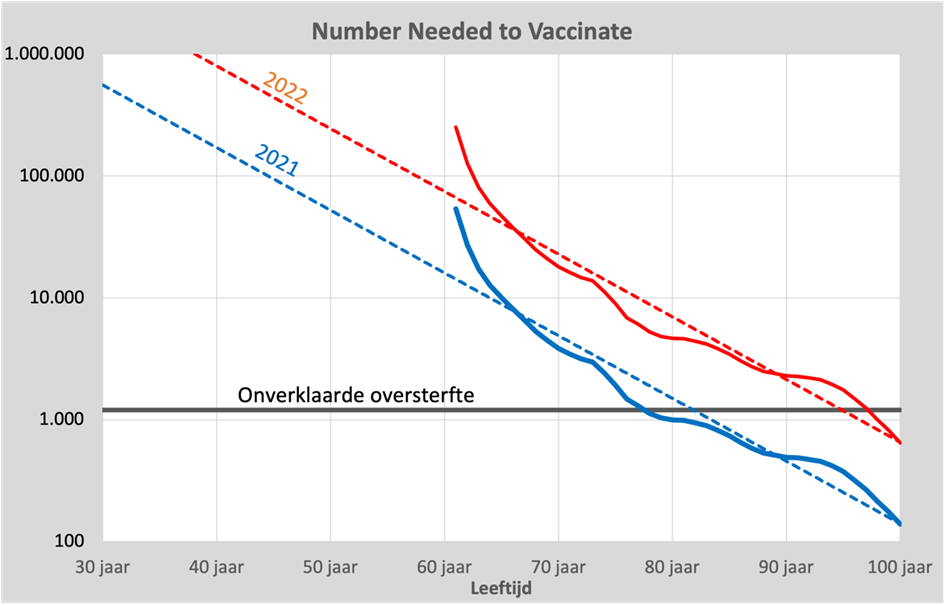
The blue line is the NNV value for 2021 and red for 2022. The dashed lines are the trend lines based on the ages above 60 years. Below that, the mortality numbers are too low to provide reliable figures.
As an example, we see that in 2021, about 7000 vaccinations are needed for a 70-year-old to save 1 life, for a 30-year-old 500,000. For 2022, these values are five times higher, i.e. 35,000 for a 70-year-old and 2,500,000 for a 30-year-old. Staggering numbers!
Unexplained excess mortality
In addition to protecting life through the vaccines, there are also other causes that determine the risk of death. They are still officially referred to as "Unexplained excess mortality", but we must take into account that vaccination may play a role here. There is more and more evidence that there is a relationship, but the quantity has still not been definitively established. As an example, we assume a frequently mentioned probability of 1:1200. We assume that this is the same for all ages, but it is probably close to 1:400 for the elderly. The numbers are becoming too small for reliable conclusions.
In graph D, this probability is indicated by a black line. If this is correct, then you should not administer the vaccine if the risk of dying from the side effects of the vaccine is greater than the protection that the vaccine gives you. That would mean that the vaccine was only useful for the 80+ group in 2021 and even only for 95+ in 2022. Everyone should be able to fill in for themselves what they think the safety of the vaccines might be. Including this chart in the package leaflet should be mandatory.
That 1:1200 is an estimate based on calculation models, which are still being contested. But Chart A seems to give a strong indication of it anyway.
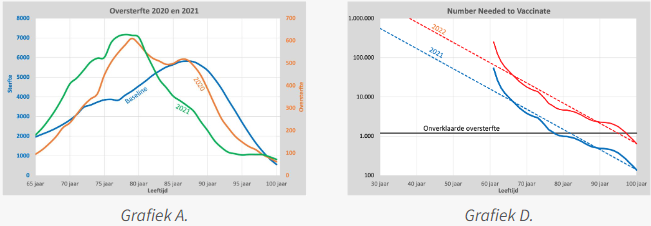
We see that mortality among 82 years in 2021 was the same as in 2020. There was no useful effect of the vaccinations, but also no negative effect, which we do see in the lower ages. 82 years is also exactly the age at which the NNV value (the blue dashed line) is almost equal to 1200.
Cost
The report drawn up 10 years ago Kosteneffectiviteit in de zorg the government is urged to be cost-effective, but that does not seem to have been the case here. If we assume that a QALY may cost €20,000 for preventive medication, then protecting the life of a 30-year-old in 2021 is far beyond our budget: an average of €25,000,000 per prevented death spent. If we assume that this person can live to be 80 years old after saving this life, then we spent € 500,000 per year and that is 25X above the budget. Would this have received the approval of Parliament if it had been debated? We don't think so.
Conclusions
Vaccination provides protection, but also risk. Based on the available figures from Statistics Netherlands, we conclude that vaccination in 2021 was only useful for people over the age of 80. In 2022, this was even for people over the age of 95. Among these ages, the risk of "Unexplained Death" was actually higher. If we look at the financial resources that these campaigns have swallowed up, it has been an investment in health damage.
It is a pity that 1 of the most important arguments has not been mentioned. Namely, the interview that the European Commission had with a Pfizer executive. The latter mentioned during the interview that the vaccine should never have been provided other than to the most vulnerable seniors.
Agree, suppose that a.o. If Pfizer develops and tests the corona vaccine in good faith with the "speed of science", then the governments decide on their own to apply it off-label for herd immunity. It hasn't been tested for that, so the government is responsible. And that is also the deal that was made with Big Pharma. But now the governments have to step up to the plate!
Perhaps a very thick book will come out in which all the clues and evidence are collected. That will be a very thick book. There is a huge number of hearings, leaked documents, testimonies, whistleblowers, hidden camera recordings, FOIA documents, etc. Elsewhere on this site you will come across a number of them. Unfortunately, not all of them can be included in every article.