


CBS wrote an article with provisional figures on mortality in 2024. The final figures with numbers per age and gender will not be released until May, but CBS has already reported that last year there were 2,300 more deaths in the age group from 80 years and older than the year before.
This article was also published on steig.nl
It is unclear why CBS is reporting this as news, because what we see here is simply an aging population. Nowadays, more elderly people die every year than the year before and this is due to the structure of the population pyramid.
Statistics Netherlands seems to want to emphasize increased mortality due to an aging population. The emphasis in the CBS article is therefore on mortality among the elderly, as we read here:
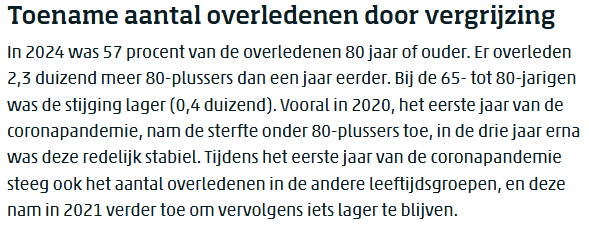
Quality newspaper NRC takes over seamlessly and even explicitly describes that mortality remained at the same level after the corona pandemic ended.


The text structure makes it seem as if population growth and aging are responsible for the mortality level of a pandemic. A rather absurd claim. Time for journalistic curiosity: how is that possible? We no longer find that in NRC/VK, so we're doing it again.
A much clearer CBS headline would have been:
Persistent excess mortality up to the age of 80
Because Statistics Netherlands provides the number of additional deaths for people aged 80+ ('2.3 thousand'), we can now easily calculate how much the additional mortality under has been 80 years. We can read between the lines how the story works, but first let's take a closer look at the figures. This is the histogram with mortality since 2018 based on the official CBS figures:

The red bars are the forecasts for the number of deaths for people aged 80+. That is approximately 1,700 more each year than the year before (the "aging"), indicated by the red line in the graph. The orange bars are the actual deaths for 80+. Blue is identical for deaths up to the age of 80.
Excess mortality 80+ decreased
In 2020, there is an excess mortality of 7,150 among people aged 80+ due to corona (the orange bar). From 2021 to 2023, this decreased by around 1,500 annually, so the total mortality remained virtually constant (the difference between 1,700 and 1,500). CBS is therefore correct in its finding that mortality at 80+ Right away is increasing, because excess mortality has now virtually disappeared, and we are again following (adjusted) aging figures. That seems to be the good news: we are back to “normal” if we look at 80+. Aging is what we all accept. But…..
Excess mortality 80- continues
The same graph shows mortality up to the age of 80 in blue. The dark blue bars are the forecasts for deaths in this age group, light blue the actual mortality. It is remarkable that the prognosis remains virtually constant over the years: each year only 100 more deaths are expected than the previous year (the blue line).
But the continued excess mortality is worrying. In the first corona year, 5,800 more deaths than average, which has even increased to 8,700 in 2021, while corona had virtually disappeared. Where we will be at 80+ 2000 in 2021 less count deaths than the previous year, there are actually 3,000 among the 80 lake and that is something you would not expect with an epidemic that has virtually disappeared.
13 years of excess mortality under the age of 80
Now you would hope that excess mortality at this age would disappear as quickly as among the elderly, but unfortunately that does not appear to be the case either. Annual excess mortality will decrease from 2022, but it will be painfully slow. We can see that clearly in this graph:

It appears that we will have to adjust the prognosis for mortality at 80+ slightly upwards. After all, this forecast is still based on the figures from 2010-2019, which are therefore now 6-15 years old. However, the differences are very small and mortality may increase slightly less than the 1900 per year in 2025. An uncertain prognosis.
However, for the younger age group we see a completely different story. The recovery is painfully slow. With an average decline of only 800 per year, at this rate it will take until 2033 before the excess mortality of 8,700 will disappear again in 2021. Thirteen years of excess mortality in the healthiest part of our population!
Deaths per 100,000 inhabitants
We get a better picture if we convert the mortality figures to the number of deaths per 100,000 inhabitants. In this way we eliminate the aging population. Because mortality is much higher at higher ages than at lower ages, we split the graph in two. This is the graph for 80+ only:

Here we clearly see that the recovery from excess mortality is almost complete. We also see here that the predicted mortality risk is slowly decreasing (we are slowly getting older and healthier) and that we are now at the forecast for 2021 for the 80+ group.
Things are very different among the youngest half of the population:
After the first corona year, an additional death in 2021, which we do not see in the 80+ group. In 2021, excess mortality under the age of 80 was as much as 12.5%. This excess mortality decreased very slowly to 9% in 2024. We still have 7 tough years ahead of us!

And what about mortality under 65?
We have neatly divided the population into those under and over 80 years old, but what about the youngest cohort? There the expected mortality is of course lower, but we can still compare it with the actual mortality. The mortality for this age group can also be shown in the same graph:

Same picture here too. In fact, virtually no excess mortality in 2020, but from 2021: 9.5% in 2021. Here too, only a slow decline as in the entire 0-80 year group. Because the vaccination rate was lower here, the excess mortality is also somewhat lower here.
"Iets anders"
In november 2023 we published a calculation method to accurately calculate excess mortality per age. In it we showed an earlier version of this graph:

The histograms in this article contain the exact same numbers, but in this graph they are broken down by age. This way we can clearly see what the actual progression is by age. The arrows indicate the direction in which mortality will move in the years after 2020: declining mortality at the age of 80+ and increased mortality under the age of 80, the direction of the arrows.
The black line is the excess mortality in 2020, the first corona year. The colored lines are the excess deaths in the following years. We clearly see here that mortality decreases for those over 80 years of age and will completely disappear in 2023 above the age of 85, after all, there is no more corona.
The behavior under the age of 80 is opposite. Corona had no effect at all on 60-year-olds, but from 2021 mortality increased for all ages under 80. The cause must be sought in “Something else” that has only been there since 2021, but what?
Where is the research?
You would expect that the RIVM or CBS would conduct research into this persistent excess mortality among the youngest half of the population. But nothing could be further from the truth. Nivel comes to the conclusion that this is the case 20% under-mortality among vaccinated people, which make up 90% of the population. This would also lower total mortality than the forecast. This statement cannot in any way be reconciled with these CBS figures.

I am afraid that in the foreseeable future the whole world - except the Dutch political elite - will recognize that there is not only a correlation between mRNA injections and excess mortality, but that causal relationships also play a role here.
The brilliant Dutch historian Mathieu Segers, who unfortunately died much too early in 2023, described in 2021 in his essay 'The Fall of the Netherlands' the sociological breeding ground (or cause) of a certain superior, because 'independent', Dutch political preference that prefers attention to consequences over causes. Segers:
“The Dutch preference for a 'politics of consequences' instead of a 'politics of causes' can lead to a curious perception of reality.... The shift in political attention from causes to consequences leads to a neglect of ethics.”
To continue later with: "Knowing something but understanding little about it, that Dutch sin stems from concealing dependencies. It now also destroys our self-image. ... The promotion of public affairs is shaky on all sides, from implementation to legal protection, from iron stocks to tendering, and from institutional racism to failed climate policy. The citizens of the same state are increasingly victims - lives are destroyed, people die."
And then Segers' finishing touch to his historical observations, which he summarizes as succinctly as follows:
“Abroad, no matter how existential, was and is not fodder for the Dutch public debate. On the contrary. The Dutch wisdom still applies here today: SPEAKING IS SILVER, BUT SILENCE IS GOLD.”
And that's where we are now...
Thanks again for this column!
Science is scientific,
Truth is an opinion.
It is too sad for words how figures are manipulated to present them in bite-sized format to the docile churchgoers. The image of the injection must be and remain good, so that future mRNA injections can also find arms. Bah.
I recently came across this research.
Strangely enough, the outcome is applauded, but of the 12% dropout rate, the reason for dropout has only been determined for a small group...
The article can be read in full for free by clicking on the links and entering your email address.
https://www.ntvg.nl/artikelen/effectiviteit-van-covid-19-vaccins-nederland
Herman, You write under the last graph that corona had little effect on 60-year-olds - at least it was hardly fatal. In years 21, 22 and 23, the excess mortality in that group is also proportionally much lower.
What could be the explanation for that?
In the 60-65 age group, injections were mainly administered with Astrazeneca. That vaccine had many side effects, but did not contain N1-methylpseudouridine nor fat globules. That vaccine also generated little or no IgG4 antibodies. This could be a possible explanation for the fact that there appears to be less long-term damage.
But all this does not explain why 60-year-olds did not die from corona.
Hopefully some more light will be shed on this mysterious pattern.
In any case, thank you very much again for this analysis.
Mortality had little control over this group in 2020, even before vaccination. As an amateur virologist, I would think that this group has built up immunity against corona viruses in their youth. You will have to take this question to a real immunologist for a more reliable answer.
I would like to know how much the environment influences mortality risk and actual death from...
I'm thinking of: more GMO food in the local supermarket.
I am thinking of: spraying of pesticides on the land, such as in the bulb growing region.
I'm thinking, a lot of food/crops with pesticide residues. Think of vegetables / tea and all fruit, which we eat with the skin, strawberries / berries / grapes, etc.
I mean, the injections are guaranteed to have an effect, but remember, our food is being made and sold more and more sickening. We have to deal with more and more radiation with smart hassle.
We have to take more and more pills for…
Many people are stressed by the madness world and rules imposed by unchosen ties. Many SME entrepreneurs no longer know how to do business. Making a profit has almost become criminal behavior. Suicide among farmers cannot be counted on one hand.
We live in a crazy world, which for many people really does not help their health. And helplessness stress can really destroy a person.