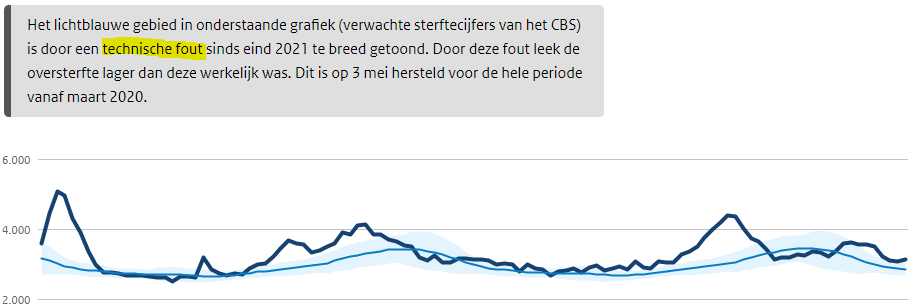
Last weekend I blogged that the Coronadashboard has been pretended for 4 months as if it was not too bad with the strikingly increased mortality (even recurring over -mortality) in last summer.
Great if you notice that prominent figures respond interested. Maurice de Hond paid attention to it the next day on his site and yesterday this message appeared on the Coronadashboard. It would be a technical error, which made the expected mortality in the summer struggled, also in the winter something and spring and autumn caused a smooth transition.

The graph looked perfect and was also 100% identical to that on the CBS site; There was only a slightly different data set behind it. This is only possible with a conversion stroke that increases the expected death in accordance with the description of increase and reduction. You can view an example of the dataset with which the graph is made below. (It must be test dates; the file is from April 16, 2021 and the death dates were already in it until the end of that year.)
An example dataset whose graph is built for the idea
Neeltje Vermeulen shared A link to a dataset. Shown as a table:
| Periods | Expected | Lower limit | Upper limit |
| 2020W101 | 3278 | 2628 | 3928 |
| 2020W102 | 3312 | 2649 | 3974 |
| 2020W103 | 3346 | 2679 | 4011 |
| 2020W104 | 3392 | 2741 | 4042 |
| 2020W105 | 3407 | 2757 | 4060 |
| 2020W106 | 3400 | 2719 | 4080 |
| 2020W107 | 3409 | 2688 | 4131 |
| 2020W108 | 3385 | 2635 | 4136 |
| 2020W109 | 3350 | 2590 | 4110 |
| 2020W110 | 3314 | 2573 | 4056 |
| 2020W111 | 3253 | 2536 | 3970 |
| 2020W112 | 3175 | 2476 | 3874 |
| 2020W113 | 3105 | 2462 | 3751 |
| 2020W114 | 3027 | 2446 | 3606 |
| 2020W115 | 2958 | 2422 | 3493 |
| 2020W116 | 2916 | 2400 | 3432 |
| 2020W117 | 2870 | 2363 | 3379 |
| 2020W118 | 2845 | 2338 | 3351 |
| 2020W119 | 2823 | 2328 | 3319 |
| 2020W120 | 2794 | 2296 | 3292 |
| 2020W121 | 2770 | 2275 | 3268 |
| 2020W122 | 2756 | 2275 | 3238 |
| 2020W123 | 2737 | 2262 | 3212 |
| 2020W124 | 2737 | 2264 | 3206 |
| 2020W125 | 2725 | 2268 | 3181 |
| 2020W126 | 2717 | 2266 | 3167 |
| 2020W127 | 2721 | 2254 | 3188 |
| 2020W128 | 2720 | 2247 | 3192 |
| 2020W129 | 2719 | 2235 | 3201 |
| 2020W130 | 2707 | 2231 | 3182 |
| 2020W131 | 2687 | 2208 | 3167 |
| 2020W132 | 2681 | 2177 | 3184 |
| 2020W133 | 2667 | 2166 | 3169 |
| 2020W134 | 2663 | 2181 | 3145 |
| 2020W135 | 2669 | 2190 | 3148 |
| 2020W136 | 2680 | 2207 | 3153 |
| 2020w137 | 2699 | 2221 | 3176 |
| 2020W138 | 2732 | 2252 | 3212 |
| 2020w139 | 2756 | 2277 | 3235 |
| 2020W140 | 2786 | 2294 | 3278 |
| 2020W141 | 2809 | 2320 | 3297 |
| 2020W142 | 2839 | 2346 | 3331 |
| 2020W143 | 2862 | 2349 | 3374 |
| 2020W144 | 2888 | 2368 | 3408 |
| 2020W145 | 2901 | 2368 | 3435 |
| 2020W146 | 2933 | 2402 | 3463 |
| 2020W147 | 2972 | 2441 | 3502 |
| 2020W148 | 3017 | 2465 | 3567 |
| 2020W149 | 3035 | 2439 | 3631 |
| 2020W150 | 3098 | 2492 | 3703 |
| 2020W151 | 3167 | 2538 | 3796 |
| 2020W152 | 3223 | 2582 | 3864 |
| 2020W153 | 3270 | 2627 | 3917 |
| 2021W101 | 3309 | 2660 | 3959 |
| 2021W102 | 3345 | 2684 | 4007 |
| 2021W103 | 3377 | 2709 | 4044 |
| 2021W104 | 3425 | 2774 | 4075 |
| 2021W105 | 3440 | 2788 | 4093 |
| 2021W106 | 3435 | 2755 | 4113 |
| 2021W107 | 3442 | 2722 | 4164 |
| 2021W108 | 3420 | 2671 | 4170 |
| 2021W109 | 3387 | 2628 | 4146 |
| 2021W110 | 3349 | 2608 | 4090 |
| 2021W111 | 3285 | 2566 | 4003 |
| 2021W112 | 3209 | 2510 | 3906 |
| 2021W113 | 3136 | 2492 | 3780 |
| 2021W114 | 3055 | 2476 | 3634 |
| 2021W115 | 2987 | 2452 | 3523 |
| 2021W116 | 2946 | 2430 | 3462 |
| 2021W117 | 2897 | 2388 | 3405 |
| 2021W118 | 2868 | 2363 | 3376 |
| 2021W119 | 2848 | 2354 | 3346 |
| 2021W120 | 2819 | 2319 | 3320 |
| 2021W121 | 2797 | 2301 | 3294 |
| 2021W122 | 2780 | 2298 | 3264 |
| 2021W123 | 2763 | 2286 | 3239 |
| 2021W124 | 2765 | 2294 | 3235 |
| 2021W125 | 2753 | 2295 | 3207 |
| 2021W126 | 2743 | 2293 | 3192 |
| 2021W127 | 2749 | 2282 | 3216 |
| 2021W128 | 2743 | 2272 | 3215 |
| 2021W129 | 2746 | 2263 | 3229 |
| 2021W130 | 2733 | 2260 | 3208 |
| 2021W131 | 2714 | 2237 | 3193 |
| 2021W132 | 2708 | 2205 | 3211 |
| 2021w133 | 2696 | 2195 | 3197 |
| 2021W134 | 2689 | 2206 | 3170 |
| 2021W135 | 2692 | 2215 | 3171 |
| 2021W136 | 2703 | 2230 | 3176 |
| 2021w137 | 2727 | 2248 | 3204 |
| 2021W138 | 2755 | 2275 | 3235 |
| 2021w139 | 2778 | 2301 | 3256 |
| 2021W140 | 2813 | 2320 | 3305 |
| 2021W141 | 2835 | 2346 | 3325 |
| 2021W142 | 2867 | 2373 | 3358 |
| 2021W143 | 2889 | 2377 | 3402 |
| 2021W144 | 2917 | 2398 | 3436 |
| 2021W145 | 2930 | 2398 | 3463 |
| 202W146 | 2960 | 2430 | 3490 |
| 2021W147 | 3003 | 2475 | 3533 |
| 2021W148 | 3044 | 2493 | 3595 |
| 2021W149 | 3067 | 2471 | 3661 |
| 2021W150 | 3128 | 2524 | 3734 |
| 2021W151 | 3196 | 2567 | 3826 |
| 2021W152 | 3255 | 2613 | 3895 |
Someone suggested that there might have been a commata wrong ... so we are talking about a bug. A bug that retains the first value, lowers the second and increases the third - and then in a different way in winter than in the summer.
If a technical error gets an assignment if it gets so perfectly done, the question arises as to why updating something like the Corona app should cost 49 million.
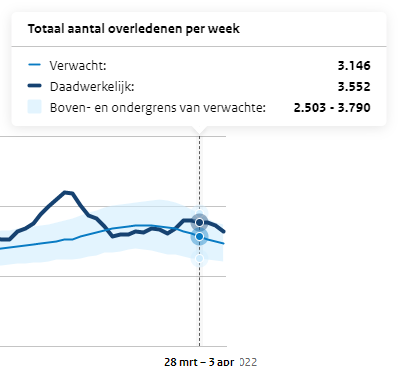
The disinformation is still there: there was excess in March
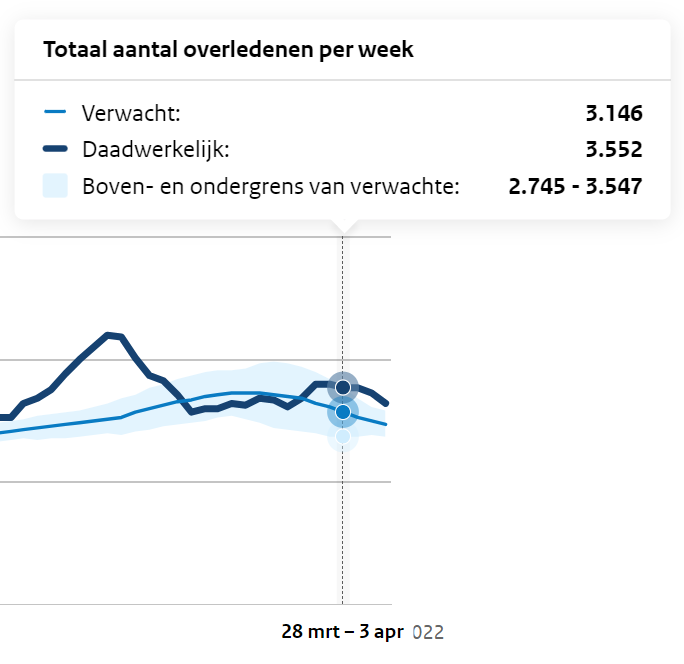
At the end of March/beginning of April, the point immediately makes clear: the previous graph showed no excess mortality and the text then responds conveniently. In the correct graph you can see that the text is not completely correct. In any case, not at all.
Take a look, first the explanatory text as it is on both the VWS and the CBS site. Then the virus varia version.
VWS version (Coronadashboard)

An estimated 3600 people died in the last week of March (week 12, 21 to March 27, 2022). That is slightly more than died in the week before (3567) and about 400 more than expected. About 500 more people died throughout March than expected. The mortality was especially higher among Wlz care users and people over 65. Statistics Netherlands reports this on the basis of the provisional death rates per week.
Virus varia version
March: Increasing mortality leads to overdiction
An estimated 3,600 people died in the last full week of March, around 400 more than the week before. In the two weeks before 306 people more than expected, together around 700 more people than expected.
The mortality was especially higher among Wlz care users and people over 65. The overflow to April shows over mortality, while it is unclear where it comes from. Virusvaria.nl reports this on the basis of this week's provisional death figures.
28, 29, 30 and 31 March are really days in March. In that week there is already excess mortality-at least according to the CBS standard, not according to the Propagandanorm of VWS. So what is in the head is simply not true. In De Telegraaf, allà, but on a government site ...
With a handy definition of "last week", so that everything no longer belongs to March after March 27, it seems as if there was no excess in March. That was true with the previous manipulated graph but no longer with the image that the correct uncertainty margin displays. According to VWS Week 12, 21 to 27 March 2022, the last week of March. They may mean the last "full" week? If "the first week of April" will soon be the first full week, which starts on April 4, there is again one over -mortality week less in between to explain.
And then that sentence: "The CBS reports this on the basis of the provisional death rates per week." That is also in the message on the CBS site ...!? I understand that it is on the VWS/RIVM site, but you don't put that on your own site, do you? As if the CBS has taken over the entire message from the RIVM/VWS version, including the now referring sentence. CBS also does not post “Source: CBS” on every page?
Maybe it's just press releases speak on a public site. But my mind's eye sees the next Wob document appearing again:
From: zwartgelakt@minvws.nl
At: zwartgelakt@cbstatistiek.nl
Re: Streamlining communication excess mortality
Do you know what: we streamline the interpretations as follows: Send us the data, we will make something beautiful and then you also place our interpretation on your own site.