
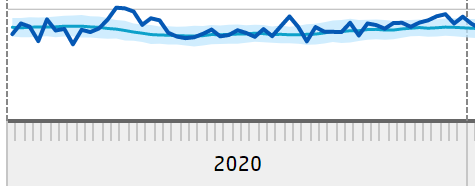
Frequently asked question: "What about the under-65s? There is no excess mortality to be seen there, is there?" Indeed, you don't hear much about it. Up to the age of 65, the majority of people always come off more mercifully than the oldest. This can already be seen in the graph on CBS. The lower blue line (65-min) shows far fewer bumps than that of the over-65s. It is of course the bottom line because mortality is lowest there, around 350 to 400 every week. We take a closer look at a few parts of the latest news item from CBS, which dates from 5 August.
CBS writes about July 2022: "Mortality among people under the age of 65 was estimated at 400 in week 30, slightly more than expected. For this age group, mortality in July was over 100 more than expected for that month. Only in week 28 was there excess mortality."
Apparently, there is no reason for concern in the event of excess mortality in July among people under 65 and that previous excess mortality was only "slightly more than expected". So it is not quite right, 100 too many, but actually there was only reason to speak of excess mortality in week 28. That excess mortality is the last peak of this line:

If the average is 350 per week, then 100 extra deaths represent about 7% more than the total mortality per month (of 65-).

2020 as a reference year
In 2020, we also recognize the periods in which the coronavirus occurred among the under-65s. In the summer we see the peak of the heat wave. Furthermore, mortality meanders around the line of expected mortality. This is what it should look like.
At the end of the year, mortality rises again, the flu season makes its appearance (the "second wave").
July viewed as a period
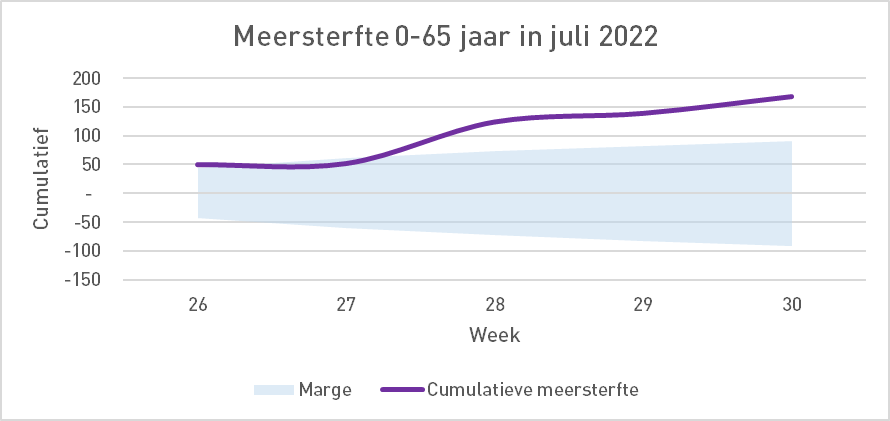
Who "Bandwidths for dummies" knows that we should view persistent excess mortality with suspicion. That seems to be the case here. So we are going to visualize it cumulatively and we also sum up the weekly margins in a statistically sound way (not perfect but good enough). There now seems to be cause for concern because in the month of July, contrary to what we read in the news item, there was already excess mortality in the second week that continued to rise:
Just to check: how did things go with the under-65s earlier in the year? It then turns out that there was an excess mortality situation much earlier, from week 15:
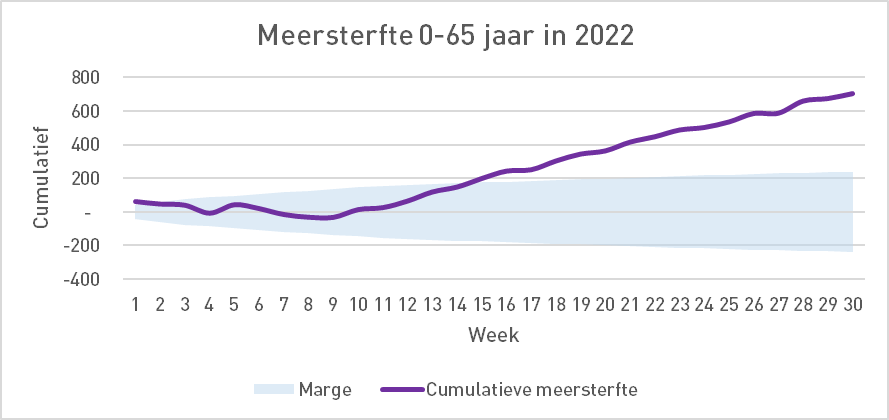
N.B.: The lower mortality at the beginning of 2022 can be explained by the substantial excess mortality at the end of 2021. Unfortunately, a number of those deceased passed away a few months 'too early'.

Apart from this undermortality fluctuation, there does seem to be a continuous undercurrent that quickly leads to excess mortality. Seen from August 1, 2021, so the entire past 12 months in the picture:

Now it is the case that every August starts at zero again. It is also defensible that you have to "reset" from time to time because some excess mortality peaks you never catch up with. That would otherwise mean that you would be permanently left with previously accumulated excess mortality while weekly mortality may have long since normalized, possibly even with some less mortality. The line then remains horizontal and no longer descends far enough to end up in the safe zone again.
What we see here, however, is a continuous upward trend that cannot be rationalized in an age group that normally suffers little from viruses.
How many people under 65 are actually involved?
- If we count from 1 August 2021, there are 1,995 too many under-65 deaths. It could have been about 350, according to the annual margin.
- The RIVM site reports that a total of 22,598 Dutch people have died from Covid since March 2020.
- 8% of Covid deaths were under the age of 65. Only 1% were even under 50 years old.
- 8% of 22,598 is 1,808. That means: 1,808 deaths from Covid in just over two years compared to 1,995 from largely unexplained excess mortality – in the past twelve months alone (today 31 Aug 2021).
Conclusion
The mysterious excess mortality has cost more lives to 65-year-olds last year alone than the entire coronavirus epidemic has taken away in this age group, including the first and second waves.
It is surprising that our public health guards did not jump on this a year ago. It took months and a motion was needed to order an investigation. Jaap van Dissel's body language indicated that he thought it was a rather pointless exercise. "Well, then we will have to investigate that," he sighed.
The motion asked for an independent academic study that has still not been carried out. But it is coming and will be carried out under the auspices of the Ministry of Health, Welfare and Sport (via ZonMW), along the lines of a research agenda drawn up by the ministry and with limited availability of the non-public data from the Municipal Health Service (GGD) and Statistics Netherlands, which may be made available in part. The research proposal must then aim at optimising data and models. That doesn't sound like finding out the cause of the excess mortality. To what extent that is related to this will probably be explained.
This raises the question of whether they really want to know something. After all, the public data has already been analyzed from various angles. Or do they already know everything and prefer to shield it? Opening it up is the only thing that will help, perhaps painful, but it is what it is.
–
"The RIVM site reports that a total of 22,598 Dutch people have died of Covid FROM COVID since March 2020."
We all know that those figures are just nonsense.
Starting from those figures and basing a calculation on them is charlatanism.
Those numbers are the best we have... If you start reasoning how many there will really be, you will immediately be 5-0 behind.
Anton, even with the (too high) CBS figures, from August 2021 to the present you only arrive at 1,640 to 1,680 deaths or with corona for the 0-65 group. The figures up to 1 January 2022 are exact, extrapolated from that moment on taking into account that 7% (no longer 8) of deaths are younger than 65 and the total number of deaths from or with corona at RIVM (which are known to date) is a factor of 3 lower than at CBS.
In short, your story still makes sense!
I had estimated that 8% to be more than (i.e. 'safe') based on this page
On the same page, 22,598 Covid deaths were reported.
If the message had been: CBS reports more excess mortality than Covid deaths in 2022, that doesn't say much. After all, that excess mortality also includes covid deaths. It is complicated to explain that excess mortality should be lower.
Hi Anton,
You might find this thread interesting:
https://mobile.twitter.com/orwell2022/status/1566891121103478790
I am not statically educated myself, but perhaps this is interesting for you to consider.
The crux of his argument is that excess mortality is due to 'the corona measures', not vaccination.
MVG
Stijn Hotels
I do not believe that there is only one cause for the excess mortality. The disruption of society is undoubtedly an important driver of this. Even if vaccination had only contributed 20% to this, it would still be a medical blunder of the first order.

Furthermore, he uses Sweden as proof that it cannot be vaccination. However, Sweden is not that undiscussed. There is hardly any undermortality. After the first wave, there was no time for that, then the second wave came. But after that?
Perhaps it is an idea to estimate what the share of vaccinations would be based on Sweden. Orwell insists that there is nothing wrong in Sweden in terms of excess mortality. With a longer-term analysis, I suspect that there is something to be said about that, see picture. He is very firm, I am less so, which is sometimes a bit difficult to talk to. (And I don't like Twitter very much anyway.)