
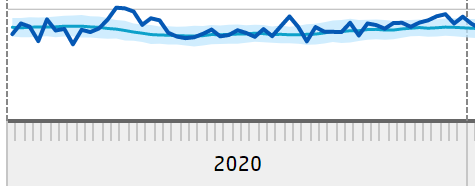
Veelgestelde vraag: "Hoe zit het nou eigenlijk met de 65-minners? Daar is toch geen oversterfte te zien, of wel?" Je hoort er inderdaad weinig over. Tot 65 jaar komt het grootste deel van de mensen er altijd genadiger vanaf dan de oudsten. Dat is al te zien in de grafiek op bij CBS. De onderste blauwe lijn (65-min) vertoont veel minder bulten dan die van de 65-plussers. Het is natuurlijk de onderste lijn omdat de sterfte daar het laagst is, wekelijks rond de 350 a 400. We nemen een paar delen van het laatste nieuwsbericht van CBS onder de loep, dat dateert van 5 augustus.
CBS writes about July 2022: "De sterfte was onder mensen jonger dan 65 jaar in week 30 naar schatting 400, iets meer dan verwacht. Voor deze leeftijdsgroep was de sterfte in juli ruim 100 meer dan de verwachte sterfte voor die maand. Alleen in week 28 was er sprake van oversterfte."
Kennelijk is er geen reden tot zorg bij oversterfte in juli onder 65-minners en die eerdere oversterfte was slechts "iets meer dan verwacht". Het is dus niet helemaal goed, 100 teveel, maar eigenlijk was er alleen in week 28 reden om van oversterfte te spreken. Die oversterfte is het laatste piekje van deze lijn:

If the average is 350 per week, then 100 extra deaths represent about 7% more than the total mortality per month (of 65-).

2020 as a reference year
In 2020, we also recognize the periods in which the coronavirus occurred among the under-65s. In the summer we see the peak of the heat wave. Furthermore, mortality meanders around the line of expected mortality. This is what it should look like.
Aan het eind van het jaar stijgt de sterfte weer, het griepseizoen doet zijn intrede (de "tweede golf").
July viewed as a period
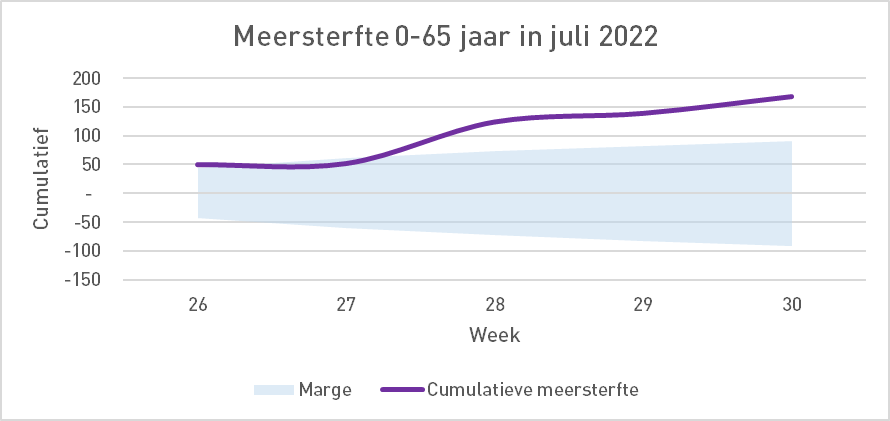
Who "Bandbreedtes voor dummies" heeft gelezen weet dat we aanhoudende meersterfte met argusogen moeten bekijken. Daar lijkt hier toch wel sprake van. We gaan het dus eens cumulatief visualiseren en we sommeren de weekmarges ook op statistisch verantwoorde wijze (niet perfect maar goed genoeg). Er lijkt nu wel degelijk reden tot zorg want in de maand juli was er al, anders dan we lezen in het nieuwsbericht, in de tweede week sprake van oversterfte die maar bleef stijgen:
Just to check: how did things go with the under-65s earlier in the year? It then turns out that there was an excess mortality situation much earlier, from week 15:
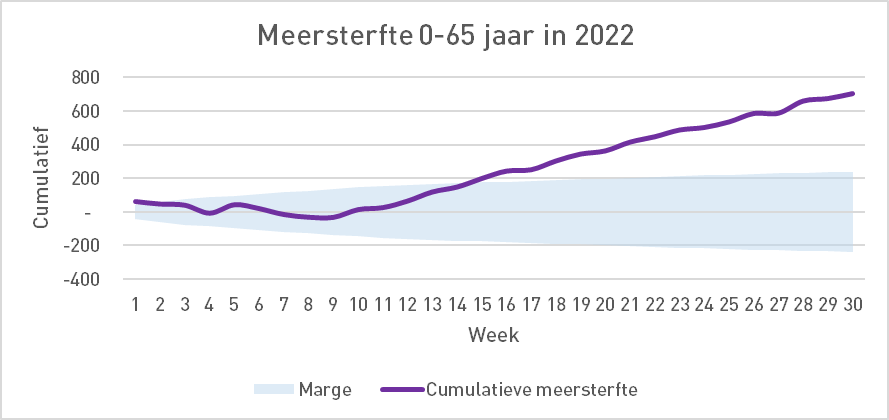
N.B.: The lower mortality at the beginning of 2022 can be explained by the significant excess mortality at the end of 2021. Unfortunately, a number of those who died left us a few months 'too early'.

Apart from this undermortality fluctuation, there does seem to be a continuous undercurrent that quickly leads to excess mortality. Seen from August 1, 2021, so the entire past 12 months in the picture:

Nu is het zo dat elke augustus weer op nul begint. Het is ook te verdedigen dat je van tijd tot tijd moet "resetten" want sommige oversterftepieken haal je nooit meer in. Dat zou anders betekenen dat je permanent met een eerder opgelopen oversterfte blijft zitten terwijl de wekelijkse sterfte misschien allang is genormaliseerd, mogelijk zelfs met enige mindersterfte. De lijn blijft dan horizontaal en daalt niet meer ver genoeg om weer in de veilige zone te belanden.
What we see here, however, is a continuous upward trend that cannot be rationalized in an age group that normally suffers little from viruses.
How many people under 65 are actually involved?
- If we count from 1 August 2021, there are 1,995 too many under-65 deaths. It could have been about 350, according to the annual margin.
- The RIVM site reports that a total of 22,598 Dutch people have died from Covid since March 2020.
- 8% of Covid deaths were under the age of 65. Only 1% were even under 50 years old.
- 8% of 22,598 is 1,808. This means: 1,808 deaths from Covid in more than two years compared to 1,995 from largely unexplained excess mortality - in the past twelve months alone (today, August 31, 2021).
Conclusion
The mysterious excess mortality has cost more lives to 65-year-olds last year alone than the entire coronavirus epidemic has taken away in this age group, including the first and second waves.
Het is wonderlijk dat onze volksgezondheidsbewakers hier niet al een jaar geleden bovenop zijn gesprongen. Het duurde maanden en er was nota bene een motie nodig om een onderzoek te gelasten. De lichaamstaal van Jaap van Dissel gaf aan dat hij het een nogal zinloze exercitie vond. "Tja, dan zullen we dat moeten gaan onderzoeken", verzuchtte hij.
The motion asked for an independent academic study that has still not been carried out. But it is coming and will be carried out under the auspices of the Ministry of Health, Welfare and Sport (via ZonMW), along the lines of a research agenda drawn up by the ministry and with limited availability of the non-public data from the Municipal Health Service (GGD) and Statistics Netherlands, which may be made available in part. The research proposal must then aim at optimising data and models. That doesn't sound like finding out the cause of the excess mortality. To what extent that is related to this will probably be explained.
This raises the question of whether they really want to know something. After all, the public data has already been analyzed from various angles. Or do they already know everything and prefer to shield it? Opening it up is the only thing that will help, perhaps painful, but it is what it is.
-

"The RIVM site reports that a total of 22,598 Dutch people have died of Covid FROM COVID since March 2020."
We all know that those figures are just nonsense.
Starting from those figures and basing a calculation on them is charlatanism.
Those numbers are the best we have... If you start reasoning how many there will really be, you will immediately be 5-0 behind.
Anton, even with the (too high) CBS figures, from August 2021 to the present you only arrive at 1,640 to 1,680 deaths or with corona for the 0-65 group. The figures up to 1 January 2022 are exact, extrapolated from that moment on taking into account that 7% (no longer 8) of deaths are younger than 65 and the total number of deaths from or with corona at RIVM (which are known to date) is a factor of 3 lower than at CBS.
In short, your story still makes sense!
I had estimated that 8% to be more than (i.e. 'safe') based on this page
On the same page, 22,598 Covid deaths were reported.
If the message had been: CBS reports more excess mortality than Covid deaths in 2022, that doesn't say much. After all, that excess mortality also includes covid deaths. It is complicated to explain that excess mortality should be lower.
Hi Anton,
You might find this thread interesting:
https://mobile.twitter.com/orwell2022/status/1566891121103478790
I am not statically educated myself, but perhaps this is interesting for you to consider.
The crux of his argument is that excess mortality is due to 'the corona measures', not vaccination.
MVG
Stijn Hotels
I do not believe that there is only one cause for the excess mortality. The disruption of society is undoubtedly an important driver of this. Even if vaccination had only contributed 20% to this, it would still be a medical blunder of the first order.

Furthermore, he uses Sweden as proof that it cannot be vaccination. However, Sweden is not that undiscussed. There is hardly any undermortality. After the first wave, there was no time for that, then the second wave came. But after that?
Perhaps it is an idea to estimate what the share of vaccinations would be based on Sweden. Orwell insists that there is nothing wrong in Sweden in terms of excess mortality. With a longer-term analysis, I suspect that there is something to be said about that, see picture. He is very firm, I am less so, which is sometimes a bit difficult to talk to. (And I don't like Twitter very much anyway.)