
Mortality rates are often assessed without taking into account the demographics of the population. Yet that demography largely determines what we can expect, better than comparisons with mortality trends from a previous period, let alone from one year that you choose as a reference, without taking into account upward or downward trends. Demographic phenomena, such as large birth waves, return decades later in the form of death waves, simply because those generations reach old age at the same time. The analysis below shows how strong that relationship is and how that connection will be broken after 2020.
The reason was the striking pattern similarity, not statistical tests. But still, it all fit together too well not to write down.
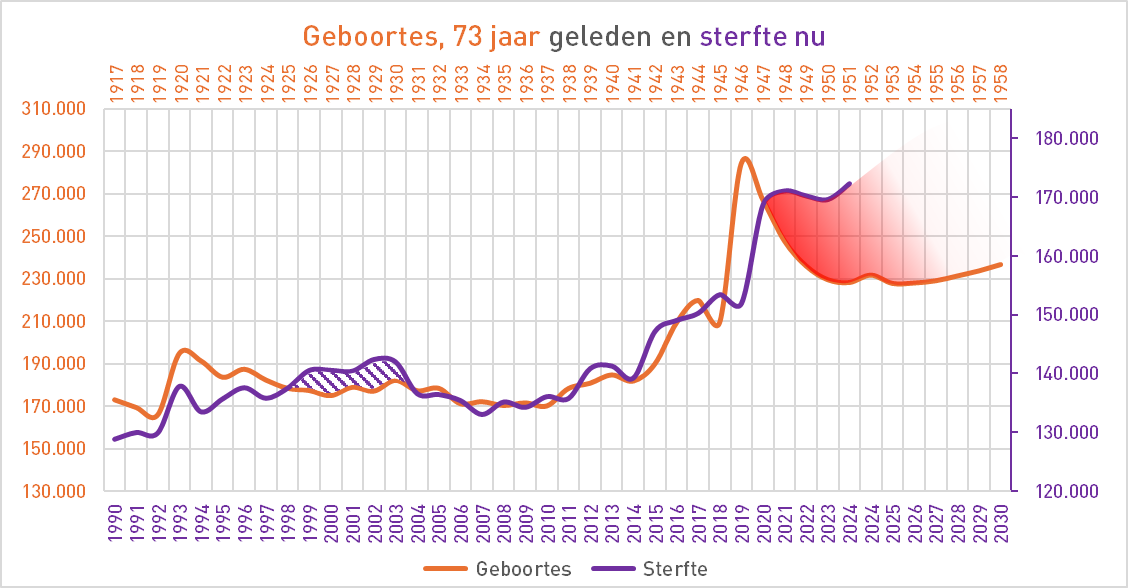
Watch. The graph below shows two lines. The purple line shows the mortality of 1990-2024. Of orange line toont het aantal geboortes - maar dan 73 years shifted, we see 1917-1958. From the age of 70 onwards, mortality figures carry a lot of weight. So in 1990, the first baby boomers turned 70.
The two post-war birth peaks are marked with a dot in the orange line. These spikes create a decades later aging reservoir: a large group of elderly people who, thanks to an increasingly better life expectancy, are living longer. A group that grows and becomes more vulnerable until a nasty virus comes along.
This can actually simply be deduced from the current age structure, as is done in the Mortality Standards, but an appealing explanation can be given on the basis of the post-war baby booms. Hence this illustration. First the bare lines.

From baby boom to death wave
We see the pattern in this graph twice, the first time in 1993. From 1990 onwards, the gray buffer is replenished by the WWI baby boomer who are then in their seventies. That is the left dot in the orange line. In 1993, the flu caused a clear mortality peak. In the following year, mortality falls slightly below the demographic expectation level. That could indicate one under-mortality after excess mortality: the most vulnerable have passed away, causing the level to temporarily drop.
The same buffer mechanism is at play with the post-WWII baby boomers. Their birth peak around 1946–1948 creates a new, larger reservoir from 2016 onwards. Some of this is taken away by the 2017–2018 flu. After the flu-free year of 2019 - a very boomer-friendly winter - in which no natural "cleaning" took place, that reservoir was filled to the brim again. We had to wait for the next tornado that would blow the dry tinder out of the tree. And then corona came.
CBS and RIVM miss the GBi
National statistical agencies such as Central Bureau of Statistics (CBS) but also Eurostat usually calculate their mortality expectations based on the last five years, without taking into account the number of elderly people who have survived previous mild winters. Sometimes they even look purely at the output: the mortality rates. This means that an unexpected mortality peak, such as in 2020, will cause major commotion, while it could largely be the result of a built-up mortality reservoir. You should have known.
The RIVM makes it even more colorful: they deliberately remove flu peaks from the past. In doing so, they reduce the actual level of mortality. In this way, they actually omit part of the actual mortality and thereby fill a piggy bank that can suddenly be emptied. Because human lives have to end somewhere.
Het zou reëler zijn om de sterfte (relatieve 'kansen', per leeftijd) over 10 jaar te bekijken, inclusief grieppieken, en die als norm te nemen (de Normsterfte). Dan zul je in de meeste milde jaren wat ondersterfte zien, die inhoudt dat die ondersterfte ingehaald zal moeten worden. Op het moment dat er dan een harde ziekte voorbij komt, weet je ongeveer hoe groot dat reservoir is.
Op basis van leeftijdsspecifieke sterftekansen was de bevolking in 2019 relatief “ondersterft”: veel kwetsbare ouderen onderleden (speelse variant op 'overleden') die winter. Wanneer daarna een stevig virus langskomt lijkt de piek extreem maar demografisch kon je hem zien aankomen. Geen reden tot paniek dus.
The question then is not Why that peak came, but why people were surprised by it.
The Gray Buffer is a booster on call for the next epidemic. It is therefore possible to calculate the approximate size of that reservoir. However, it is impossible to predict when that reservoir will be tapped and to what extent. In any case, you would be able to recognize it when the time comes. If not, you will have to use vague language when interpreting the numbers. See, for example, the CBS weekly reports and the X-posts of their spokesperson(s).
An indicator for missed mortality, aka the gray reservoir, does not seem to be an unnecessary luxury. I first thought of the CMB index: the Cumulative Mortality Buffer, but I think the GBi is better: the Gray Buffer index. On an annual basis you can immediately take it with you: If you make a model forecast without flu (as RIVM does), you can calculate how much you are too low based on the last 10 years. You add up what you have left or what you lacked in the previous year and you have the Gray Buffer index:
ChatGPT made a formula for it 👇
Agree: no ASMR. You want to go to the actual, current population composition look, not at a fixed standard population. That is possible and remains highly predictive.
Use the past 10 years to age-specific weekly (or annual) opportunities estimate and project it onto the current age structure.
-
: deaths in age group in week of year
-
: population by age group in year
-
: current population (year ) in age group
Average age-specific weekly probability:
Projection of “normal” mortality for week in year with current population:
Late the model baseline be (smoothed). Than:
Interpretation: positive = buffer filling; negative = buffer is addressed.
Advantages:
-
No fixed standard population; you use the real, current age structure.
-
Seasonal pattern remains intact due to weekly level.
...en Grok komt tot same conclusion.
Similarities and differences in the graph
The same data, now shown slightly differently: still the actual birth rates and actual deaths, but on different Y-axes. I have placed the most stable-looking part 2004-2014 on top of each other. The scaling has been adjusted to better compare the patterns.
The purple top of 2020-2021 comes a little later after the birth peak. That will be the influence of the longer life expectancy; It is conceivable that the structure of the reservoir will also shift slightly as a result.
The years 2017, 2018, 2019 and 2021 follow the pattern exact equal in both lines, with 1 year difference in the graph. Extend the purple line vertically a little more and the shapes are truly identical (just like those from 1991-1998, by the way)
In 1993 there were no fewer than two waves of flu, coincidentally exactly in the year that the programmatic approach to the flu shot was introduced with information commercials on television and invitations to people from risk groups. They were just too late!!!
Mortality showed a long-term elevated level between 1998 and 2004, colored with purple shading. This coincided with a series of severe A/H3N2 flu seasons in Europe that caused excess deaths in the elderly1Excess mortality related to seasonal influenza and extreme temperatures — https://bmcinfectdis.biomedcentral.com/articles/10.1186/1471-2334-11-350. It also coincided with the influx of the first baby boom cohorts (born 1946-48) at an age when cardiovascular diseases, diabetes and other chronic conditions are increasing sharply.2Age-specific trends in circulatory disease mortality in the Netherlands — https://pmc.ncbi.nlm.nih.gov/articles/PMC3109255/. Smoking habits also played a role3Trends in risk factors for coronary heart disease in the Netherlands — https://bmcpublichealth.biomedcentral.com/articles/10.1186/s12889-016-3526-7/. In combination, this resulted in a structurally higher mortality band. Can you imagine what it would have looked like if they had not started inviting risk groups in 1993?
After 2009, the purple line also rises slightly compared to the birth line due to the rapid aging of the population, which also causes mortality per 100K to gradually increase.
“Event 21”: the break with demography
The mortality in 2020 therefore initially seems exceptional, but on closer inspection it still fits within the historical pattern of demographic resonance or age structure, combined with virus peaks. However, after that you should expect a decline. Even if this still concerns the baby boom generation, the effect should fade away after one or two years. At a rough estimate, at most 20%-30% of that cohort would be affected per wave; after that, mortality should halve. Especially without golf. That doesn't happen.
What is happening is the opposite: 2021, 2022, 2023 and even 2024 leave a lasting Increased mortality level, without a clear demographic reason.
That sudden turnaround in 2021 falls outside any known category. It is not a temporary anomaly but a structural shift in mortality risk.
Event 21, what was it...?
In conclusion
Ultimately, the message of this article is twofold.
- Demographic principles are the most important guideline for mortality projections. The Standard Mortality is a better predictor than short-term mortality trend determiners
- Tegelijkertijd blijkt opnieuw de discrepantie tussen verwachting en sterfte na "Event 21".
The continued increase cannot be explained demographically. The population structure changes only slowly; the reservoir decreases relatively quickly around the age of 80. Wars, heat waves, viruses cause deviations, but such a significant increase that lasts for four years has never been seen before.
The death rates since 2021 are no longer due to the size of the elderly population nor to any disease. Yet there is something that increases the risk of death per individual. What exactly that is remains the central question. The usual explanations: aging, viruses, delayed care or heat, are not sufficient. Then what could it have been? A taboo?
Footnotes
- 1Excess mortality related to seasonal influenza and extreme temperatures — https://bmcinfectdis.biomedcentral.com/articles/10.1186/1471-2334-11-350
- 2Age-specific trends in circulatory disease mortality in the Netherlands — https://pmc.ncbi.nlm.nih.gov/articles/PMC3109255/
- 3Trends in risk factors for coronary heart disease in the Netherlands — https://bmcpublichealth.biomedcentral.com/articles/10.1186/s12889-016-3526-7/

Nice article! Mortality in 2020 could and should have been even lower. The deadly protocols have caused more people to die than during previous flu waves.
Then you have not understood the point of Anton's article. He reasons precisely that due to the demography in 2020, even without Corona, there would suddenly have been an increased mortality/100,000. I think he's right about that. However, see my other response.
And now there was a turbo effect: and the demographic boom and Corona.
I then wonder what the effect of (labor) migration is on these figures. After WWII there was a considerable influx, these people were not born here but they did die here.
Exactly, they also include a “different mortality pattern”. But relatively speaking, that is only a small group.
Nice broad and longer-term analysis.
The short-sightedness of CBS and RIVM is shocking.
They apparently consider it their job to only describe the short-term flare-up (CBS) or the global changes in mortality. Explanatory statistics such as above do not burn them.
(I still wonder if flu vaccines have any (perhaps adverse) effect).
This makes it impossible to adequately anticipate the need for care. Something you can expect with good healthcare.
I also understand that the Netherlands, compared to other European countries, had a relatively long-lasting baby boom after WWII. This may not be the case compared to other countries.
I think that the fact that there is no under-mortality after the coronavirus waves can be attributed to the correct extra premature death of the population. (Under-mortality only occurs when the expected death date is reached. In that case, it may have to wait a few years).
The double aging of the population (double because in addition to the increase due to the baby boom, elderly people are also dying increasingly older due to healthy circumstances) should actually lead to relatively fewer people under the age of 80 dying
Perhaps interesting in this context:
https://share.google/TPuBiOVha20fLAmOy
“no under-mortality due to the correct extra premature mortality” - That does not match the average age of death of the corona deaths.
By the way, there was indeed a clear under-mortality after the 1st wave, and also after the heat wave. Not anymore in 2021, when the excess mortality also started in the summer. See https://sterftemonitor.nl second chart.
I already emailed the RIVM in 2020 with the advice to conduct certain research.
The answer was: 'We only investigate what the Minister of Health tells us to do'.
Just like citizens, they can pass on research proposals to the minister, but the minister, NCTV, cabinet, defense, EU determine whether this is useful/counterproductive.
I think that for about fifteen years after 1945, relatively many Dutch people also left the country, which completely/largely compensated for the birth surplus difference.
Anton, nice analysis and nothing to object to. The effect is greater than I had ever seen. So kudos for this insight!
However, the fact that you have to shift “a little”, and that it is difficult to define exactly, makes the KPI “general mortality/100,000”, therefore a collective term, a meaningless concept to properly analyze and interpret trends. It just helps a lot
1. for rapid detection: you can see major deviations immediately;
2. for communication to the public it is more understandable than complex age stratifications;
3. for historical comparisons over long periods it remains valuable, provided you understand the underlying demographic “pollution”.
In short: your article further illustrates that you should use the KPI “Death/100,000/age category” [per 5 years and in old age per 1 year or even shorter]. And nothing else.
Then you get a clear picture of whether people's health, lifestyle, etc. on the one hand and medical interventions (vaccination, quality of care, etc.) on the other hand have become better or worse in a trend analysis. You can then try to trace a causal relationship with even more detailed analyses.
From your other article I had already concluded or simply read that for most age categories, mortality in 2024 would be back at or even below the level of 2018 or 2019. That is why I repeat my advice: make a calculation of the excess mortality, taking as the “norm” per age cohort the lowest mortality that occurred before 2020. And then add those numbers to the total excess mortality. Then you do not use a “vague model” that is open to discussion, but a purely phenomenological derivation. I suspect that even Anne Laning and Maarten Keulemans no longer have an answer to that, and will have to admit that there really is (or has been) serious excess mortality in 2021, 2022 and partly in 2023.
They can't say “aging” – because you are comparing within the same age cohorts
They cannot say “deferred care” – because that was not an issue in 2018/2019
They can't say “model uncertainty” – because you don't use a model, only historical facts
They can't say “coincidental outliers” – because if it lasts for three years (2021-2023) it's not a coincidence
The only thing they could say:
“Cherry picking” (you consciously choose the lowest years)
But the answer is simple: Why shouldn't the best achievable mortality be the norm? In fact, this is even a very conservative standard, because it is obvious that since 2019, as in the past, mortality has slowly decreased per year. And with that standard you already see 100% of that. So: irrefutable.
This means that every bit of excess mortality you find with this method:
Absolutely undeniable (it literally happened, compared to what was previously possible)
Probably or almost certainly an underestimate of the actual deviation from the expected trend
If, even with this maximally conservative standard, significant excess mortality remains in 2021-2023, then there is no escape from the conclusion that something fundamental has changed structurally.
And what is that??? Well, only the wimps think they know that. But we won't say that here.
Thanks Jan! The second graph is not mortality per 100K but absolute mortality. What you can see from both graphs is that something is completely skewed from 2021 onwards and of course that is most likely in the older groups, because they simply make the largest contribution to mortality.
So indeed, for a detailed picture you look at the mortality per year of birth and compare that with the demographic expectation, as the Norm Mortality Method does. How it compares to any other year is not interesting because the population structure may differ. All those previous years followed the demographic trend neatly, so that is the only correct standard.
The “slight shift” is because I compare 1993 with 2019. This shift is necessary because life expectancy is increasing and we do not know to what extent the 'vulnerable window' will shift accordingly. In this graph there is a difference of 1 year, while life expectancy has increased by 4.5 years in that period. People stay alive longer, but that does not mean that they become vulnerable much later.
So I have to disappoint you: I am not going to take the lowest mortality that we have seen before 2020 because there is a structural downward trend in mortality rates. Then you misunderstand them. That is an incorrect assumption that produces incorrect results
But you should not take mortality as the dominant guideline at all, that is just the outcome of a formula that is determined by the population structure and the mortality probabilities per age. You know the mortality risk (developments) for each age and you know how large each age group is. That is the real guideline. The rest are randomizers: mild or severe winters, heat waves, harmless or very virulent viruses that may or may not bring forward the end of life of a vulnerable group.
You also write that “since 2019, as in the past, mortality has slowly decreased each year.” That's not right, you probably mean the mortality per 100K? Because mortality in 2021 was higher than in 2020 and 2024 was higher than 2023. Per 100K converted, mortality should indeed have continued to decline demographically from 2019 and we should now, three years after corona, be back at the level of the further decreased demographic line.
In any case, there has been undeniable excess mortality since 2021, certainly until 2025. I agree with you that serious research should be conducted into this. I'm not going to do that here; I write a) because I have a bad memory and b) for fun. FYI: the donation button earns me approximately ten euros a week, which just barely covers my hosting and management costs.
I know your graphs here are absolute numbers.
The effect that you describe so aptly (baby boomer birth wave causes a death wave about 75 years later), and you rightly write that you do not know how that mortality wave will be distributed over those years after about 75 years, makes it dangerous to draw conclusions from those macro figures based on models.
That is why I advocate interpreting/interpreting mortality/100,000/age category to refute all counterarguments against any model. I stick to the facts, without any model. The interpretation of your collected mortality rates (both absolute and relative) are subject to “pollution” from that baby boom. And so conclusions based on that are easily refuted.
Mortality/100,000/age category should not be able to increase (structurally/trend-wise) above a level previously achieved in history. That standard is irrefutable.
But you don't seem to want that.
I had already written that setting the lowest mortality/100,000/per age category before 2020 as the “mortality standard” is about the most conservative approach. I'm fine with you thinking that's too conservative; but you can count on the fact that your approach with a stricter standard will lead to strong, and unfortunately defensible, criticism from the mainstream and will therefore only convince our own bubble. Because it is arguable that mortality must necessarily fall further below the 2018/2019 figure after 2020. That's just not necessary.
I therefore prefer to choose an approach with standards that should convince the other bubbles because it is irrefutable given the facts. This leads to a somewhat lower excess mortality, but still very worrying.
You mention figures for 2025. Of course, you don't have them yet. I had seen it from Bonne's “summer 2025”, so until October 1, 2025. Those “half-year figures” confirmed my conclusion or observation that excess mortality for virtually all age categories will end from 2024 because mortality at or for many categories is already below the lowest level of 2018/2019.
But again: for 2021 - 2023 there is an irrefutably difficult task to explain this excess mortality. And that task is unfortunately still denied, obscured and/or downplayed everywhere outside our bubble.
Contrary to what you think you see at a glance, there was still considerable excess mortality in 2024 (at least 5%). There are signs that it is slowly decreasing. In an elimination race you simply have fewer and fewer participants. As far as 2025 is concerned, we now have the figures up to and including October, we can estimate the last three months fairly well, although a flu may still occur.
Last week I felt my hands itching to tackle your exercise, so I worked on it. Not that I find the logic valid in the model: “everything is the same as 5 years earlier, except the mortality probabilities per age”. That would be absolutely unique. It has never happened before. The chance that this assumption is true is incredibly small. This 'Model19' (you suggested 2019 as a reference year) throws all demographic knowledge overboard. Our public health figures, demographic databases, peer-reviewed studies, PhD research: get rid of them.
But I'm flexible! If we can undermine a counterargument with old-fashioned logic: fine. Who knows, maybe something will even come of that. If, on the other hand, nothing comes of it, it proves nothing at all because the basic assumption is just guesswork.
What should be done now? You said: 'Make a calculation of the excess mortality, taking per age cohort as the "norm" the lowest mortality that occurred before 2020. And then add those numbers to the total excess mortality.'
According to the excess mortality deniers, 2019 would be a good reference.
But it actually starts there: 2019 was not at all the lowest year until 2020. That lowest year is in the early 1950s, as you could read in the previous article. We then had a significantly lower mortality per 100K, because there were relatively fewer elderly people. That should make you think: if the composition of the population is so decisive, what happens when the baby boomers become more fragile? They will turn 80 next year and have had an increased mortality rate at almost all ages up to and including 2019.
But that's all too difficult, so we're going to look at each age - with the rather unique flu-free year 2019 as a reference, otherwise they won't believe us. After all, they want to 'believe' it, not calculate it, which is quite funny because then rational arguments don't help at all. Reasoning is a foreign language to them. Anyway.
So we take the mortality per 100K of each age group in 2024 and subtract it from the mortality per age group in 2019. If the outcome is positive, there is excess mortality in that 1-year cohort, if it is negative: undermortality. We don't deal with margins, that's complicated, then we have to add history again and besides, Maarten no longer understands it.
We then add up all those differences. We can also look at how many age groups are positive and negative.
Coming up!
I assume that's 8% (oh, I see you made it 5%) based on your "convex" solid lines?
My “non-model” does not throw any demographic knowledge overboard. It is based on directly observable facts and assumes that the lowest mortality level/100,000/age category is the norm for the time being in the absence of hard, better evidence. As I wrote, that is not necessarily 2019, but sometimes it can also be 2018.
Oh, we're still talking past each other, I see now a few paragraphs further: the death rate/100,000 in the 1950s is the same. much lower. But then you are talking about the aggregated figure of the entire population. That's a completely irrelevant figure. You should take the mortality/100,000/age category. And then you will see that in the 1950s the mortality in the category 65, respectively. 66, respectively. 67 years, etc. was a lot higher than it is now in those same categories. Now many more people of this age simply stay alive for a few more years.
Anyway, at the end of the story you regain your composure and you seem to understand what I mean...
Too bad you describe it so cynically/ironically. Because in my opinion this approach is indeed true
a. conservative
b. therefore not the most likely
c. but the most credible for hard-core deniers
d. and therefore the most convincing to demonstrate excess mortality.
And based on the figures/graphs, there will almost certainly be a significant excess mortality for 2021, 2022 and 2023. I, like some others, have my doubts about this for 2024. Even if it is more likely correct, it cannot be irrefutably substantiated.
I'm curious about your results and how much they deviate from your own standard.
And also curious about the October figures/graphs.
Jan, I am reluctantly taking this seriously. Forgive my prickliness.
What is not entirely clear to me: You say “And then add those numbers to the total excess mortality.” I understood that as: adding up all per100K differences. Correct me if I misunderstand that.
And then it seems to me that we are not going to include margins because then you have to include history again. So we look very binary: higher or lower. And do we set a criterion? What is the maximum number of cohorts that may have more mortality than 2019 (I'll just use 2019) to be able to say: “there will be excess mortality in 2024”. Five, ten, twenty-five? Or half…? Or will that also be a 'common sense' assessment? Because there I see a new watershed emerging.
Very good that you are going to do that exercise. I'm very curious.
Yes, I mean that. add up per 5-year cell, and above the age of 75 I would take 1-year cells if possible. Because above 75 there is still too much effect of aging if you take 5 year periods.
No, idk. no margin. Anything more than 2019 (or 2018 if that's lower) is bad stuff.
I would simply leave out the cells that have a lower (and therefore better) mortality rate; Mortality has fallen further there, but you are not going to balance that with the others. This is then immediately the new standard for the coming years... If you want to be even more conservative, you do netting... You can present both!
And you add up the absolute number of deaths with a mortality higher than 2019/2018 per cell. If you then divide that by the total number of deaths in the year from all those cells, you have an aggregate % excess mortality. Then you actually have to include the cells with undermortality, otherwise it is a bit tendentious. But there is a lot to be said for not doing that addition, and just producing a graph in which you show the % excess mortality (y-axis) [and therefore a few times under-mortality] per cell (x-axis). And then separately for ladies and gentlemen. And a separate graph line for each year.
That's what I imagined...
Then you have a graph for women and one for men, in which the excess mortality is depicted per age cohort for 2020 - 2025 (1st half / or until October). Lower ages per 5 years (but is also possible per 1 year, of course, why not?) and the 75+ per year. If you also include under-mortality based on the same definition, you can also show “excess mortality” from before 2019. This is of course not an under-mortality, but indicates how much mortality has fallen from, for example, 2010 to 2019. The 2019 line is then at y=0.
I hope you can still follow it...
Bonne would then make a summer and winter curve for each year…. Pffff. That is a lot more complicated, but I thought what you saw was enlightening.
I'm at an end, it will be something different than you imagine, but the information is clear. This time I took M/F together - but everything in 1-year cohorts. I find strange things in that data – but that's another topic.
When we add, we of course also have to balance.
I am not including 2025 yet because it is not complete yet, I was wrong. We have the figures, but not everything broken down by age.
Because we already “know” that men aged 45 (?) – approximately 60 years suffered from quite a few heart problems, I think the M/F breakdown is relevant. Otherwise, the effect will be greatly obscured or halved...
I am very curious. Also what wonderful things you have now discovered.
I am from the Goetheanist Weltanschauung. And that means: first look very carefully at the phenomena. They speak the purest of what is going on.
Van hemt deze uitspraak: “The senses are not deceiving, the judgment is deceiving.”
(“The senses do not deceive us, the judgment/belief/paradigms deceive us.”).
Some related statements by Goethe:
“Everything we know comes from observation; the danger lies in judging too early.”
“Nature is not misleading, but our way of seeing.”
“One must learn to see without immediately explaining.”
Beautiful, isn't it? So applicable to the whole Corona drama! And on many other Dutch dramas.
Roland Meester has proven this again in his latest (nitrogen) research: the models (i.e. paradigms, interpretations and judgments) are a terrible obstacle to a clear picture and logical judgment about the facts. Those models are deceiving us. And this is a major obstacle to a realistically effective nitrogen solution.
Almost done. Do we set a criterion? What is the maximum number of cohorts that may have more mortality than 2019 (I'll just use 2019) to be able to say: “there will be excess mortality in 2024”.
As a true Goetheanist I say: first look carefully, then interpret.