
On Public health care.info Covid-19 is presented as the number 1 cause of death in 2020. In this article, I argue that this is unjustified and I do so on the basis of the CBS report. The big question is therefore whether the choices that politicians do and do not make with regard to our national public health are justified on the basis of this ranking and interpretations?
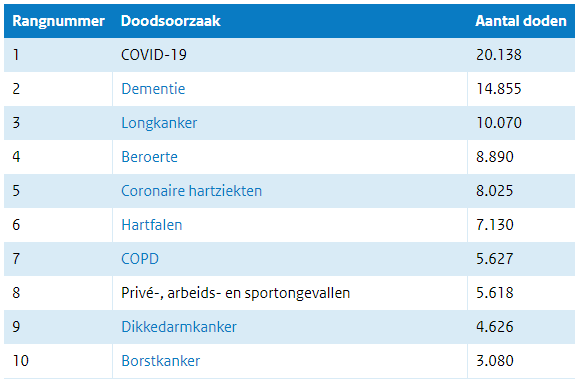
According to the government, the top 10 causes of death (2020) are as follows:
For years (since 1899!) people have been accurately mapped out what causes people to die. It CBS for causes of death Main groups (e.g. cardiovascular diseases), which are then subdivided into Specified subgroups (for example, cardiac arrest).
From WHO determines how this system is classified, in order to provide the data on causes of death worldwide to be able to compare and interpret with each other. The main and subgroups correspond to the main cause of death and the underlying cause of death at the so-called B-form. When someone dies, a physician fills in a B form stating the main cause of death and the underlying cause of death and CBS processes this data into mortality figures and statistics. The doctor on duty fills in what seems most likely to him at that moment.
For 2020, a new main group has been introduced into this system: Covid-19. Although no other disease is a separate main group (but ALL THE TIME falls under a subgroup), the WHO has decided that Covid-19 is an exception to this. However, it would have made much more sense to include Covid-19 in the main group of Infectious and Parasitic Diseases or Diseases of the Respiratory System and then the cause of death statistics would have looked different.
If Covid-19 had been placed under "Respiratory system", only places three and four (Mental disorders and Respiratory system) would have been reversed. Was that perhaps too little justification for the draconian regime and the unexpected vaccination campaigns?
| Ordinal number | Cause of death | Number of deaths |
|---|---|---|
| 1 | Neoplasms (cancer) | 47.046 |
| 2 | Cardiovascular system | 36.579 |
| 3 | Respiratory system | 30.633 |
| 4 | Mental disorders/behavioral diseases | 11.674 |
| 5 | External causes | 9.026 |
| 6 | Nervous system diseases | 8.356 |
| 7 | Abnormal clinical findings and laboratory results not elsewhere classified | 7.835 |
| 8 | Digestive system | 4.874 |
| 9 | Endocrine disease | 3.640 |
Comparison in main groups
All previous years there are always for overviews/rankings Main groups only and they always came up with a fairly stable picture with cancer as the number 1 cause of death. Cancer is now split into Cancer subgroups, which are all lower in the ranking so that Covid can rise some places. Had the government used the familiar method of comparing main groups, the ranking would have looked like this (albeit with Covid-19 as the odd one out):
| Ordinal number | Cause of death | Number of deaths |
|---|---|---|
| 1 | Neoplasms (cancer) | 47.046 |
| 2 | Cardiovascular system | 36.579 |
| 3 | Covid-19 | 20.138 |
| 4 | Mental disorders/behavioral diseases | 11.674 |
| 5 | Respiratory system | 10.495 |
| 6 | External causes | 9.026 |
| 7 | Nervous system diseases | 8.356 |
| 8 | Abnormal clinical findings and laboratory results not elsewhere classified | 7.835 |
| 9 | Digestive system | 4.874 |
| 10 | Endocrine disease | 3.640 |
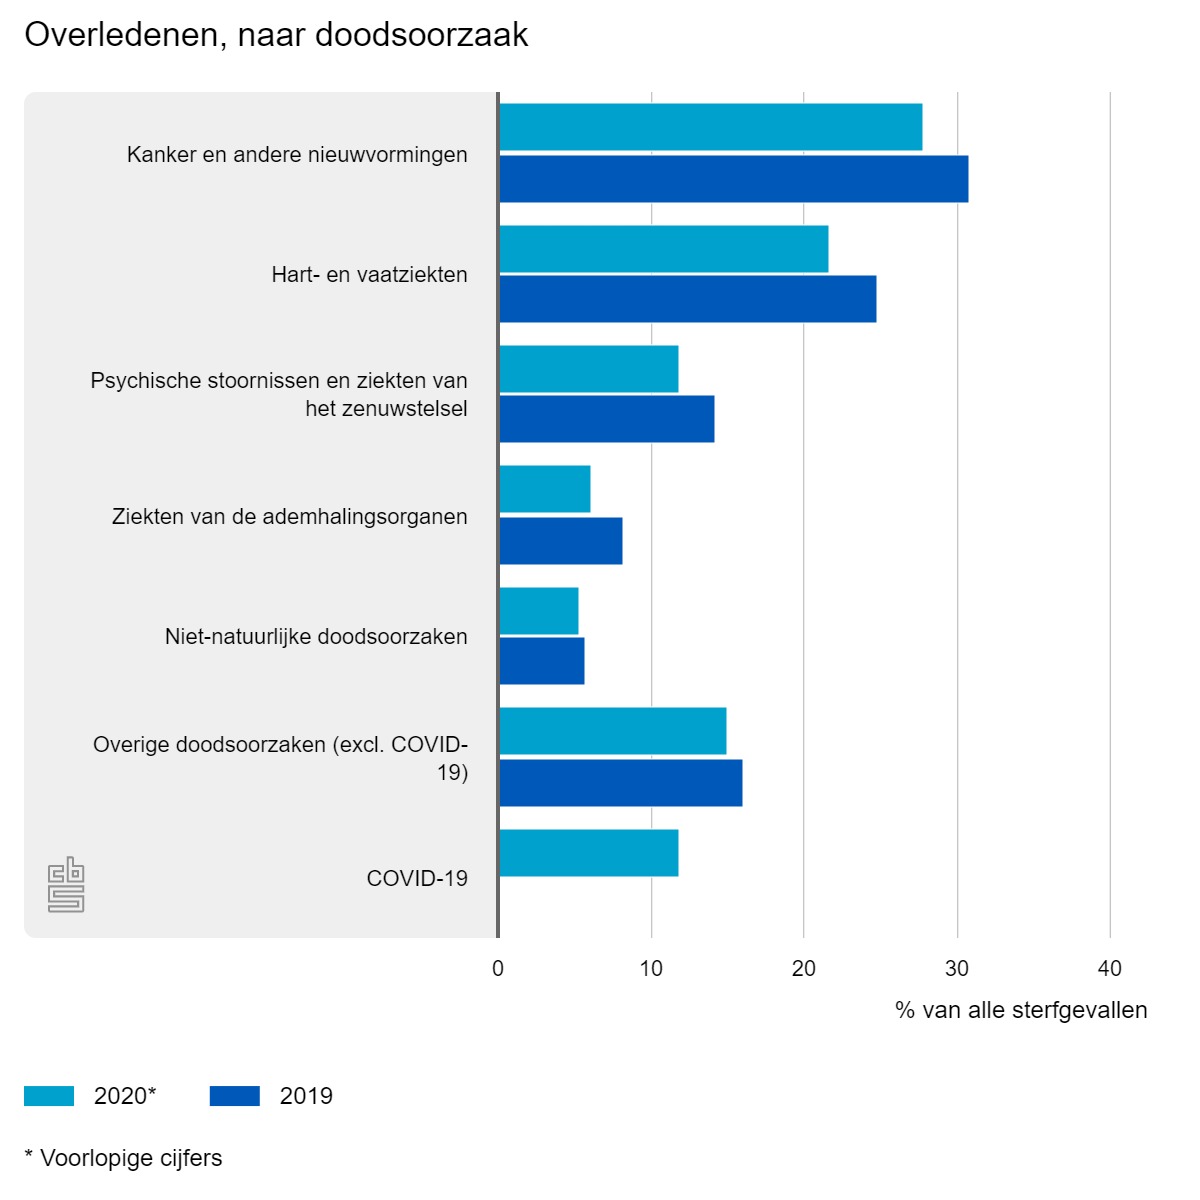
This (alternative) ranking – in contrast to the ranking of the central government – is in any case well corresponds to the bar chart presented by Statistics Netherlands. CBS has chosen to merge 2 main groups, namely Mental disorders and Diseases of the nervous system, together comparable to Covid-19 in terms of mortality rate.
It now seems as if the arrival of Covid has pushed out other causes of death. Percentage-wise that is correct because 100 percent can only be divided 1x and if a new category is added, the rest goes down a bit, that's clear. Whether this is the case in reality, you can see from the absolute numbers. First, a graph. The dotted lines are the trend lines, based on the past 10 years. They indicate what 2020 would have ended up with if the trend had continued. The dots represent the actual figures for 2020. Most of the dots are below the trend line of the same color. How much they differ is shown in the table below.

Except for the endocrine diseases (endocrine system), all diseases are lower than expected, some more than 15% lower even, which is an unprecedented abnormality.
| Difference absolutely | Compared to Trend | |
| Total psychological disturbance./dr.. | -2.611,0 | -18,3% |
| Total seeks. respiratory system | -2.165,6 | -17,1% |
| Total diseases of the nervous system | -1.499,1 | -15,2% |
| Total seeks. cardiovascular system | -1.352,3 | -3,6% |
| Total infective/parasitic a.. | -681,6 | -18,7% |
| Total new formations | -639,1 | -1,3% |
| Total external causes seek. And mortality V01-V98 | -118,5 | -1,3% |
| Total blood and blood forms. | -2,6 | -0,5% |
| Total endocrine disease, nutrition. | 80,3 | 2,3% |
| Total COVID-19 (Coronavirus z.. | 20.138,0 |
If we add up all the main categories, we are talking about 8,989 deaths which would have been completely in line with expectations – but which have now suddenly not taken place. How is that possible? The diseases have not changed. Population development has also not broken the trend. We didn't suddenly start exercising more or pay more attention to our diet. It is unlikely that the measures have helped with this, although some would like to increase it.
One possibility is that these deaths have been recorded in a different category this year with the obvious candidate: Covid. That may of course be justified. If Covid brings a death forward by even one day or an hour, there may even be little to argue against. But even before that, there were doubts about deaths wrongly recorded as Covid. It just depends on how the B-Form is filled in and what guidelines were given. Hopefully that will be discussed in an evaluation.
Whether Covid was actually the decisive cause of all those deaths is a legitimate question given the figures. After all, without Covid, the trend line would have been roughly followed, so the deaths would have occurred just the same. Seen in this way, Covid may also have played the role of 'the final push' or 'the ferryman to eternity', just as flu has always been considered.
Parallel universe
Now let's assume that the figures had simply followed the trend. Those 8,989 deaths would have taken place as usual. Then they would not have been charged to Covid.
Covid mortality then remains: 20,138-8,989 = 11.149. That sounds very different from "twenty thousand".
Don't forget that this is actually the total of two flu seasons: 2019-2020 and (part of) 2020-2021. That is 5,600 per season. This is spacious under the average of flu seasons over the past five years (6,500).
Or is what I say not true...? Weren't it two seasons? Just checking on ourworldindata.org...

Other influences
The lockdowns and other measures will not have had any positive effects either. At least not on well-being and most likely not on the mortality rates either. This has been shown by various studies. That is probably impossible to determine, but without those effects, the various cause of death rates might have been even lower.
Presenting COVID as the number 1 cause of death is not in the interest of public health, if only because of the rights that advising doctors and government believe they can derive from it. For this purpose become categories shuffled, causes of death pulled apart and things presented more threatening than they really are.
N.B.: Presenting matters more seriously than they are is not in accordance with the Guidelines for Scientific Integrity, as can be read in an earlier comparison of the Guidelines for Scientific Integrity with the conduct of the RIVM.
(Thanks to MV for the inspiration)