
It is with the predictions of R-values as with the weather forecast. There is some complaining if at a certain moment the weather does not match the forecast, but otherwise that has no consequences. The weather continues to be predicted by the same forecasters. There are no quality requirements and we will have to make do with it because we have nothing better. But do weather forecasters adjust their weather reports afterwards in the direction of the actual measured weather?
Two weeks ago (week 17) I closed in this article with "And we'll remember this graph for two weeks from now. https://allecijfers.nl/nieuws/statistieken-over-het-corona-virus-en-covid19". That was this graph:
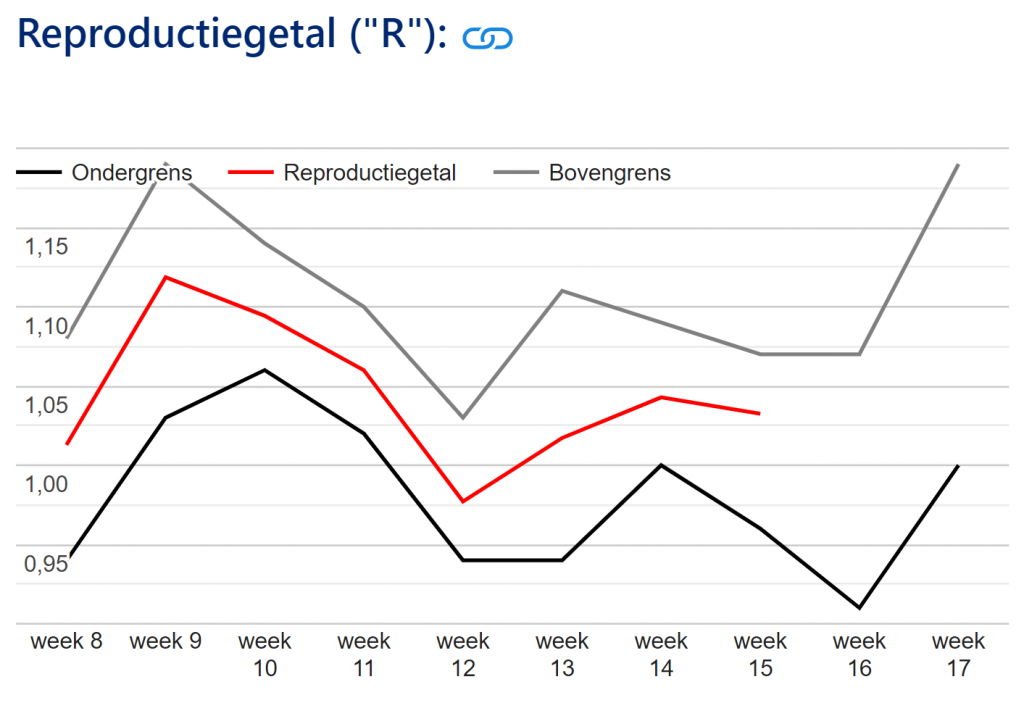
In the graph above from week 17, we see that the declining R-value (weeks 14-15) may have continued for another week, but should have risen quite steeply again in week 16. According to that expectation, infections are sky-high this week (19), hospitals are flooding... It looks really bad! Fourth wave?
Two weeks later – advancing insight
The graph shows margins of uncertainty: an upper and lower bound. That must be the margin of uncertainty of the last, fixed prediction. If we look at week 13, more than a month ago, we still see a difference of 0.15 between the possible lower and upper limits, while we now know better. The margin of uncertainty is therefore not adjusted after the hard calculation. In this graph, margin after the measurement moment is not smaller than before. Then you don't even have to measure... So it is the margin of the last predictive week. That's the nice thing about this view.
Seasonal influence on the forecasts – without aerosols?
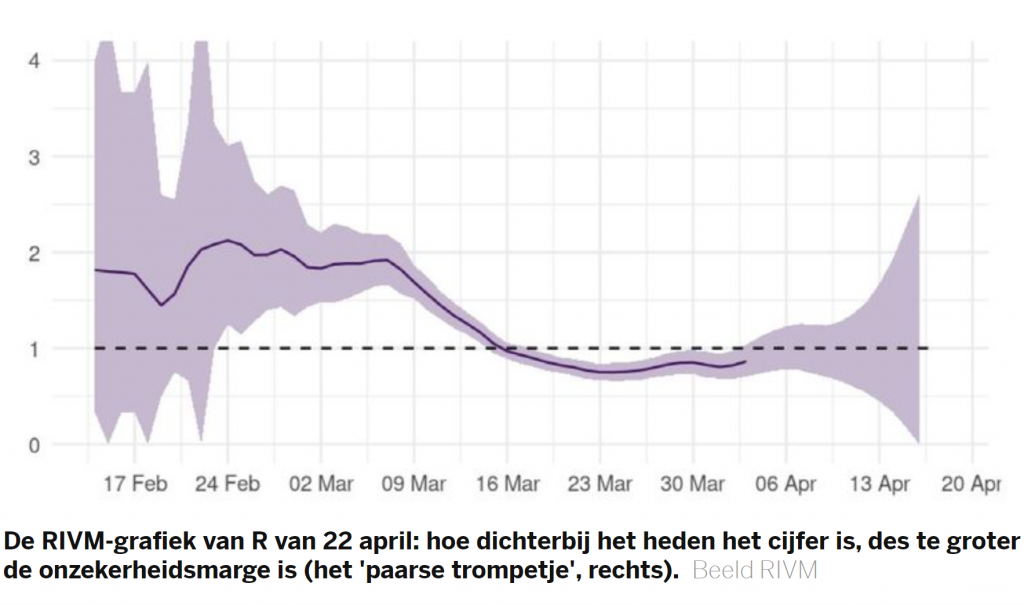
In other views, small corrections are less noticeable. Again, the colored margin indicates the uncertainty of what the last prediction must have been. If the admissions, ICU figures and mortality are known after a month from date, the R number can be made a lot harder. The fan then only widens at the end. So Maarten Keulemans is right here!*. The impeller at the beginning (thanks for the correction Rogier) is because there was no testing at that time. The virologists indicated on 17 February 2020 (R of 1.8) that an R of 4.1 could be taken into account a week later. That would have more than doubled. In the course of the R, we only see such jumps in the event of suspected measurement errors or malfunctions.
Back to today: week 19
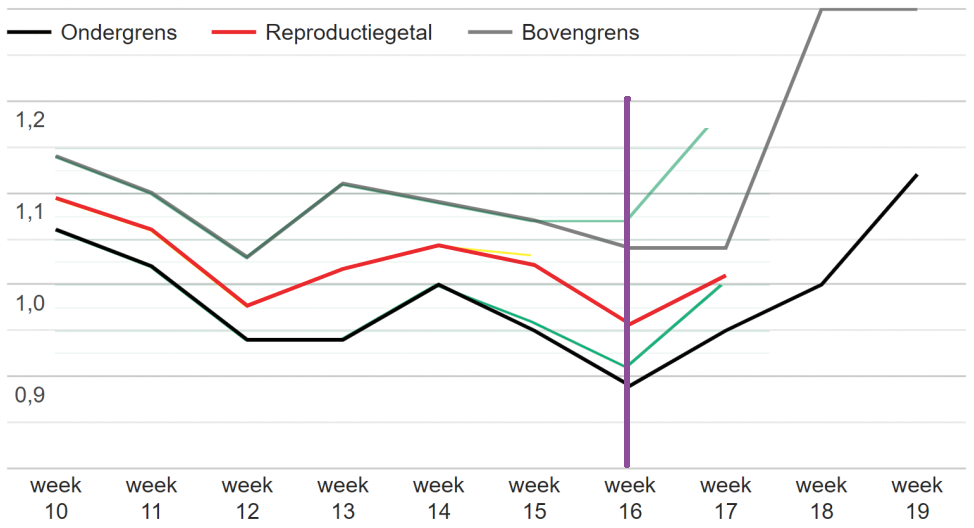
The fact that the margins are still being adjusted in the last week can be seen when you overlay the graphs. That makes sense: the closer the forecast, the more certain the forecast. If you overlay the two graphs, you can see that too.

Red/black/grey: R-values as shown in week 17.
Look, in two weeks the lower limit of week 17 went from 1 to 9.5. In retrospect - it was week 19 this week - predicted a little better than before. But after that it still looks very bad! Lower limit of 1.12 for week 19!! Oops oops, we just wait and see in the hope of strict measures!
The increase appears to have already started in week 16 (red)! Could that be because negative home testers do not go to the test street, making it seem as if more and more people are infected in the test street? Or does the RIVM have ICT problems? Better calculators estimate the R closer to 0.9 than to 1, which means that the last part of the red line should not actually go up.
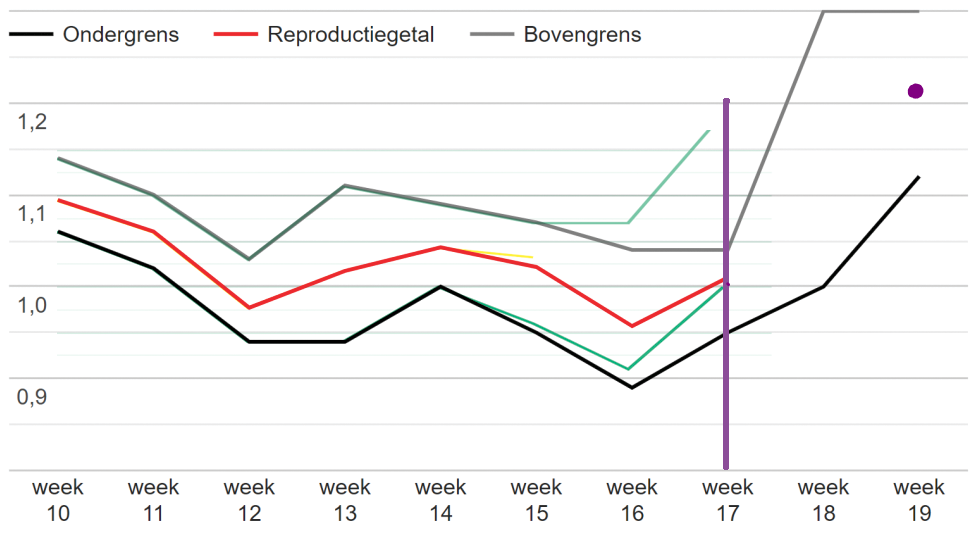
Red/black/grey: week 19
Let's look at the predicted lower limit of week 16, done in week 17: it was 0.92. That was the last weekly forecast. Two weeks later, that prediction appears to be afterwards so lowered to 0.89. In short, lines are drawn around the actual value, so that reality optically falls neatly within the margins drawn by RIVM. Only: those were not actually the exact predictions. Well okay, it's a small 'correction' so a knee-jerk reaction to that. The actual value (yellow) in week 15 has also been slightly corrected afterwards. That's possible. But you can't correct predictions afterwards. After all, then you have always been right afterwards. But then the following:
Red/black/grey: week 19
The R-value of week 17 (red) is, seen in week 19 (now), at the level that was seen as the lower limit two weeks ago (green). The predicted lower limit (black line) has therefore been adjusted significantly downwards. So after it has been determined, the forecast is adjusted again, I find it strange but I'll stop talking about it.
The upper limit (grey) has been adjusted downwards even more drastically. It is not clear where this lowering comes from because then it catapults steeply up again. Just moved it by hand for about a week maybe? It indicates a sudden huge trend break where you expect gradual movements. We are talking about large numbers. What happened last week? Did I miss carnival or something? The weather doesn't change towards winter either, it's May!
But take a quick look at that gray and black line in week 19: RIVM now estimates the R-value above 1.2 !! That is about the middle between the lower and upper limits. This increase started three weeks ago, in week 16. How does that fit in with the current state of affairs? After all, this should already be clearly visible in admission and ICU figures from RIVM.
Anyone 'with half a brain' can see that this super rise is an insane scenario that is appallingly wrong for the umpteenth time. Yet we remain in a (nota bene ineffective) lockdown grip with minimal relaxations. The cabinet and the House of Representatives are taking it for granted. All because seasonality is not understood and aerosols are ignored.
"We will see that the R-value will slowly decrease under the influence of the vaccinations"
Ernst Kuipers
No, Ernst: the R-value is collapsing rapidly under the influence of the weather and many people will start to wonder why they have already taken that vaccination and why they still have to test negative while they have that vaccination and the epidemic has clearly disappeared. Until autumn comes again and once again no leg has been lifted to improve the indoor climate or to scale up healthcare, which will have to cope more and more anyway because of the rapidly ageing population.
Aging leads to higher flu peaks because the spread of respiratory viruses is not moderated with ventilation.
"That R is going to tumble hard in the next two weeks until far below the lower limit now indicated, I put a carton of specialty beer on it."
Anton Theunissen
There is only one long-term solution that helps against all variants and future respiratory viruses: ventilation. To do this, the population must be informed about how they can protect themselves.
Indoor climate management and enforcement are needed (compare fire safety) and an amendment to the Building Decree. For five years now, we have allowed an average of 7,500 people to die prematurely. Just because no one knew or wanted to know how the virus was transmitted. The RIVM must replace, the journalists must be re-educated. If Rutte and de Jonge had been managed a bit more sensibly, they could have done quite a job.
* AH – that may be what my critics confuse with 'ad hominem' when they accuse me of using ad hominem arguments myself – which is actually a you-box, not a strong form of argumentation either. I often have to let it be known that I am allergic to the digging in the past of, for example, van Haga or Maurice, when people try to make something clear to me for which substantive arguments are clearly inadequate.
Substantive criticism is not possible without citing the source and if it is the same scientist or journalist who makes similar mistakes over and over again, that may also be mentioned.
Dat wil niet zeggen dat die journalist nooit meer iets goed kan zeggen en ik alles van hem bij voorbaat diskwalificeer – dát zou een echte ad hominem drogreden zijn.