
It is with the predictions of R-values as with the weather forecast. There is some complaining if at a certain moment the weather does not match the forecast, but otherwise that has no consequences. The weather continues to be predicted by the same forecasters. There are no quality requirements and we will have to make do with it because we have nothing better. But do weather forecasters adjust their weather reports afterwards in the direction of the actual measured weather?
Two weeks ago (week 17) I closed in this article af met "En deze grafiek onthouden we alvast even voor over twee weken. https://allecijfers.nl/nieuws/statistieken-over-het-corona-virus-en-covid19". Dat was deze grafiek:
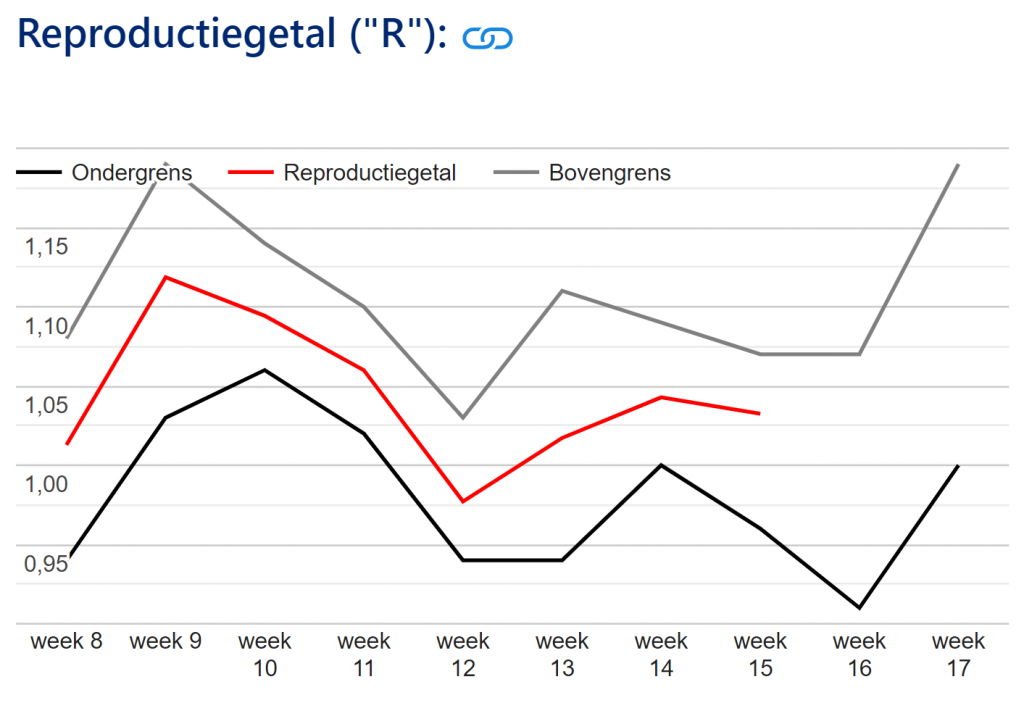
In bovenstaande grafiek uit week 17 zien we dat de neergaande R-waarde (week 14-15) mogelijk nog een week heeft aangehouden maar in week 16 weer vrij steil omhoog zou moeten zijn gegaan. Volgens die verwachting stijgen deze week (19) de besmettingen skyhigh, overstromen de ziekenhuizen... Het ziet er echt heel slecht uit hoor! Vierde golf?
Twee weken later - voortschrijdend inzicht
In de grafiek worden onzekerheidsmarges aangegeven: een boven- en ondergrens. Dat moet de onzekerheidsmarge zijn van de laatste, gefixeerde voorspelling. Kijken we naar week 13, ruim een maand geleden, dan zien we tussen de mogelijke onder- en bovengrens nog een verschil van 0,15 terwijl we intussen wel beter weten. De onzekerheidsmarge wordt na het harde berekenen dus niet aangepast. In deze grafiek is marge na het meetmoment niet kleiner dan ervoor. Dan hoef je eigenlijk niet eens te meten... Het is dus de marge van de laatste voorspellende week. Dat is het aardige van deze weergave.
Seizoensinvloed op de voorspellingen - zonder aerosolen?
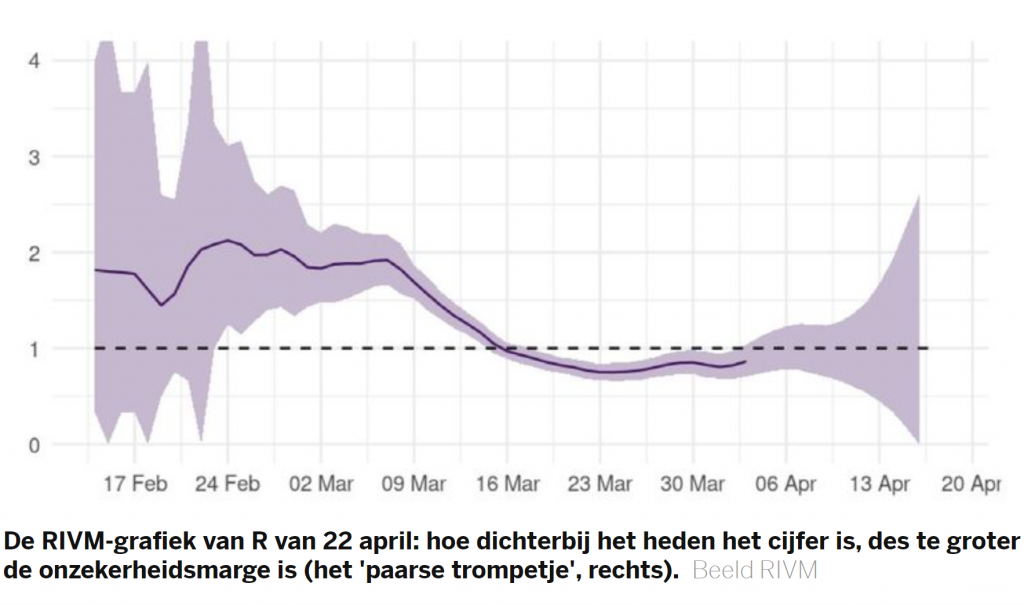
In other views, small corrections are less noticeable. Again, the colored margin indicates the uncertainty of what the last prediction must have been. If the admissions, ICU figures and mortality are known after a month from date, the R number can be made a lot harder. The fan then only widens at the end. So Maarten Keulemans is right here!*. The impeller at the beginning (thanks for the correction Rogier) is because there was no testing at that time. The virologists indicated on 17 February 2020 (R of 1.8) that an R of 4.1 could be taken into account a week later. That would have more than doubled. In the course of the R, we only see such jumps in the event of suspected measurement errors or malfunctions.
Back to today: week 19
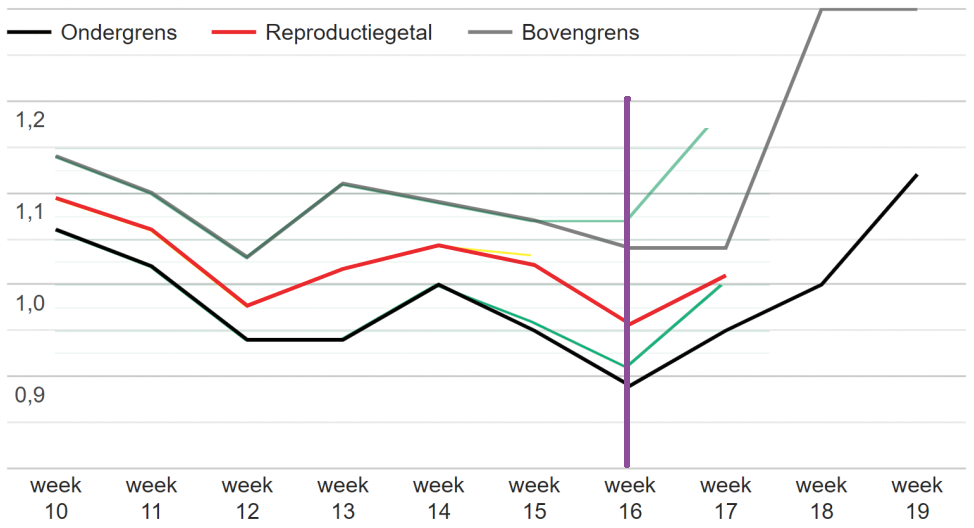
The fact that the margins are still being adjusted in the last week can be seen when you overlay the graphs. That makes sense: the closer the forecast, the more certain the forecast. If you overlay the two graphs, you can see that too.

Red/black/grey: R-values as shown in week 17.
Look, in two weeks the lower limit of week 17 went from 1 to 9.5. In retrospect - it was week 19 this week - predicted a little better than before. But after that it still looks very bad! Lower limit of 1.12 for week 19!! Oops oops, we just wait and see in the hope of strict measures!
The increase appears to have already started in week 16 (red)! Could that be because negative home testers do not go to the test street, making it seem as if more and more people are infected in the test street? Or does the RIVM have ICT problems? Better calculators estimate the R closer to 0.9 than to 1, which means that the last part of the red line should not actually go up.
Red/black/grey: week 19
Let's look at the predicted lower limit of week 16, done in week 17: it was 0.92. That was the last weekly forecast. Two weeks later, that prediction appears to be afterwards dus verlaagd naar 0,89. Kortom, er worden lijntjes om de werkelijke waarde heen getekend, zodat de realiteit optisch netjes binnen de door rivm getekende marges valt. Alleen: dat waren de exacte voorspellingen eigenlijk niet. Nou vooruit, het is een kleine 'correctie' dus een kniesoor die daarover valt. De werkelijke waarde (geel) in week 15 is achteraf ook iets gecorrigeerd. Dat kan. Maar voorspellingen kun je niet achteraf corrigeren. Dan heb je achteraf immers altijd gelijk gehad. Maar dan het volgende:
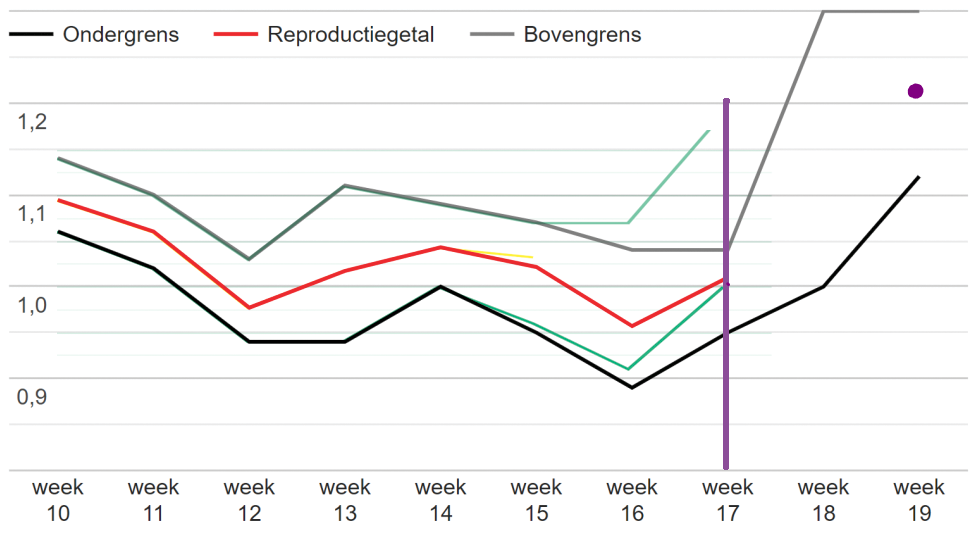
Red/black/grey: week 19
The R-value of week 17 (red) is, seen in week 19 (now), at the level that was seen as the lower limit two weeks ago (green). The predicted lower limit (black line) has therefore been adjusted significantly downwards. So after it has been determined, the forecast is adjusted again, I find it strange but I'll stop talking about it.
The upper limit (grey) has been adjusted downwards even more drastically. It is not clear where this lowering comes from because then it catapults steeply up again. Just moved it by hand for about a week maybe? It indicates a sudden huge trend break where you expect gradual movements. We are talking about large numbers. What happened last week? Did I miss carnival or something? The weather doesn't change towards winter either, it's May!
But take a quick look at that gray and black line in week 19: RIVM now estimates the R-value above 1.2 !! That is about the middle between the lower and upper limits. This increase started three weeks ago, in week 16. How does that fit in with the current state of affairs? After all, this should already be clearly visible in admission and ICU figures from RIVM.
Iedereen 'met een half brein' kan zien dat die superstijging een waanzinnig scenario is dat er voor de zoveelste keer ontstellend ver naast zit. Toch blijven we in een (nota bene onwerkzame) lockdown-greep met minimale versoepelingen. Het kabinet en de Tweede Kamer slikken het voor zoete koek. Allemaal omdat seizoensinvloeden niet worden begrepen en aerosolen genegeerd.
"We zullen zien dat de R-waarde langzaam gaat dalen onder invloed van de vaccinaties"
Ernst Kuipers
No, Ernst: the R-value is collapsing rapidly under the influence of the weather and many people will start to wonder why they have already taken that vaccination and why they still have to test negative while they have that vaccination and the epidemic has clearly disappeared. Until autumn comes again and once again no leg has been lifted to improve the indoor climate or to scale up healthcare, which will have to cope more and more anyway because of the rapidly ageing population.
Aging leads to higher flu peaks because the spread of respiratory viruses is not moderated with ventilation.
"Die R gaat de komende twee weken hard duikelen tot far below the lower limit now indicated, daar zet ik een kartonnetje speciaalbier op."
Anton Theunissen
There is only one long-term solution that helps against all variants and future respiratory viruses: ventilation. To do this, the population must be informed about how they can protect themselves.
Indoor climate management and enforcement are needed (compare fire safety) and an amendment to the Building Decree. For five years now, we have allowed an average of 7,500 people to die prematurely. Just because no one knew or wanted to know how the virus was transmitted. The RIVM must replace, the journalists must be re-educated. If Rutte and de Jonge had been managed a bit more sensibly, they could have done quite a job.
* ah - dat is misschien wat mijn critici verwarren met 'ad hominem' als ze mij verwijten dat ik zelf ad hominem argumenten gebruik - wat dan eigenlijk weer een jij-bak is, ook geen sterke vorm van argumentatie. Ik moet namelijk vaak laten weten dat ik allergisch ben voor het gespit in het verleden van bijvoorbeeld van Haga of Maurice, als men probeert mij iets duidelijk te maken waarvoor inhoudelijke argumenten overduidelijk tekort schieten.
Substantive criticism is not possible without citing the source and if it is the same scientist or journalist who makes similar mistakes over and over again, that may also be mentioned.
Dat wil niet zeggen dat die journalist nooit meer iets goed kan zeggen en ik alles van hem bij voorbaat diskwalificeer - dát zou een echte ad hominem drogreden zijn.
