At the moment, important data is being withheld that could justify or undermine the policy. This withholding is not only done by governments but also by scientific institutes, which are thus de facto renouncing the title "scientific". After all, priority #1 of scientific work is: transparency, openness, willingness to exchange, sharing information, absorbing and processing information.
If these integrity values are renounced, there is no longer any question of doing science or of responsible policy. Not only is nothing exchanged anymore; It is then no longer even possible to verify whether no 'knowledge' is being bent to desired perspectives – either prompted by bosses, or because of the unconscious masking of unforeseen consequences that may have arisen from one's own policy or advice.
Below are two screenshots, found by independent fact-checkers. Find the differences, you will find the solution further on.

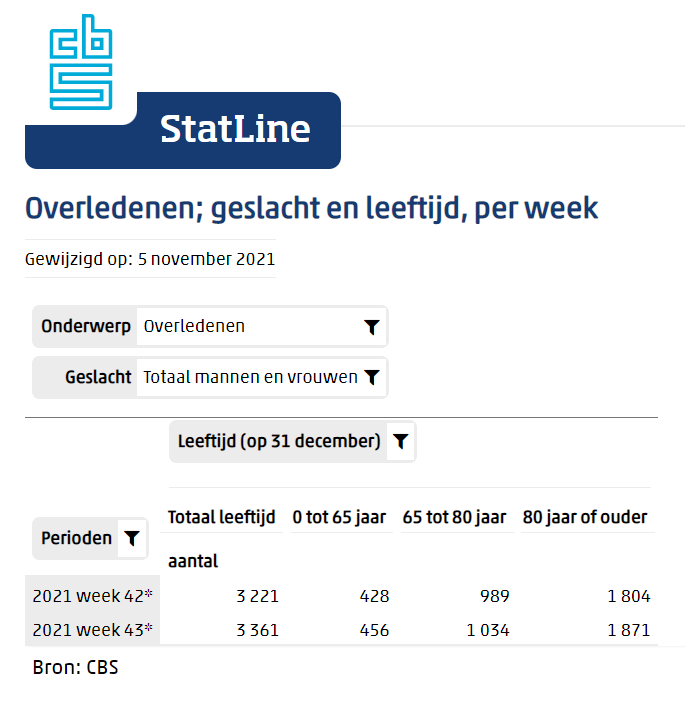
So there are more inconsistencies. Reader Jeroen van Rookhuizen noticed that in the CBS table Causes of death, 2020 – June 2021 A number of 31,194 deaths are reported for the second quarter of 2021 (last tab). Together with the Covid deceased (first tab) there are 33.774.
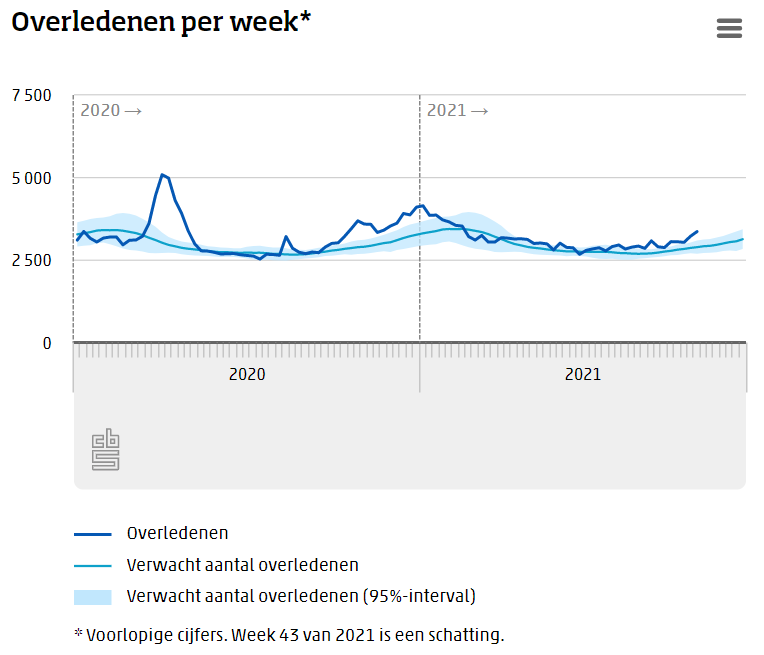
However, if we look at a other CBS table, belonging to the graph "Deaths per week", we find there 38.601 deaths in the second quarter. So we are talking about two reports from CBS with a difference of about 5,000 deaths. Is that missing reporting? If a table has been forgotten that we should have added to it, I would like to hear about it. I couldn't find it in these reports either.
Edit 9 November: There is also a complete overview in which the additions are correct. No mention was made of this in the above reports. StatLine – Deaths; cause of death, quarter and year of death (cbs.nl)
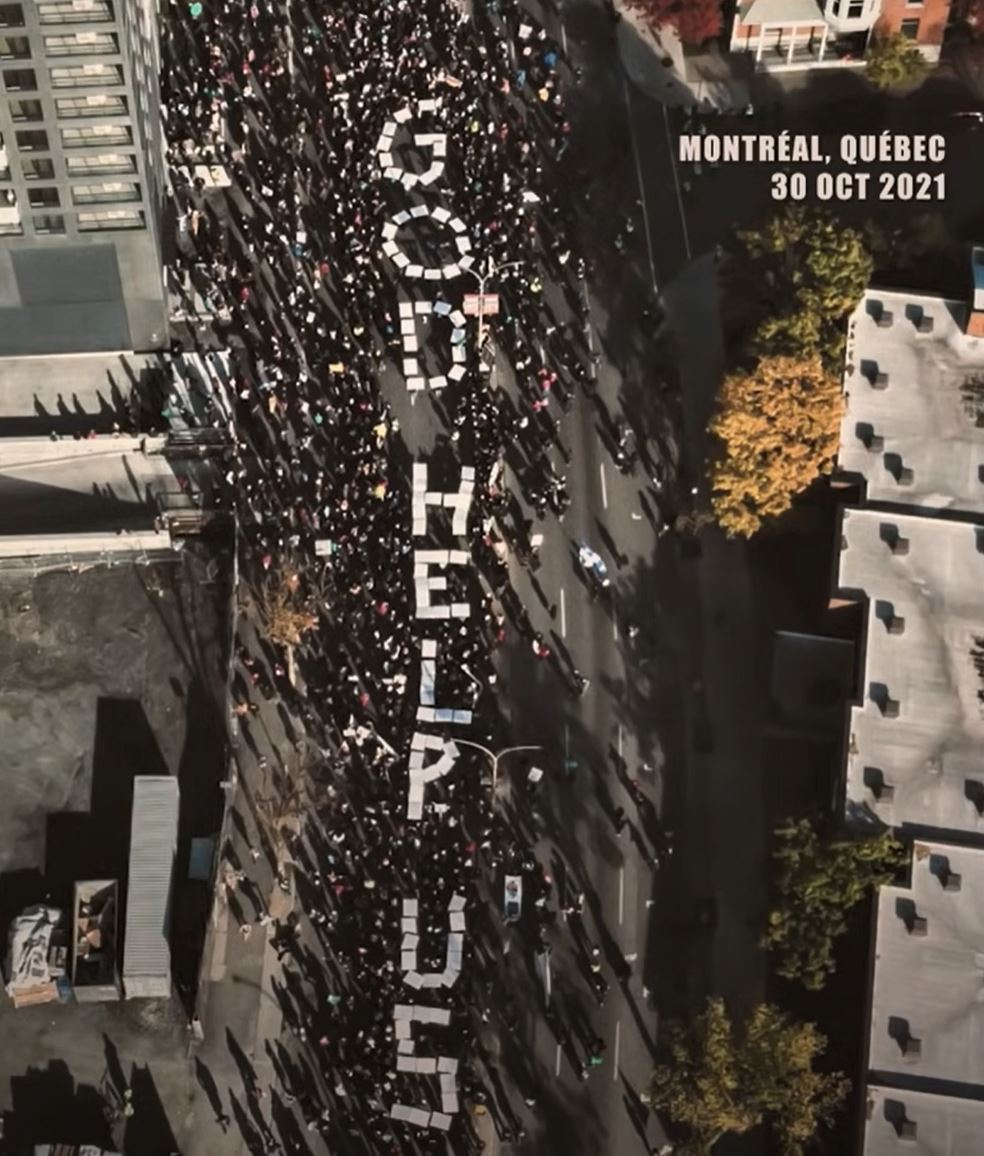
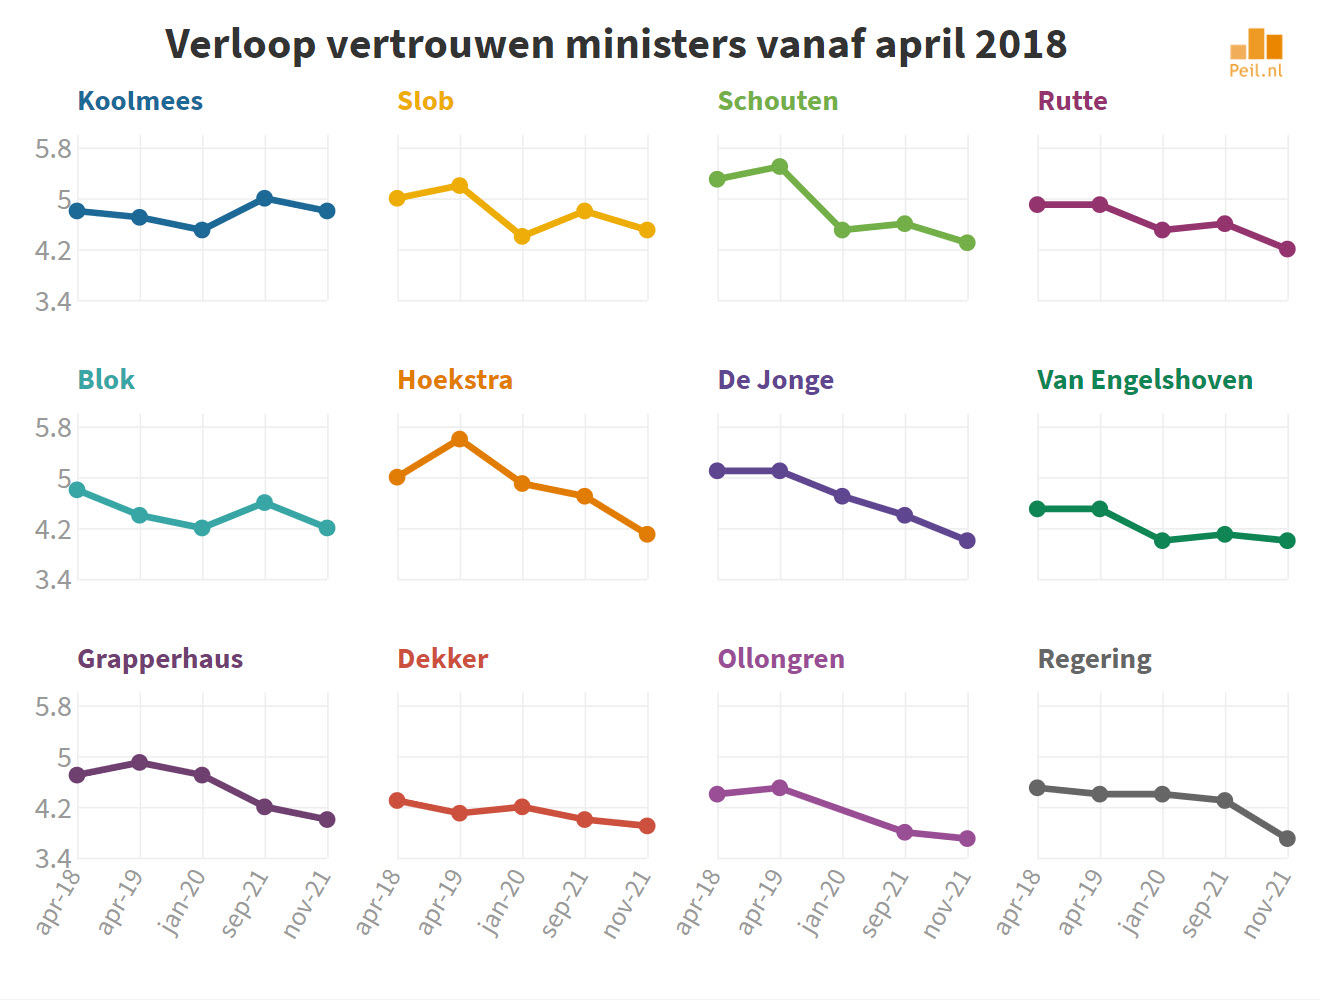
Trust in the government is declining, according to research by Maurice de Hond. It could just be that spreading this kind of information contributes to this.
Concrete need for transparency
This need includes data such as (but not limited to):
- Hospital admissions relevantly broken down – this could indicate the success of the package of measures
- More specifically: distribution of vaccinated/unvaccinated people in hospitals (possibly. ICU and/or mortality) – a vaccination campaign may prove justified if, for example, proportionately significantly fewer vaccinated people are admitted or die (Lareb data are not sufficient)
- mortality rates – Reducing (excess) mortality can demonstrate the success of the approach. The CBS report raises questions.
- Causes – CBS has only published a condensed quarterly overview, with insufficient information to form a picture of the causes of death. In the case of unexpectedly high excess mortality as we are currently observing, we need to find a correlation in order to then investigate whether there is a causal relationship. This requires a specified overview of causes of death.
(As an example, a striking number of causes of death that correspond to the side effects of e.g. paracetamol, are reason to investigate whether that connection also exists. Another example: if there is a lot of mortality after a specific event, such as a visit to a certain cinema, then that cinema must close for a thorough investigation.)
It is particularly important in uncertain times that the population is given the opportunity to understand, to ascertain, to verify and therefore also to control. But not only that: it is now really vital. Lives are actually involved, apparently even thousands. See the graph below: green is unexplained aboutMortality, orange represents the corona mortality reported by RIVM.

The trend line of only the green bars looks like this:
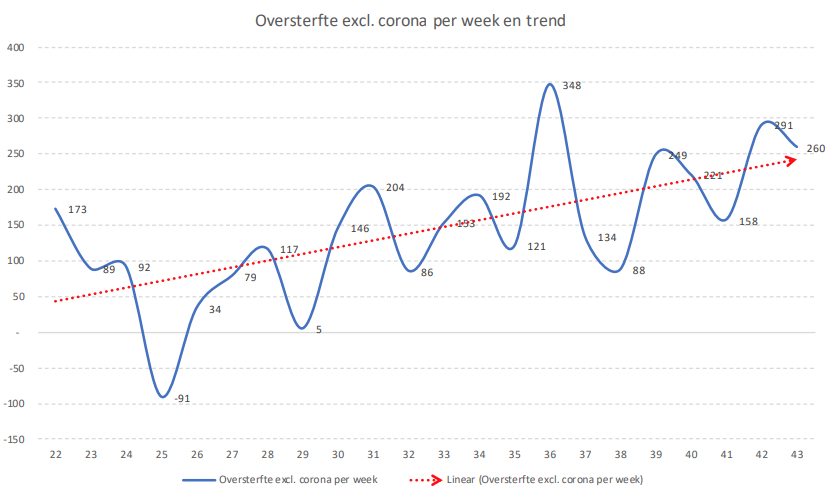
In this graph, the relevant measurement period starts in week 22 (31 May). The trend line indicates that the numbers from before that period have been relatively small, especially in relation to the total excess mortality of which Covid still made up a significant part. That was before the beginning of the summer.
From Summer mortality is, despite insistence and improper (but understandable) shooting out of T. Baudet's shoes, not taken seriously by the cabinet nor by the House of Representatives. So no specification or interpretation is to be expected, in fact, the underlying data is withheld with the consent of our parliament.
Not tolerating control is a serious matter that has no place in a democracy. An administrator who interprets regulated control, prescribed by law as an attack out of distrust, is at least not sure of his case and should accept help precisely for that reason.
Data integrity under discussion: CBS
The Central Bureau of Statistics offers an independent, depoliticized view of the figures in the Netherlands. That should offer hope in these anxious days, with figures that can tell us how the facts stand. However, if the facts can no longer be retrieved because hard figures flow from under our fingers, then fact-checking via the CBS data no longer makes much sense, as the independent fact-checkers on onafhankelijkefeitencheckers.nl. Read their findings and shudder.
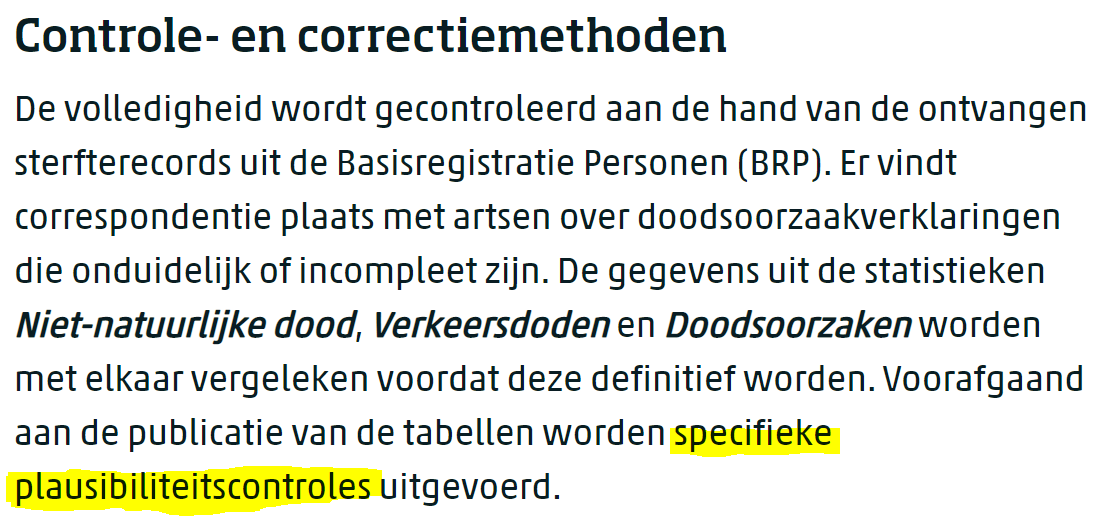
CBS is not doing itself any favours with those sliding panels in their on-line reports. It is downright threatening, however, that a possibly concealing method will not cause any political problems. This method is defended, not to say initiated, by the cabinet through outgoing Minister of Health, Welfare and Sport Hugo de Jonge, who explicitly refuses to disclose information.
Reasoning further, this means no less than that the information that does come to us has been politicized. Data is such that it makes the policy plausible. Is that perhaps what is meant by 'specific plausibility checks'?
Now I am more into numbers than faith, but I really pray that these inconsistent data are not a signal of the creeping ingress of destructive, manipulative, propagandistic tendencies into the most trusted institutions and thus also into our beautiful, beloved, sometimes clumsy but always respected democracy. In the eyes of dogmatic ideologies, calculating and thinking for yourself is unfortunately not always a merit. I'll do it anyway.