
Er tekent zich een duidelijke oversterfte af die nergens aan de orde wordt gesteld. Zeker in tijden waarin er nieuwe virussen rondwaren en innovatieve medicatie wordt uitgerold zou dat absoluut onmogelijk moeten zijn, onder de hoede van gezondheidsinstituten en -ministerie. Dat er toch stille oversterfte mogelijk is vind ik meer dan zorgelijk. Gisteren vergeleek ik 2021 met voorgaande jaren, nu alleen met Covid-jaar 2020 - maar dan wel beide kalme zomerperiodes.
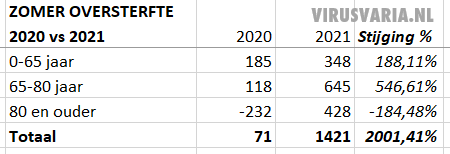
CBS mortality and excess mortality figures in table and picture
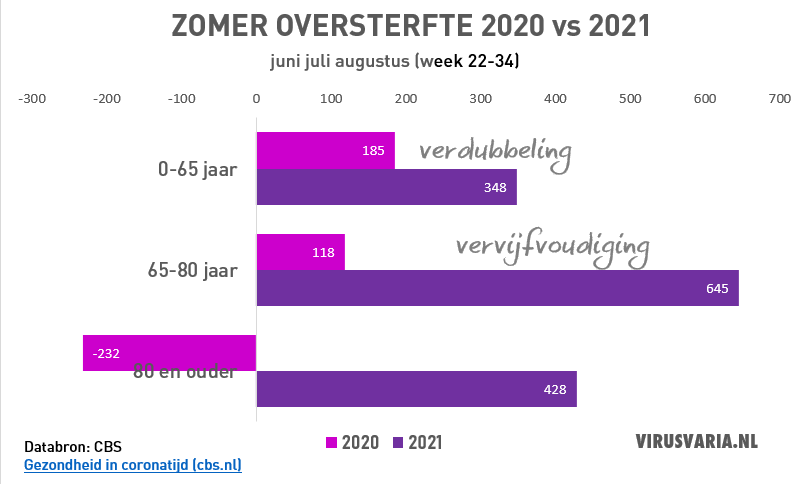
On Health in times of corona (cbs.nl) the figures for 2020 and 2021 can be downloaded containing the expected and actual mortality per week. The difference between them is the excess mortality. For weeks 22-34 (June to August) I have put those figures in a table and in a graph. There was little corona mortality in those weeks, which is why they are very comparable.
Graphically:
It's not because of corona. In all age groups combined, there were 119 more corona deaths in summer 2021 than in summer 2020, but that cannot explain the difference by any means. Just subtract some of the values: 50 from the 80+ and 65-80, and 19 from the 0-65.
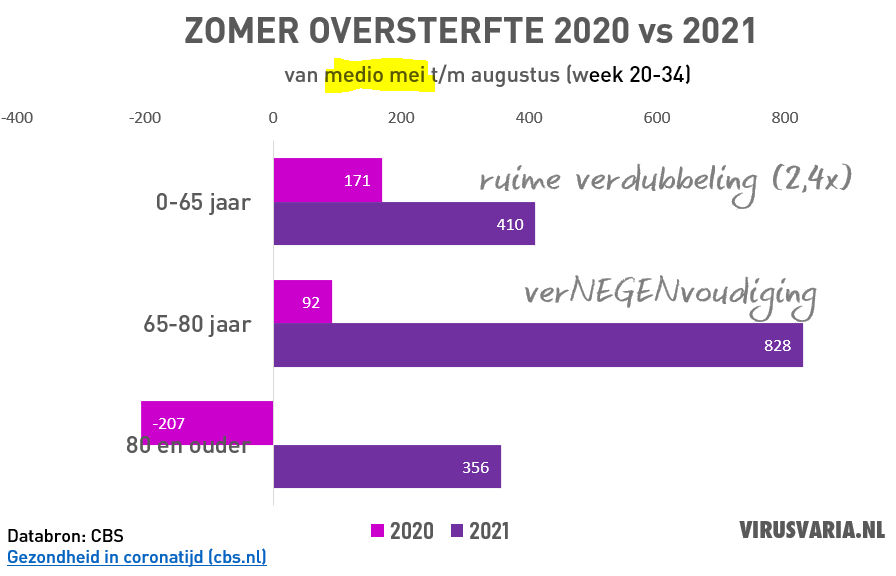
Kijk je vanaf medio mei dan wordt het beeld nog sterker, ook omdat ondersterfte sommige cijfers verlaagt terwijl de periode langer is. Dat is contra-intuïtief. Er begint dan wel een 'coronavervuiling' om de hoek te kijken die verrekend moet worden. Ik verwacht daarvan niet heel veel verschil dus dat heb ik niet gedaan - maar be my guest...!
If you see the figures above, it is difficult to understand that the RIVM has been emphasizing for months that there is no excess mortality and that no journalist has yet sounded the alarm about this. Research into the underlying cause is necessary.
