
Update September 10: when I made the graphs below from English data two years ago, I couldn't believe that the mortality bumps in the UNVACCINATED were the result of data pollution: administrative errors, misclassification, healthy vaccinee effect and mortality depletion. The latter two, I now know, arose because people with a short life horizon were not vaccinated and died in the first weeks/months of a vaccination campaign as unvaccinated people.
Because vaccinated people had a so much lower mortality risk than unvaccinated people, this was attributed to the effect of the vaccinations: they protected so well!
An additional but equally important aspect: due to administrative delays, vaccination statuses were only processed after a number of those people had already died as unvaccinated. In order to keep a good picture of the current vaccination coverage, deceased people were removed from the register. This alone made that database unusable for retrospective analyses. In short: the health authorities turn out to be either incompetent or fraudsters (this impression is created because almost everything that was done was positive for the vaccines).
Data from England shows: at the beginning of 2021, older people benefited greatly from the vaccinations: vaccinated people showed lower mortality rates. However, the overall mortality rate under 50 years of age and younger was higher among vaccinated people than among unvaccinated people. The effect of boosters is not reflected in the mortality data.
De uiteindelijke toets van een vaccinatiecampagne wordt gemeten in de "All Cause Mortality": de totale sterfte. Vaccinaties kunnen op de doelziekte wel een positief effect hebben maar daarnaast negatieve effecten hebben, of nieuwe aandoeningen veroorzaken.
The graphs below show, based on English data, how the mortality per 100,000 was among vaccinated compared to the unvaccinated. The available dates run from January 2021 to January 2022.
In the first months of 2021, older unvaccinated people in particular had a hard time. Covid-19 was, as we have come to expect from the flu, an important cause of death among the elderly. The protective effect of the vaccinations is clearly visible in the elderly - in the first months. The orange lines remain almost flat in the older groups.
As the groups get younger, the picture changes. Keep in mind that each chart has a different scale. The lines may look the same, but the values on the vertical axis may be double, as in the first two graphs. Everywhere applies: the lower the value, the less mortality.
This concerns England, a total of more than 50 million people. England is bigger but children are not allowed to participate.
Omdat we de sterfte per 100.000 berekenen is het verleidelijk om de resultaten op de NL bevolking te projecteren. Mocht je dat doen, doe het dan in elk geval per leeftijdsgroep, ga niet "verzamelen" en samenvatten.
Virusvaria purple is unvaccinated. Orange is vaccinated.
90 years and older: mortality per 100,000 by vaccination status (England, UK)
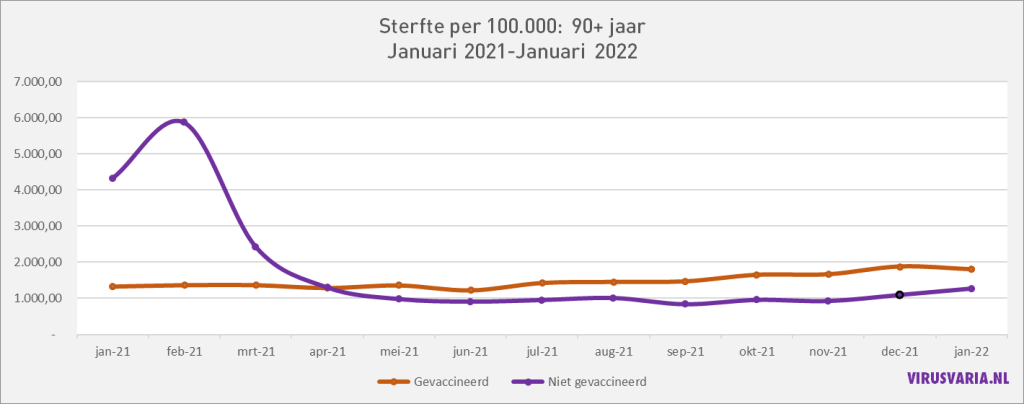
Striking: the unvaccinated group has fewer deaths per 100,000 since April. The mortality then remains below that of the vaccinated. One explanation may be that the weakest have died from/with Covid-19 and the strong survivors are doing better than the vaccinated group, in which the weak have also survived.
The mortality rates are unimaginably high but still a number of years and it automatically goes to 100,000 deaths per 100K. All kinds of interpretations are possible here.
80-89 years: mortality per 100,000 by vaccination status (England, UK)
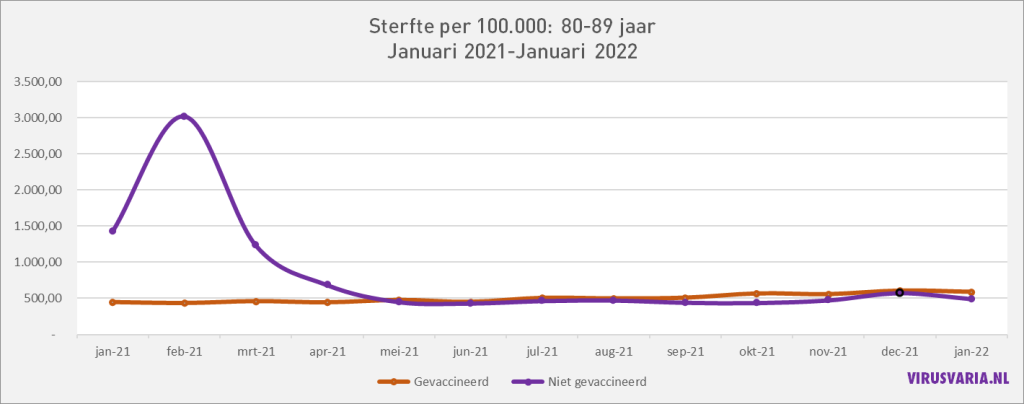
Here too, a clear effect is visible for 3 months. The vaccinated hardly suffer from Covid-19. After that, there is no longer a disease that makes the distinction. It is also not possible to see when the booster was administered. The age cohort is not that big: 2.3 million. 1 per 100k represents 23 deaths in this age group. 2,000 per 100k means 46,000 deaths.
70-79 years: mortality per 100,000 by vaccination status (England, UK)
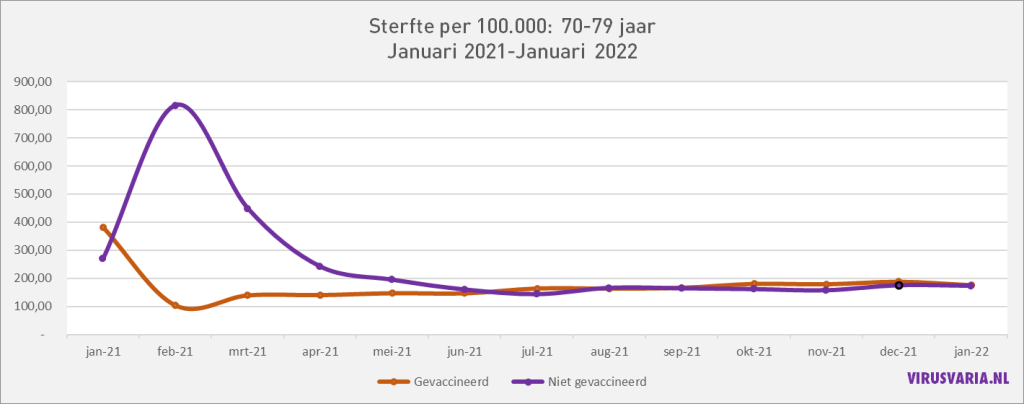
Mortality among people in their seventies even drops below what appears to be the basic level, if we look at the unvaccinated in the summer period. This can be under-mortality from the previous peak. Halfway through the year, that effect is gone. Here, too, a clear positive vaccination effect (VE). In February, that saved about 650 per 100,000. Out of a cohort size of 5 million, that's 32,500 people.
60-69 years: mortality per 100,000 by vaccination status (England, UK)
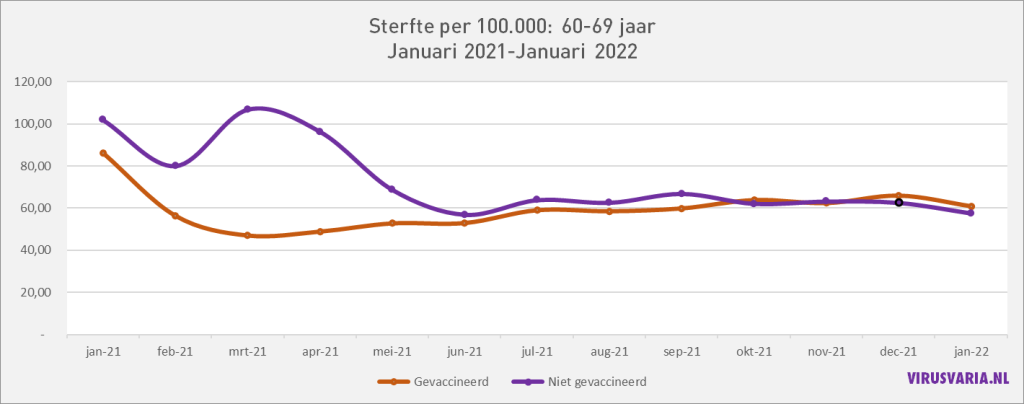
Vaccinated people in their sixties also have a mortality rate below the basic level. The return to 'normal' takes a little longer than at 70 and older.
50-59 years: mortality per 100,000 by vaccination status (England, UK)
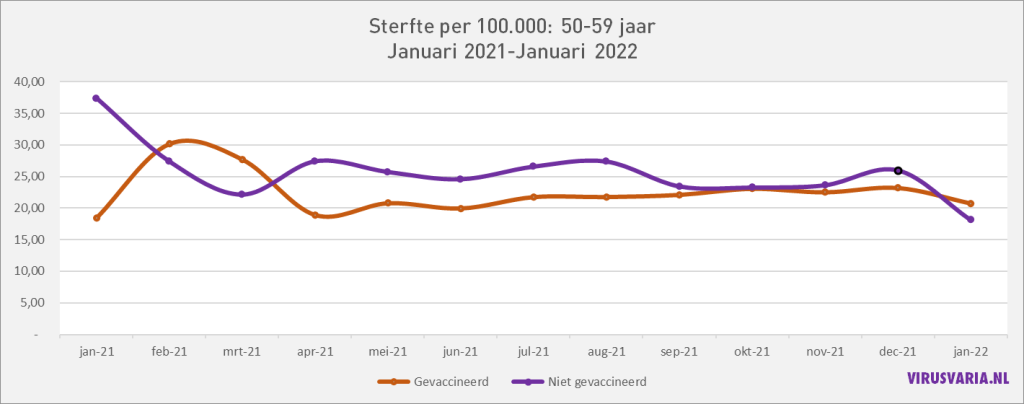
With the fifties, the picture changes. The vaccinated first show an increase in mortality here (perhaps the most vulnerable were pricked first?) but then seem to benefit from their jab for longer. In January, the unvaccinated do better, who then dip below the mortality level of the vaccinated. If you look at the scale, the difference in June is only 5 per 100,000. But it is about 7.3 million vaccinated. That amounts to about 350 people. Only in June.
40-49 years: mortality per 100,000 by vaccination status (England, UK)
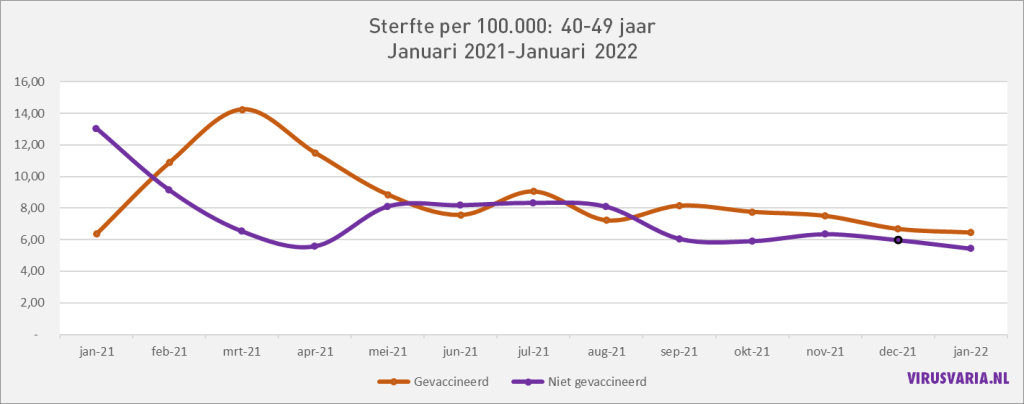
Below 50 it becomes worrying. Those vaccinated do less well, both before and after the summer. In the months February-March the mortality difference is approximately 6 per 100k. That's not much either. Yet in a cohort of 6.5 million this amounts to 390 deaths per month. For Feb-Mar alone there are 780. Young people. QALY time...
18-39 years: mortality per 100,000 by vaccination status (England, UK)
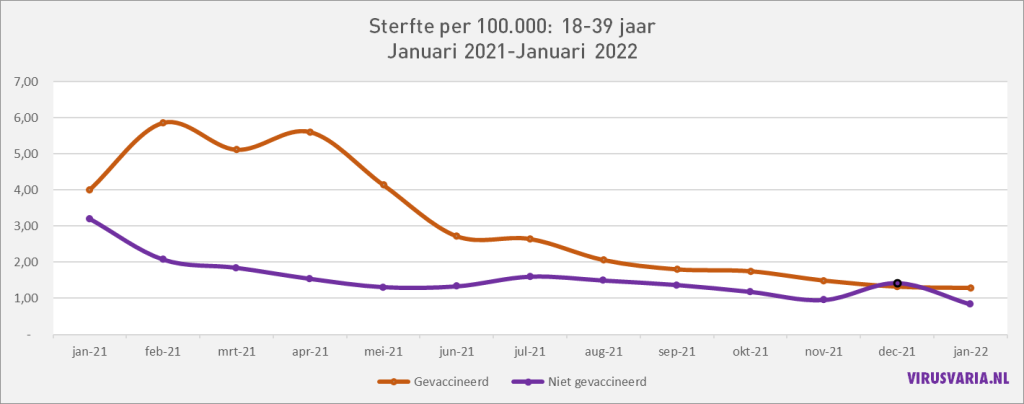
Of course, this doesn't look good at all. We see substantially higher mortality rates in vaccinated people than in unvaccinated people. Again a small difference of about 3 per 100K over the months feb-mar-apr-may. Unfortunately, this is a broad age group. In the Netherlands, people sweep 0-65 together in a group, so that little can be read from it. In England people go less far but of course we would also have liked to see the young people grouped together every 5 or 10 years. Especially at that age, a lot of things happen to your body. Now this group consists of 19.3 million people. We count the 3/100k on that by: 579. These are rough estimates and they certainly need to be calculated precisely. But for a blog, I find this indicative enough.
Proportionately
Finally, a collection graph showing in percentage terms how the changes of vaccinated people relate to the unvaccinated, in all age groups. The starting position is the mortality rate per 100K among the unvaccinated. For example, if it is 3.0 and in the vaccinated it is 2.7, then the number shown in this graph is -10%. Negative percentages are therefore good: less mortality.
Keep in mind that there are few deaths, especially among 18-39 year olds. That could soon be about large (accidental) differences. At the same time, the trend is quite steadfast throughout the months with no strange outliers. It is also by far the largest group (approx. 19 million).
Provisional conclusions
- Uitsluitend 60-plussers hebben wat betreft "All Cause Mortality" voordeel gehad van vaccinaties. Dit vond plaats in de eerste maanden van de vaccinatiecampagne toen de Alpha, Bèta- en Gammavarianten dominant waren.
- Approximately from May 2021, there is no material difference in mortality between vaccinated and non-vaccinated people, in all age groups. This is the period in which successively the Delta variant and the Omikron variant were dominant despite two booster campaigns that were intended to maintain the effect of the vaccines.
- On the flat line of unvaccinated people, mortality remains almost constant during Delta and Omikron periods.
- This flat line does not seem to be due to the vaccinations, nor to the later boosters.
- If the vaccination effect is calculated on the basis of differences between vaccinated and unvaccinated, then it is not the occurrence of 'waning' (the decrease in protection) that caused no mortality in the winter. It is the neutralization of the disease that makes the difference disappear. That decrease in effectiveness was the selling point for the boosters, and here and there the second booster is already being administered. It may be surprising that the pharmaceutical companies were unable to tell the difference. Injections should also be given every six months or more often, given the rapid decay. There are still many millions of boosters on back order.
- Numbers of deaths of the total population are meaningless. Researching and assessing vaccines requires a much finer-grained age stratification.
Possible next steps
- What does the picture look like after deducting the Covid mortality? (And is the number really correct with /due to Covid?)
- Quantifying by age group: how many people are we actually talking about? Even very low percentages quickly amount to hundreds of deaths. This should ideally be calculated in QALYs.
- In this article, a distinction has been made between vaccinated and non-vaccinated people. Comparisons between unvaccinated and double-vaccinated people may also be interesting. Or between double-vaccinated and boosted.
- Where vaccinated people show higher mortality rates after June, it can be argued that people with underlying suffering have opted for vaccination more often. Dust for a subsequent analysis.
I invite everyone to check, whether or not randomly, whether the numbers have been correctly taken from the sources. Various operations (copy/paste) were needed to organize the data sensibly. In addition, it is good to know that the vaccination coverage per age group is always based on the 15th day of each month. A refinement could be to take the average vaccination coverage of all days of that month.
Sources
Source 1:Vaccination status population by age, from start vaccinationsof the UK corona dashboard. As CSV, JSON and XML downloadable on theVaccinations in England, scroll to the last purple chart and click Download.
Source 2: Mortality rates by vaccination status of theOffice for National Health Statistics(Table 2, rows 1 to 641 and Table 8 for <18)
Teenagers: a tip of the veil
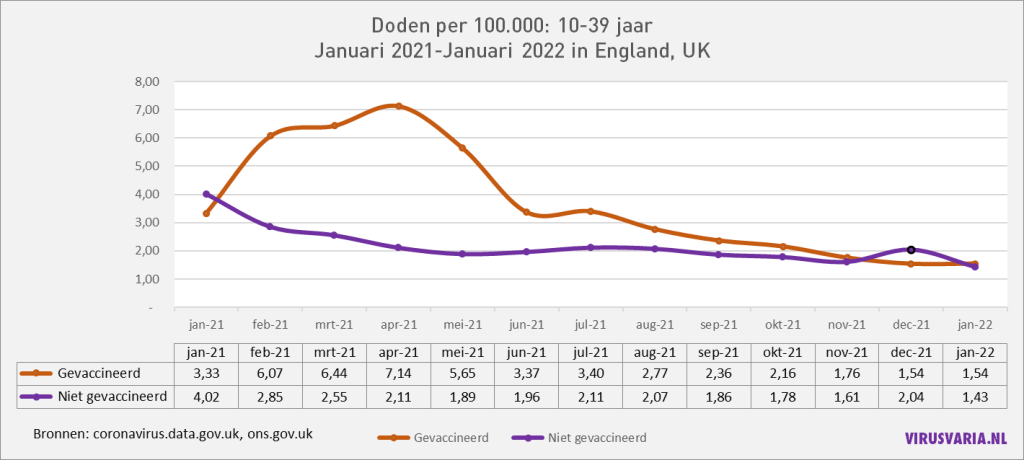
An attempt to map even younger groups has so far failed. I was able to generate the data below by combining Table 8 and Table 2 from the source file (the links are at the bottom of this article). The above is all based on Table 2. But in Table 8, a kind of summary of key figures, there is also something about 10-39 years! I hadn't seen that right away; Table 2 works with 18-39 years. I still need to look at it more closely but the combination of data below looked plausible.
A L L E E N V O O R C I J F E R N E R D S
Once again inconsistencies in sources, including in the UK...
18-39 is a subgroup of 10-39. The idea is obvious to subtract the grades of the group 18-39 from the numbers of 10-39 and you keep the group 10-17 years. Very interesting of course. Statistically, merging or peaking age groups is a dangerous operation, I am aware of that but I wanted to see it anyway. However, when I came up with a negative number, I stopped for a while.
It turned out that in January there had been 18 (eighteen) deaths in the group of 18-39 year olds and in the group of 10-39 year olds... 15 (fifteen).
In the subgroup without 10-17 year olds, more people died than in the entire cohort with that group of teenagers... That is not possible. Other numbers also didn't match. On closer inspection, Table 8 has been significantly updated and it is not yet clear to me why and how.
Een voorbeeld: bij de gevaccineerde 'jongeren 10-38' is de sterfte gemiddeld 26% hoger dan bij 'gevaccineerde jongeren 18-39'. Bij de ongevaccineerde is het 200%, het dubbele ten opzichte van de andere worksheet - in toch echt hetzelfde Excel-bestand. Dat zou betekenen dat met toevoeging van de 10-17 jarigen de ongevaccineerde sterfte verdubbelt. In die groepje tieners zouden er dus net zoveel overlijden als in de hele groep 18-39, wat ca. 3x zoveel mensen zijn. De toelichting in het "Notes" werkblad zegt er niets over.. Je zou bijna twijfelen aan de consistentie van de ONS-data.
Example: July. In the right column are also the 10-17 year olds.
| 18-39 (Table 2) | 10-39 (Table 8, incl 10-17) | |
| Deaths unvaccinated | 130 | 262 |
| Deaths vaccinated | 298 | 385 |
Prof. Norman Fenton signaleerde in oktober vorig jaar andere inconsistenties in de ONS-database: verschillen in cohortgroottes met de NIMS database (National Immunisation Management System). Hij leek toen echter alleen te beschikken over "age standardized mortality rates" en geen absolute cijfers. Mocht je hier dieper in willen duiken, zoek hem op on Twitter or check out these links:
The most recent and relevant gives Ward van Koperen in the comments: https://www.researchgate.net/publication/358979921_Official_mortality_data_for_England_reveal_systematic_undercounting_of_deaths_occurring_within_first_two_weeks_of_Covid-19_vaccination
Older links:
Comparing age adjusted all-cause mortality rates in England between vaccinated and unvaccinated (normanfenton.com)
Comparing all-cause mortality rate by age group: vaccinated v unvaccinated (normanfenton.com)
inconsistencies_vaccine.pdf (qmul.ac.uk)
If anyone knows why those numbers weren't also used in Table 2 (or vice versa) I'd love to hear it. No speculations please, I can think of that myself!
In the graphs below, the population data from NIMS are used. As a result, mortality rates among the unvaccinated, at least in some age groups, may be lower than they actually are.
Because England works with impure population estimates, we don't know how many unvaccinated there are. The population size used has a direct effect on reporting on unvaccinated people. The deviation also differs per age group. It is not yet clear whether and if so, how this can be adjusted; the UKSHA (UK Health Security Agency) is working on this. The ONS says about this:
"We hopen dat het werk dat UKHSA doet om de NIMS-gegevens te verbeteren (inclusief het verwijderen van duplicaten), samen met het werk dat ONS doet aan bevolkingsschattingen en de volkstelling van 2021, ons inzicht zal verbeteren. Het is echt positief dat ONS en UKHSA samenwerken om te proberen een oplossing te vinden voor dit probleem, dat zo belangrijk is voor zo veel statistieken. Gezien deze onzekerheid kan kennis van de implicaties van de verschillende keuzes gebruikers helpen de gepresenteerde gegevens met de nodige voorzichtigheid te interpreteren."
Uitgebreidere verantwoording vind je in de post "UK professor: 'Data on mortality by vaxx status are junk' "
Let's hope that the de-duplication is carried out without batting an eye at the effects on vaccination effects. Organizing an independent supervisor would be wise (Prof. Fenton will certainly want to help) otherwise it will become just as powerless an operation as the excess mortality research by CBS/rivm.

A lot of work Anton, thank you for that; I lack the courage to check everything. Because unfavorable figures (regarding vaccination) are emerging, a 'fact checker' may throw himself into it. 😉
Hi Anton,
I think Norman Fenton had found that the first few weeks after vaccination are not counted as vaccinated, but as unvaccinated. This explains the crazy rise in 'unvaccinated people' just as the vaccination begins.
@Jan-Willem, that's exactly what I wanted to write.
I think that's this paper:
https://www.researchgate.net/publication/358979921_Official_mortality_data_for_England_reveal_systematic_undercounting_of_deaths_occurring_within_first_two_weeks_of_Covid-19_vaccination
This one is very relevant indeed. If those first two weeks are not included... See my reply to Joost.
That it is not at all certain that the vaccinated have had an advantage of the vaccination.
all those "extra" deaths among the unvaccinated were in fact nothing but people who were so bad that they stopped getting vaccinated and then soon died.
Those whose death was already at the bedside were therefore automatically not vaccinated.
Added to this are those who had indeed had a jab and died within fourteen days afterwards, because they were also seen as unvaccinated.
For the latter, it also speaks that after each vaccination wave, mortality among the unvaccinated rose rapidly to lose weight again after two weeks.
And how can a vaccination lead to higher mortality among the unvaccinated?
And so the conclusion can be for the same money that the vaccinations have made no difference at all.
"Those whose deaths were already at the bedside were therefore automatically not vaccinated."
Can you explain why there were so many more than usual?
And that of those two weeks, Fenton also says something like that, see earlier comments.
But the table really says "vaccination" < 21 dagen". De data stel ik even niet ter discussie maar als je dat wel doet, weet ik niet zeker of het of het beeld echt heel erg verandert. Natuurlijk zijn dat allemaal dingen om uit te zoeken. Als je Fenton leest, zie je hoe lastig dat is.
It is not clear to me with your answers so far: Can the peak in unvaccinated 70+ groups be explained by the fact that the data may include dying within 2 weeks after vaccination?
The answer is essential for me to be able to appreciate the info from your article.
Ik kan niet anders dan verwijzen naar het artikel van Fenton in het Comment van Ward. Het is verder speculeren. Als de categorie “<21 dagen" bijna allemaal binnen twee weken overleden zijn en als ongevaccineerd geteld, dan wel. Het lijkt mij echter niet dat het 100% daaruit te verklaren valt. Covid zal echt wel op zijn minst de rol van een ernstige griep hebben gespeeld. De lijn van de gevaccineerden blijft nu opvallend vlak en daar kunnen we wat van vinden maar verder...
When I look at the graphs of 70 and above, it seems as if vaccination initially helps 70+ year olds. Just a flat line all year round, so also at the corona peaks! But that can't be right, can it? Then I thought about what happened in England last year: A study came out showing that unvaccinated people died during the vaccination period! That was of course wrong, and it soon became clear why: you are only counted as a vaccinated person 2 weeks after your vaccination. The study was quickly withdrawn.
Anton, could it be that your data also contains this error?
oh wait, I see that others have already come up with this reaction. never mind.
Of course, it's not my data, it's our data. According to them, the "vaccinated" are really including "vaccinated less than 21 days ago". If they really do not count the first two weeks, the picture will indeed not get any better! But then the definitions would not be correct:
"First dose, less than 21 days ago", "Second dose, less than 21 days ago", "Third dose or booster, less than 21 days ago"
Those first two weeks are indeed not included in the 'vaccinated' according to the article below:
https://www.researchgate.net/publication/357778435_Official_mortality_data_for_England_suggest_systematic_miscategorisation_of_vaccine_status_and_uncertain_effectiveness_of_Covid-19_vaccination
Preprint “Official mortalitty data for England reveal systematic undercounting of deaths within first two weeks of Covid-19 vaccination” Craig et al
Following your invitation to check it myself, I tried to download the data and recreate the graph. But it's too complex and too much work for an evening. so my attempt failed. However, you have gained even more appreciation for :). However, I still don't trust it. It also doesn't fit into a 12% Vaccine Efficacy, which the Brown Institute came up with. Could it be that insufficient account is taken of the fact that the number of unvaccinated people in January 2021 is so large partly because only a few 90-year-olds have been vaccinated? So that it's a much larger population than later in time?
I also do not understand this conclusion: "So the flat line of the vaccinated does not seem to be due to the vaccinations, nor to the later boosters." If I look at 70+ then the beginning flat line is only due to the vaccinations, it seems to me.
I mean the flat line in the second half of the year. Perhaps I should clarify that.
The size of the populations not vaccinated and are vaccinated are settled every month in the 'per 100k'. [done now] Of course, that ratio changed in the first months, but then the number of deaths of course changed with it. If I have time again, I can also make the same calculation for double-vaccinated people – it is indeed quite a job. I now count from the first vaccination, so only not or not.
Hello Anton,
A good story to see. I just have a few comments on the collection chart with the various age groups.
1. Groups 40-49 and 50-59 have the same starting value (-51%)
2. The same applies to groups 80-89 and 90+ (-69%)
3. There are two rules for the group 80-89, the first is a copy of the group (70-79).
4. The first value of this is 42%. If you change this to -42%, a more credible picture emerges.
5. The third value of the group 18-39 seems too low. This dip in the curve is not found in any other group.
I suspect that when copying the data, some mistakes have crept in and possibly already in another preliminary phase.
A bit late response, two years later! Sorry.
That collection graph was indeed incorrect. I just deleted it. Fortunately, I don't see the errors I saw in the other graphs. I'm not going to do the math anymore either. The data is so unreliable: the suds are not worth the cabbage (anymore) and on top of that, others are also on top of it now.
But thanks anyway for your correct correction!
Hello Anton,
Ik heb vorig jaar een eerdere versie van deze dataset geanalyseerd. Er zit een addertje onder het gras die ook in de tab “Notes”staat, nummer 18: “Caution must be taken when comparing mortality rates as the characteristics of people in the different vaccination status groups, such as health, may differ, particularly due to the prioritisation of the vaccine to more clinically vulnerable people.”
Alternatieve hypothese:
In the elderly group, you get an extra contribution to the peak in unvaccinated people that is probably not related to covid. On the deathbed, people are not vaccinated. So you get a negative peak by healthy elderly people who get the vaccination and the sick elderly who are left unvaccinated and then die, The healthy vaccinated elderly then go a little later, so there is a lag behind it.
Something similar in the young. First of all, the young people with underlying suffering are vaccinated. Because of that underlying suffering "positive" peak and a negative for the healthy unvaccinated.
These effects are averaged out after a few months once the vaccinations have been put in the group. In the 90+ elderly, the vaccinated get a disadvantage because the weak have been filtered out, but certainly in the 90 year olds the mortality chance is such that there is clearly higher mortality later when nature has run its course.
Hi Harry,
I know those objections from early/mid-2021 and I have also read the Notes. Then, in the middle of the vaccination campaign, it was a heavier point of attention than it is now, now that we can oversee the whole year. There is a lot to say about it per age group. It's quite complicated.
About the 60+ group:
If you pick out exactly the vulnerable when vaccinating, do you get a death peak in the vaccinated that has nothing to do with vaccinations, because there are so many vulnerable people? I don't see. That should also be reflected in a synchronous decrease in mortality among the unvaccinated (after all, you have taken the vulnerable out of that). I don't see that either. Not even with the young people, by the way.
There is also vaccination in hospices so 'no vaccination on deathbed'...? But that doesn't cause any extra mortality either, those people would otherwise have died as well.
I did get a different angle thanks to your question. I have to let that sink in for a moment.
Hello Anton,
Was away for the weekend, so a little later this reaction.
The dataset I looked at was based on week 1-38 2021. Unfortunately, I can't insert graphs. I came to this hypothesis because there was a strange peak at status "1st dose" that decreased very slowly.
It is indeed complicated and kept me busy for weeks last year. Like:
– By downloading the mortality figures of 2016-2019 (per 5 year groups) weighted average mortality/100K per week calculated (baseline).
– Then for age groups 60-69 and 70-79 looked at the mortality/100K of the various vaccination statuses combined with number of persons with first and second doses. From here image:
1. after full vaccination mortality rate 60-80% lower than baseline for 3-4 months because few had had the full vaccination.
2. ascending peak of about 8 weeks with up to 3-4x baseline for the unvaccinated
3. very high peak up to 9x baseline for mortality with status 1st dose
Among the 60-69 year olds, the same picture shifted in time due to vaccination schedule.
That image led me to this hypothesis as it seemed like a plausible explanation for the pattern. Point 1 and 2 by leaving unhealthy persons behind the unvaccinated and therefore healthy vaccinated. Point 3 by unhealthy people who do not get the 2nd dose.
I have the dataset and data available if you are interested, just let me know.
Certainly, please. I wanted to calculate a baseline myself. I lack the time, also to check your comments. I'll look at that dip in 18-39 today.
Another addition: comments only concern the first half of 2021 and the high mortality among unvaccinated people that you mentioned. That vaccination has had little effect on mortality from delta and omicron is clear from your analysis.
That is not possible either. The unvaccinated do not show a mortality bump in the second half of the year, so what effect would you have liked to see... Perhaps there is something to be seen in the hospitalizations.
I live in the US and I continue to hear stories in my area of people under sixty who suddenly drop dead. Usually within a week of a booster. Now I don't hear that in nl through my circle of friends there. Any idea how that would come about? I myself have the suspicion that US started with boosters earlier
In response to the above article of 5 May (Safe, working?) I would like to send you your own study in which from 1991 to 2020 the mortality per age group of 5 years in the Netherlands has been worked out.
This with figures from Statistics Netherlands that were only released in mid-June 2021 (for 2020). I hope that it will happen again this year so that the vaccination year 2021 can be viewed.
I'd love to hear if you're interested.
@Ron, certainly interest but too little time... (and sorry for the late reply!)
Do you have an updated version available ? In the meantime, a group I'm working with is also working on that, but maybe it's welcome...