
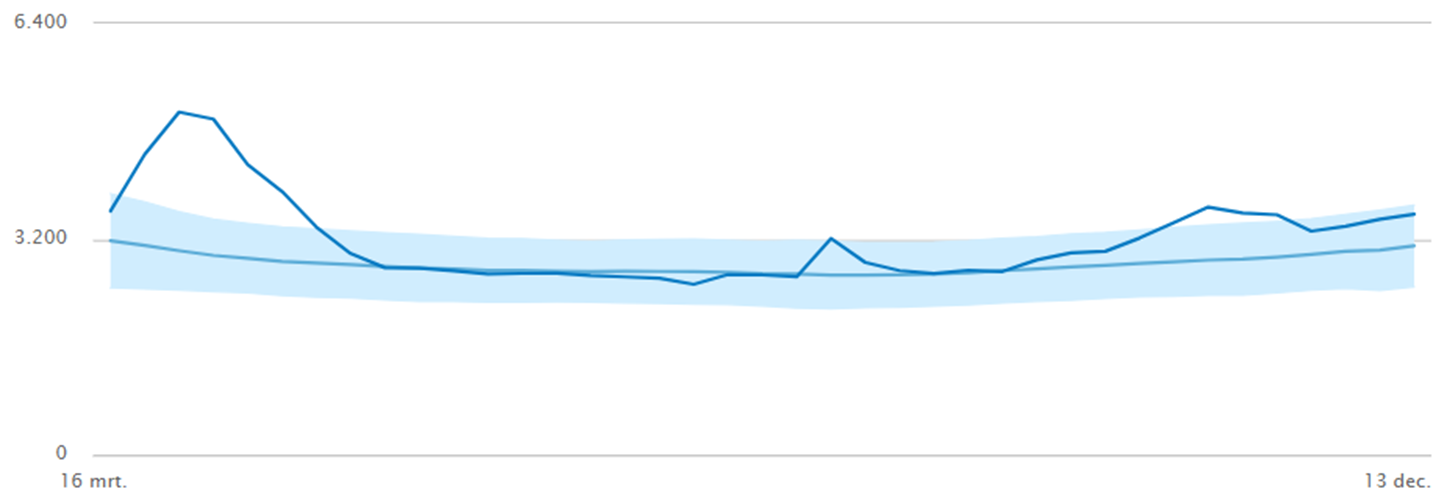
"If a mistake is made, it will be corrected as soon as possible after discovery. This is communicated transparently via the corona dashboard." Dat schreef minister Kuipers over de technische fout op het coronadashboard. Die had tot gevolg dat er vier maanden lang een uitgebalanceerde verhoging van de drempelwaarde voor oversterfte werd afgebeeld. Dat maakte ik pending on 30 April. After Maurice de Hond blogged and tweeted about it, it generated publicity and action was taken. It just goes to show how essential critical media are.
Minister Kuipers beantwoordde gisteren de Kamervragen van Wybren van Haga. Blckbx berichtte vandaag over de uitleg en schrijft: "Of de ‘fout’ ook zou zijn hersteld, als de minister daar niet door De Hond op was gewezen, zegt Kuipers niet".
Minister Kuipers verzekert ons in zijn antwoorden in elk geval dat "If a mistake is made [...] this will be communicated transparently via the corona dashboard." Hij had ook heel gemakkelijk kunnen zeggen: "Yes, we really do correct such a mistake, after all, we did that last year". Maar zo transparant wenst hij het nu allemaal ook weer niet. Of was hij ook daarvan niet op de hoogte?
A small reconstruction of 2020-2021 in response to a tip from André Redert. Exactly the same story took place the year before.
Fix errors that are not discovered? Sure. Take a look.
On 17 December 2020, A year earlier, the graph looked like this:
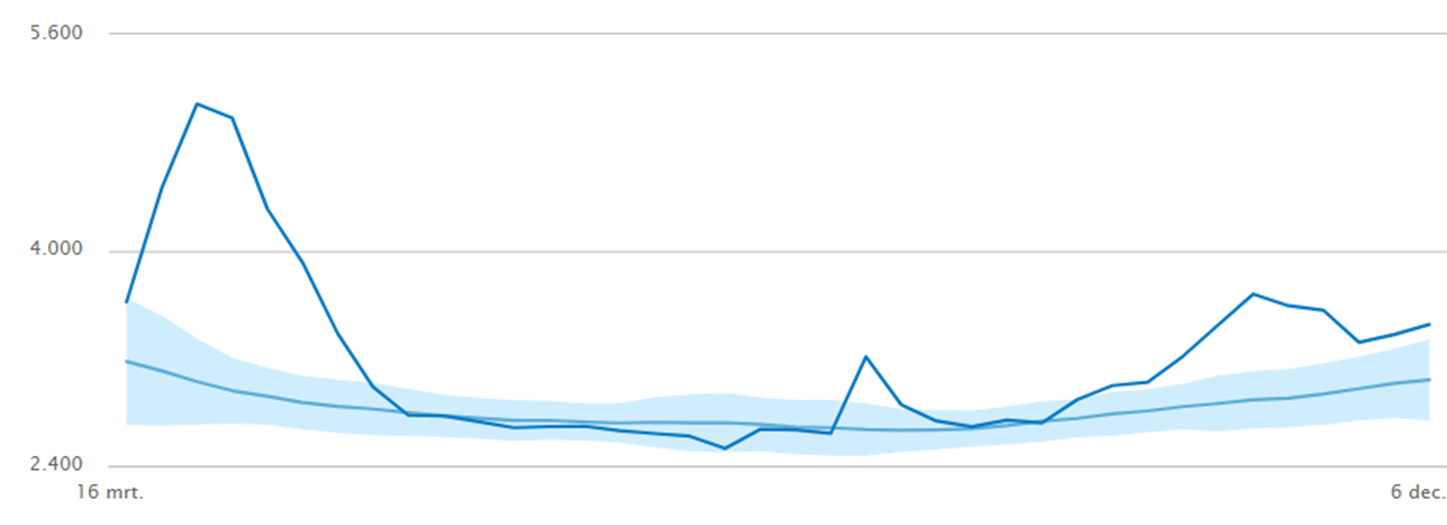
And then we see it again: on 29 December 2020 the excess mortality largely disappears again: the line fits neatly within the blue band. Sure until January 13 this bandwidth is depicted too broadly. I have not tried to track down later screenshots. I can't find any posts about this on Duckduckgo and Google.
So no trace of publicity or commotion about a wrong graph, but on 19 January 2021 it was OK again:

As far as I'm concerned, Kuipers is right about this: mistakes are corrected, even if no watchdog strikes.
But transparent? Hmm... like frosted glass then.
Take a look at that huge dip on the far right of the graph. This is communicated transparently in the explanation of that graph:
"Let op: Momenteel is door een technisch probleem in week 53 (28 december 2020 - 3 januari 2021) alleen de sterfte weergegeven van de eerste 4 dagen van die week. In totaal overleden er echter 4058 mensen in week 53. Er wordt aan gewerkt om deze week alsnog correct te tonen op het dashboard."
So no word about the temporary wrong bandwidth. We can no longer verify whether it was really communicated so transparently: it may have been on the site at the beginning of January, but it has gone unnoticed. The rest of his explanation is also correct: not only has it been restored, but given the period in which it took place (at the end of December) it will indeed have had the same reason:
"De fout is ontstaan bij het inladen van de prognoses die het CBS 1x per jaar maakt van de sterfte van het volgende jaar."
Minister Kuipers explains how the technical error occurs every year
I understand technocrats: technology makes the mistakes, that saves personal responsibility. No one is removed because of a technical error. This is not a technical error. This is a human error by a data manager who is pumping data without checking whether everything has gone well. It remains a miracle how two identical-looking graphs show the same thing (upper limit, lower limit, value) and that the value comes across perfectly but the bandwidth does not. While you would say that one has once taken over the code from the other. At least I hope it works that way and that it didn't have to be remade for privacy reasons. It's actually not a technical error. It's not a faltering Bluetooth connection or corrupted USB stick. It was once deliberately set up in this way - there will also be an explanation for this - and now has to be corrected annually.
Ik kan me voorstellen dat het Kuipers wat ver ging om te zeggen: "Ja hoor, die fout maken we elk jaar bij het inladen van de data van CBS en we weten precies hoe we dat moeten herstellen". Wordt alle output zo gecontroleerd? Niet echt bevorderlijk voor het vertrouwen.
Maar het lijkt mij dat er wel iemand flink op zijn falie heeft gehad daar bij VWS, afdeling dasboards. "Jij krijgt dit jaar voor straf géén vaccinatie meer!"
Message from Blckbx, with links to parliamentary questions and answers: https://www.blckbx.tv/corona/kuipers-wijt-wegmoffelen-oversterfte-op-coronadashboard-aan-technische-fout

I thought that the bandwidth has also changed. So that the excess mortality line remains in the blue area longer. So that it looks just like that, there is no extra expected excess mortality. But yes, when you change the upper and lower limit, during the game, you can also compare it badly with other years.
It is indeed about the bandwidth. Read the article of April 30, the link is at the beginning.
In 2022, we had excess mortality from week 13 to week 19 according to the latest data from week 19 (see bottom link). In all these weeks, mortality was above the 95% margin of uncertainty. Statistics Netherlands has had to adjust week 17 (from 3090 to 3114) and week 18 (from 3016 to 3082) upwards so that the message below is no longer correct.
https://www.cbs.nl/nl-nl/ni...
The newer data shows the higher mortality rates.
https://www.cbs.nl/nl-nl/maatwerk/2022/20/overledenen-per-week-provincie-en-gemeente-week-19-2022
When are they going to issue a press release that there has been excess mortality for 7 weeks now?
This upward adjustment of the mortality figures by CBS is constantly happening (until all the data is in), but strangely enough also downwards: e.g. in weeks 1 to 5 of this year, 69, 132, 105, 182 and 198 respectively were deducted after a week. You would expect that if not all the data is in yet, the numbers are too low. But maybe all those first numbers were typos.
It is also remarkable that sometimes months later numbers are changed (or "adjusted"?): e.g. the numbers of January were changed until April and May.
Indeed remarkable if the figures are lowered more than a few weeks later. What kind of explanation does CBS give? If the figures are still so uncertain, I expect CBS to also communicate this uncertainty in their press release. However, I have not been able to recognize that in their press releases. I think there was a legal obligation to report a death within a legal period. Is that true?
Why grades can also get lower after later inputs/corrections!
I myself work with data that is not really well organized. For that reason, you have to be very careful in the queries that you use the right extra filters. In a case of wrong or missing filters, it may be that numbers become higher than in reality. After correction, the numbers sometimes even become lower again. This is the case when data has multiple properties and you have to select or filter out the data with the right properties. For example, data is entered with a wrong date and later the date is restored to the correct one, the numbers of the data are then lower in the second version of the dashboard. In the database, for example, the dates contain both the old date and the new date, the new date has a characteristic of last valid date and the old date has the characteristic corrected. Absolutely, an item/record is duplicated in the database when you look at the dates, but with the correct filter "Last valid" you only see the correct and corrected dates on the correct date.
In other words, in a database, 1+1 is not always 2.
In the government, more and more analysts are hired who consult data through programs such as Python, R, etc. and have no or too little knowledge of the sources of the data. I think these programs are a bit limited because you can't really see through the data, but I may be missing something. What I think is often lacking is knowledge of the data itself and how does the data arise, what processes does it pass, what checks does it undergo and what pitfalls does it contain. My experience with the government is that they do nothing about data management. So the input is also immediately the data management that government data knows, at I&W this is very often the case as far as I know.
So don't expect nice graphs with government data in the coming decades as long as they don't set up good data management. In any case, the last (20) years they still don't do much (nothing?) about it, they even say that they prefer to buy data, well you don't know anything about the quality of course, but yes that has never been a problem with the government.
On this site many of my suspicions are confirmed and I think that the concept of data management in the government is very bad, it does not really exist and is mainly seen as an expense and no one is accountable. But the fact that even CBS could also fall under this shocked me a bit. Although I once had to provide data to CBS and they asked for data that we did not record or need anywhere. We were obliged to provide the data, so the survey was filled with fictitious data spontaneously made up from the gut. Now...
https://www.cbs.nl/nl-nl/nieuws/2022/22/in-mei-oversterfte-behalve-in-de-laatste-week
For May, CBS now admits that there was excess mortality in all weeks of May except for the last week. However, only an estimate is available.
week 21 estimate 2852
week 21 95% uncertainty limit 2958
I wonder if the actual figures are now within the uncertainty interval.
A puzzle;
https://www.cbs.nl/nl-nl/maatwerk/2022/22/overledenen-per-week-provincie-en-gemeente-week-21-2022
There is excess mortality during weeks 13 to 20 inclusive of the total population. According to a press release from Statistics Netherlands, this is mainly in the WLZ.
https://www.cbs.nl/nl-nl/nieuws/2022/22/in-mei-oversterfte-behalve-in-de-laatste-week
However, in the case of the WLZ, there is only excess mortality in weeks 13, 14, 15, 17, 18 and 20. For the rest of the population (not WLZ) this is only in weeks 14 and 15.
If we look at a different breakdown of men and women, we see that there is excess mortality in weeks 14 and 15 for men. For the women, however, it is weeks 13 to 20.
If we look at the age structure, we see the following;
0-65 excess mortality in weeks 1, 5, 13, 15, 16 and 18
65-80 excess mortality in weeks 1, 11, 12, 14, 15 and 18
older than 80 excess mortality in weeks 14 to 17
So the the press release should be excess mortality mainly in women. That should set off alarm bells. That will also be the reason that CBS does not report this either.
Definitie oversterfte van CBS; Er is oversterfte wanneer het geconstateerde aantal overlijdens van een bepaalde groep groter is dan 95% onzekerheidsbovengrens van die groep. De 95% onzekerheidsbovengrenzen van de diverse groep zijn te vinden in tabel 6 van de spreadsheet.