
Norm mortality 2.0: An exponential mortality model for analysis of excess mortality during and after the COVID-19 pandemic
We introduced the concept in April 2025Norm mortality. Standard mortality is a statistical model that estimates expected mortality per age and gender based on historical trends in mortality over the period 2010–2019. For example, the Norm Mortality Model detects deviations from historical trends. The statistical background has been published onResearchgate.
Thanks to advancing insights over the past year, we are able to make minor adjustments in a few areas. We will first briefly discuss the entire calculation procedure again.
Age cohorts
The basis for the Standard Mortality calculations is formed by:CBS figures for population compositionandDeaths. All figures are available by age, gender and year. We use the figures from the period 2010-2019 to calculate the trend during these 10 years. We then construct a regression line with an exponential progression for each age/gender combination. An exponential model fits better with the historically observed proportional decrease in mortality probabilities than a linear model, especially at higher ages. The difference between a linear and an exponential assumption also comes into play as time passes.
Number of deaths
Statistics Netherlands publishes annual updates on the numberDeaths. We have tables available that state the age the deceased would have been on December 31 of the year of death. This means that in this way the age is registered slightly higher compared to the actual age at death: on average half a year.

In this graph we see as an example the number of deaths of men aged 70 for the years 2000 to 2025. Without knowing the number of inhabitants in the relevant years, we cannot do much with this. We do recognize the corona in 2020 and the increasing age since 2000.
Number of inhabitants
We see the number of inhabitants for the same group in this graph, again as an example for 70-year-olds. Here we see the number of 70-year-olds continuously increasing in the left half until 2015. That is also what we call “aging”.

In 2016 we see a sudden increase: from 80,000 in 2015 to suddenly 110,000 70-year-olds in 2016. In 2016 these were the men born in 1946: the baby boom. We expect to see this effect in the death figures, but spread over two years, because anyone born in 1946 and who dies at the age of 70 can do so in 2016 OR 2017, depending on the date of birth and death. In 2015 the number of inhabitants was lower, because birth rates lagged behind during the hunger winter in 1944 or 1945.
Mortality
In the next step we calculate the mortality risk, again per age, gender and year. We again take 70-year-old men as an example.

Now we see a clear picture. The risk of mortality will gradually decrease from 2010 to 2019. Only for the year of birth 1946 does the mortality risk appear to be slightly increased. Without knowing the exact date of birth, we cannot determine the cause with certainty. It could be poorer life expectancy caused by the hunger winter, but it could also be an uneven distribution of births over the year. On Virusvaria is therea reviewof data.
Decrease in mortality
We see that the risk of mortality decreases with age at all ages. That was already part of the Norm Mortality Model, but now we are going to make it a bit more explicit. Because there is an exponential decrease, we can graph this annual decrease for each age and gender. We see that in this graph.
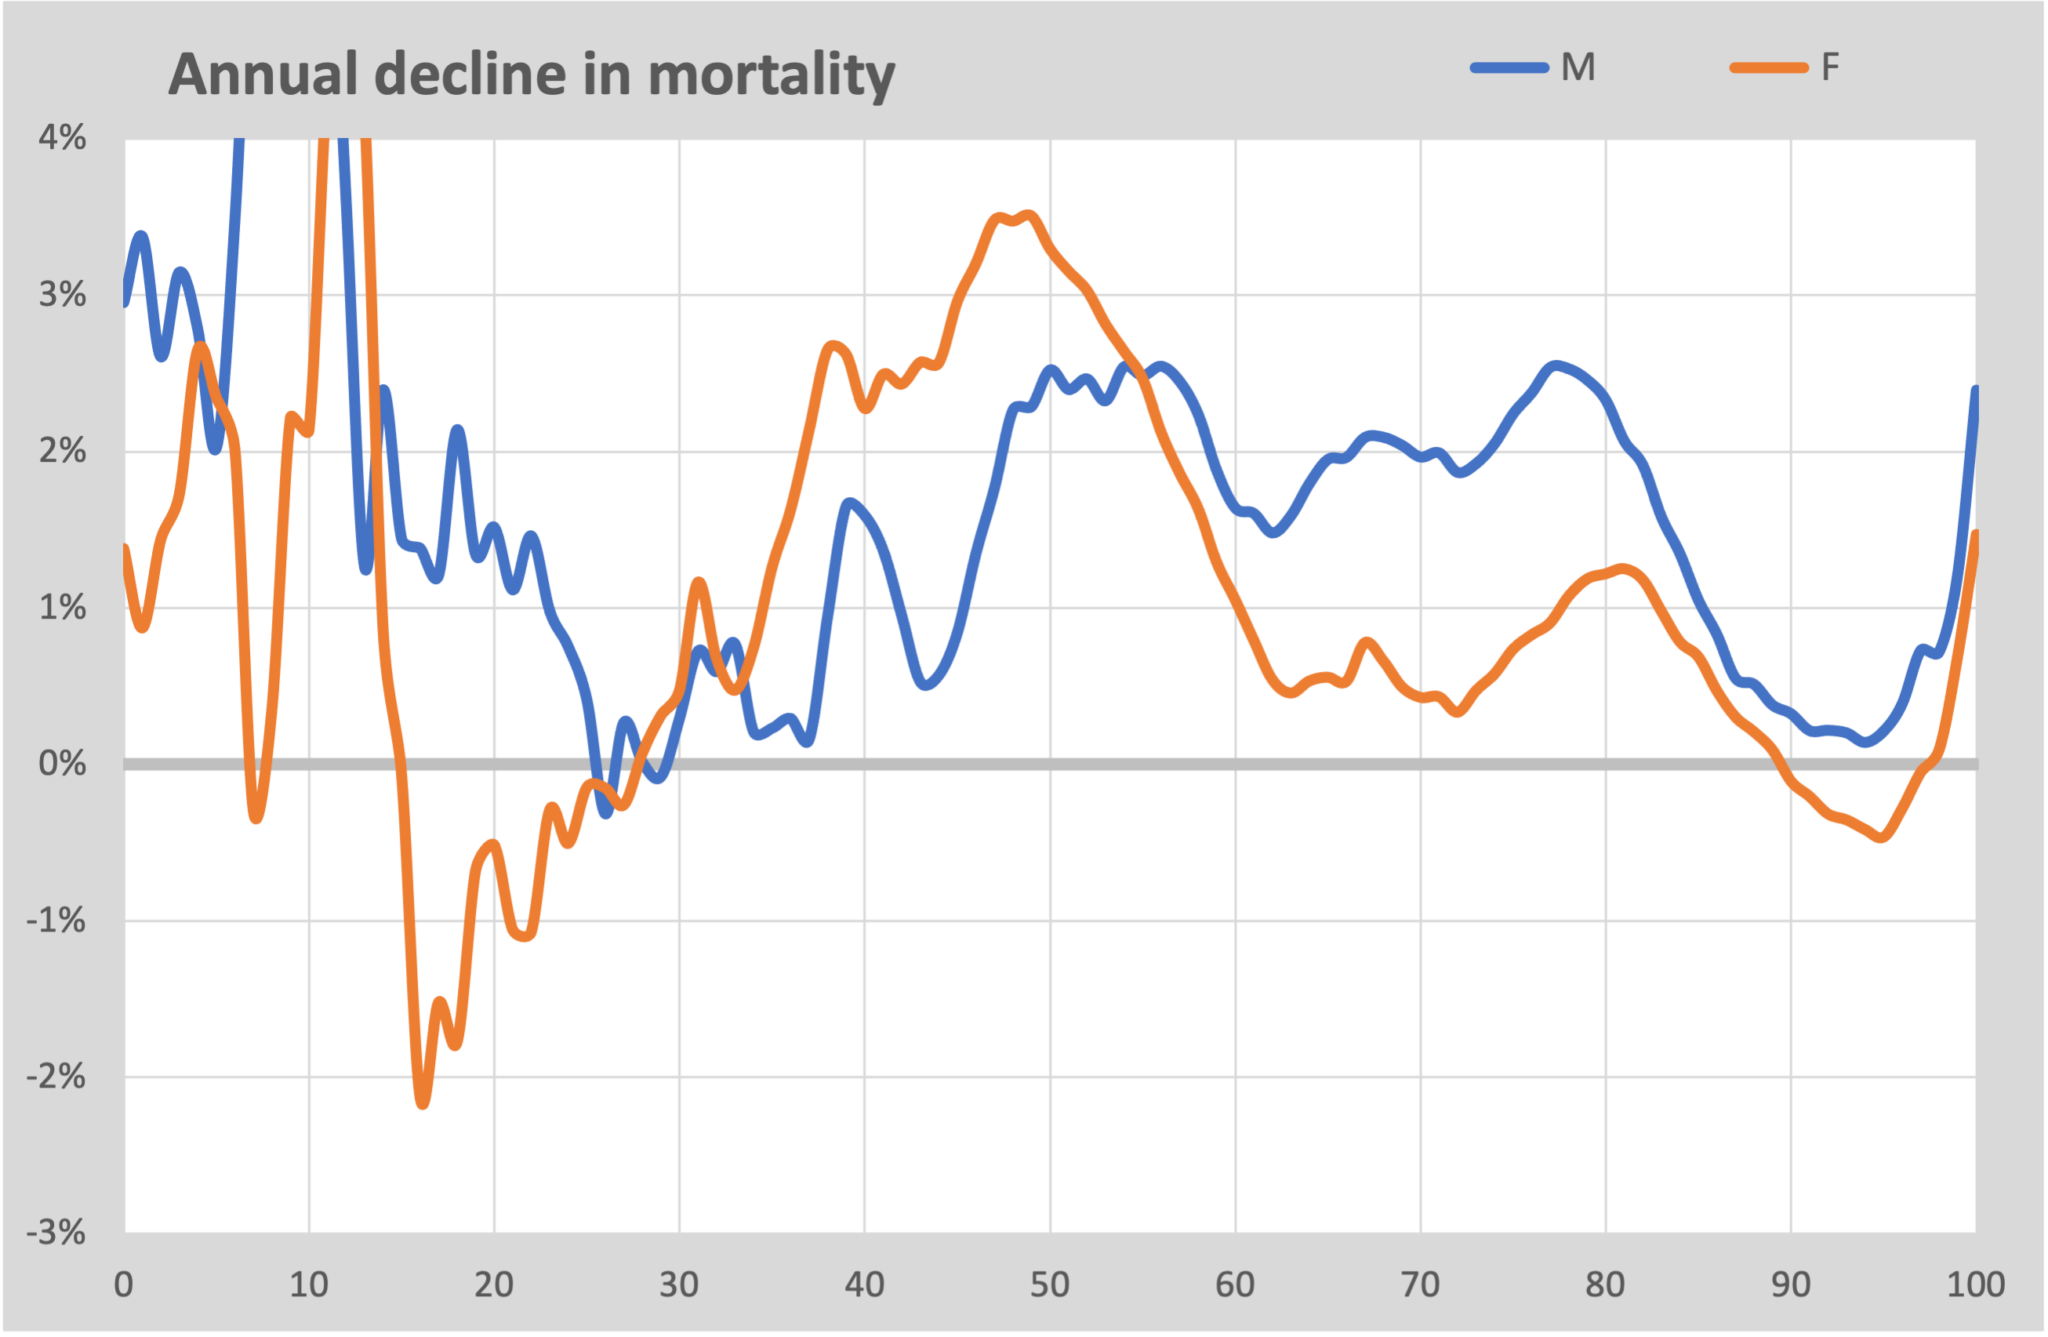
We see here that the decrease in mortality risk is greatest around the age of 80, or that is where the most health gains have been achieved over the past 10 years. But from the age of 90 there is no further improvement in the health situation. ThisseemsHowever, this may actually be a deception due to the low numbers at these ages.
We also see a clear difference between men and women in this graph. While men see an average of 2% improvement per year, this is less than 1% for women. We also see this reflected in life expectancy, where men are slowly catching up with women.
Below the age of 50, the fluctuations in the figures increase sharply. This is due to the low number of deaths for these ages. This concerns several dozen deaths per year of life. Only if we average over several years can we say anything meaningful about it.
Model
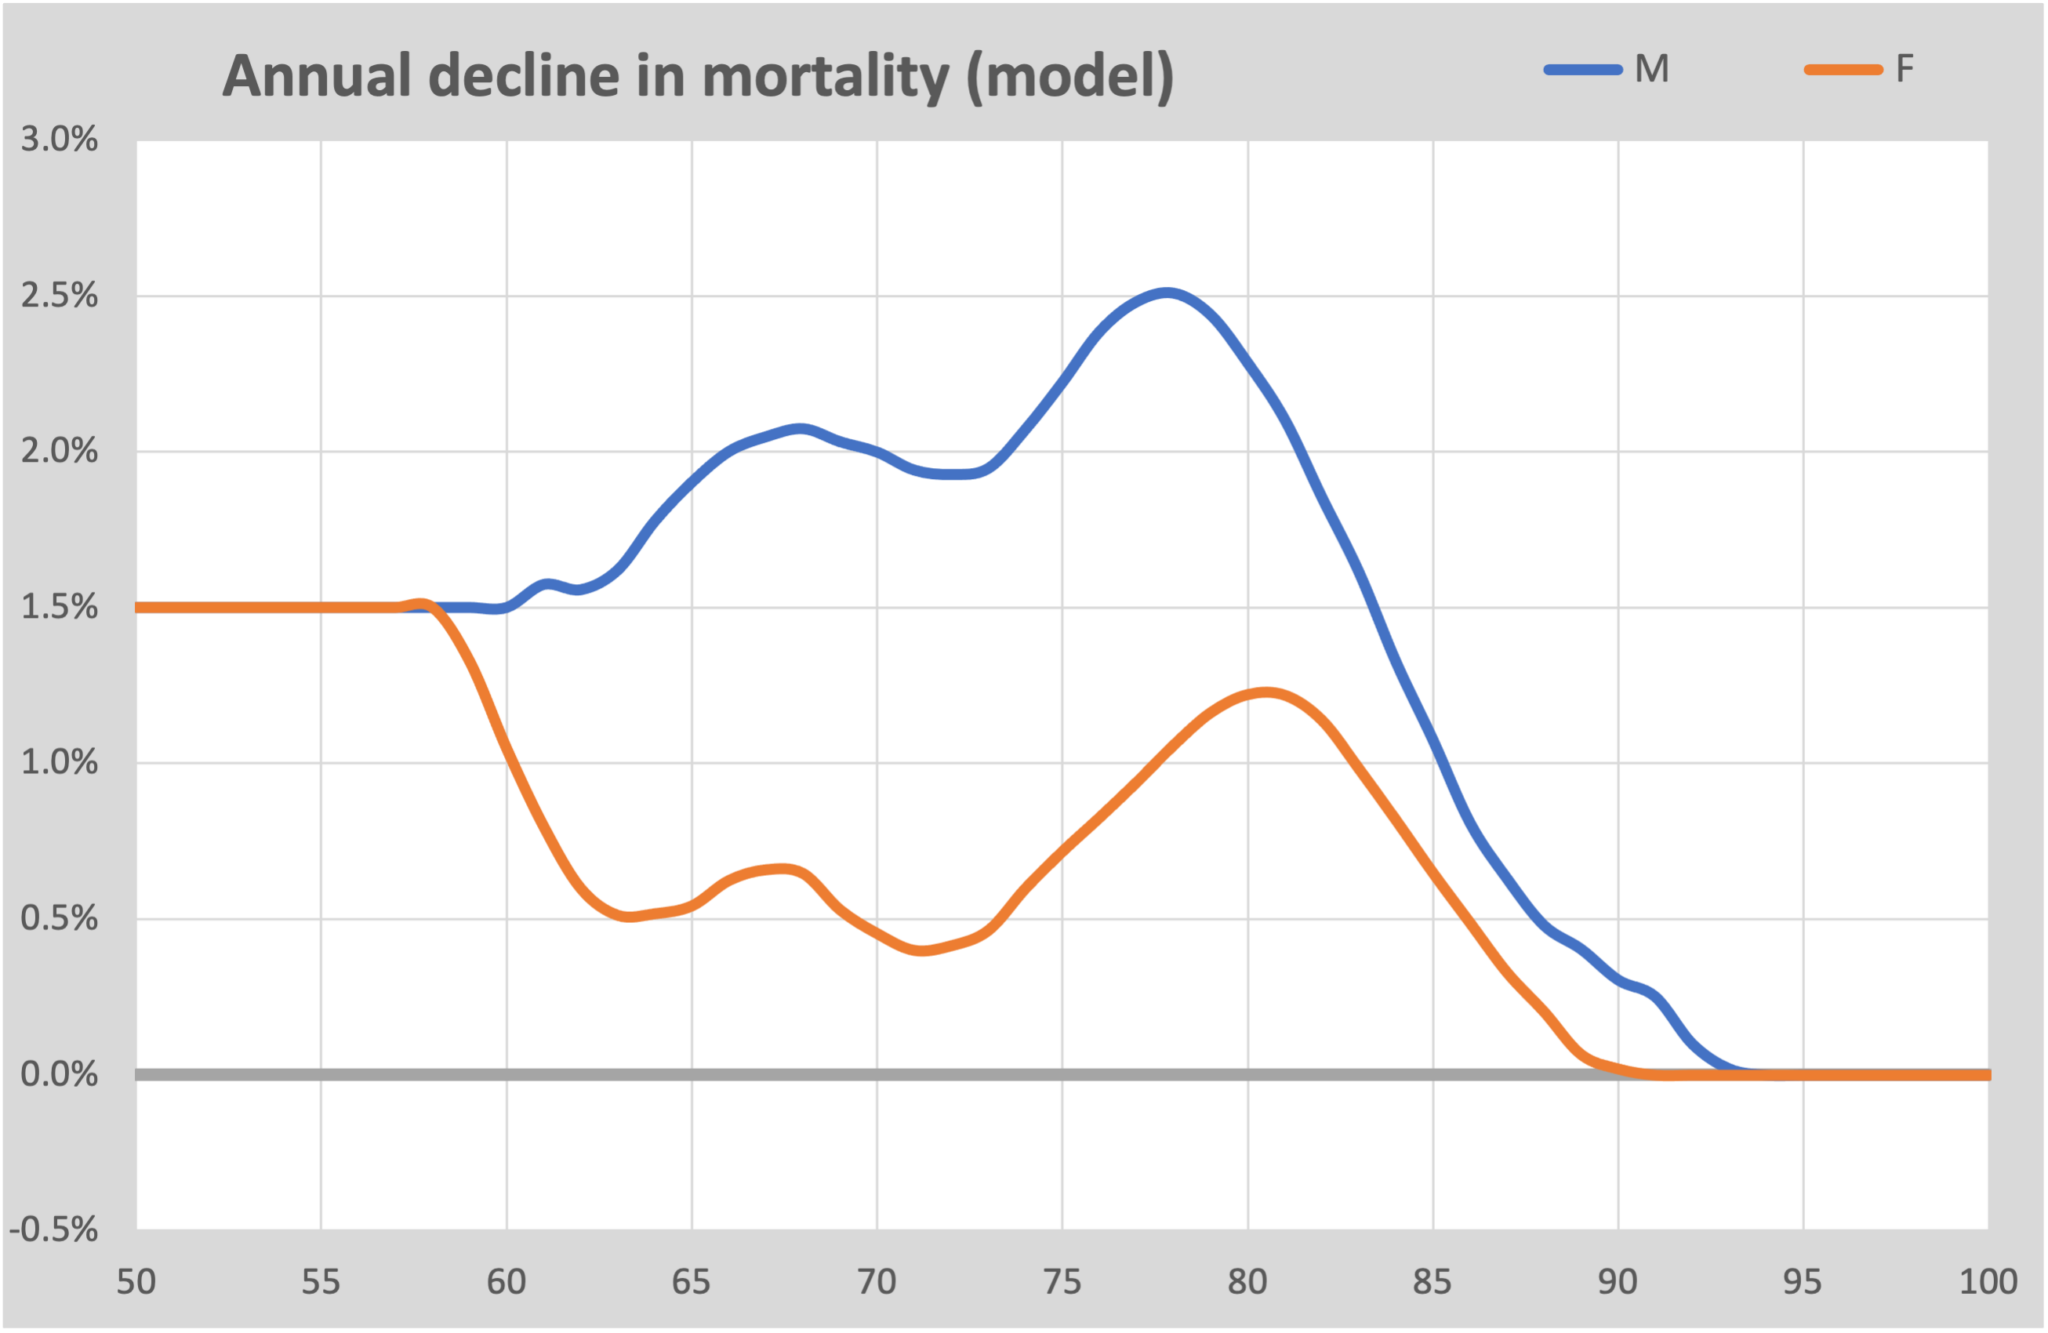
The calculated figures in the previous step serve as the basis for the final model. Apart from the exponential progression, two adjustments have been made:
- For ages under 55, the average probability of decline is used. This is approximately 1.5%/year. The numbers are far too small to use a separate value per individual age and therefore have no significant influence on the general mortality expectation.
- For ages over 90, the decrease in mortality risk is frozen at 0%. In other words, we assume that the mortality risk there is determined by the average mortality risk in the years 2010-2019 and will not decrease further. If there is a decrease, it is not observable.
We also apply a modest smoothing, by always taking the average of 3 years. This way we get rid of small imperfections in the curve.
From this model we can calculate a baseline for all 200 cohorts. These are tabulated and publicly available via the website.
Excess mortality
After we know the baselines (=norm mortality) for all 200 cohorts, we can calculate the excess mortality per year by comparing the annual number of deaths with this norm mortality. For 2020, the first corona year, this results in this graph:

The light blue area is the bandwidth that applies to the relevant age (calculated as the uncertainty in the number of deaths for the relevant age). A number of things immediately stand out:
- The excess mortality mainly occurs among those over 60 years of age.
- Women have around 10% less mortality from Covid-19 than men.
- Under the age of 50, excess mortality increases again as a percentage. But in absolute terms it only concerns tens per age. It stays just within the bandwidth.
If we look at this graph, we can actually conclude that corona mainly affected the elderly from the age of 65, young people rarely died from this.
The excess mortality in 2019 is also shown for comparison. We see that this remained neatly within the bandwidth. Even slightly below that and we also saw earlier that there was a slight under-mortality that year.
Next years
Below we compare the year 2020 with 2021, the year in which vaccinations protected us against the consequences of a corona infection. This graph shows the result compared to the first corona year.
A striking image. For all agesaboveOver the age of 75, mortality has fallen in 2021. This was already falling before vaccination had started. However, for most agesunderover the age of 75 we see an increase of 7-15% compared to mortality in the first corona year. The literature often points to the effect of vaccination for the decrease above the age of 75. There is currently no widely supported explanation for the increase under the age of 75.

We can make the same graph for, for example, 2024, compared to 2020.

The trend among the oldest generation has continued: there is no longer excess mortality, the lines fall within the bandwidth. But the ages at which excess mortality occurs has expanded. For women even under the age of 40, with more than 30% excess mortality. The good news is of course that the annual mortality among these younger women is around 75 deaths. It therefore concerns “only” a few hundred women who are in addition to the expected mortality.
More options
Because both the actual and expected mortality are known for each age-year combination, we can combine endlessly. For example, we can investigate the current situation with the mortality of women aged 20-40. We have already seen that this group has a significant excess mortality, but we can explain this better in this aggregated graph. However, we must note that the numbers are low and therefore the uncertainty is quite high.
The figures are now per 100K. We have seen a downward trend since 2010. From 2019 onwards we suddenly see an increasing trend. 2019 could still be a coincidence. 2020 showed an increase that largely coincides with the first corona wave. After that, the increase will continue. In 2025 we will indeed see 30% more mortality than we would expect based on the trend from 2005. In absolute numbers this is 8 per 100K. That's 200 women per year!

For example, we can make the same graph for men aged 60-69.
Here we see something special. In 2016 there is a kink in the baseline. To the right of the bend are all deceased persons who were born after 1946 and who have a more or less similar birth pattern (see the graph atBirths).

For the year 2010, the 60-65 year olds were born from the baby boom. The 66-69 year olds were born during the war and there were far fewer of them. Younger ages predominate in this cohort, which means that mortality is also somewhat lower. That's what we see here.
It is interesting to note that if we had worked with 10-year cohorts and determined a trend line through these 10 years, the illusion would have been created that the excess mortality for this cohort would have disappeared by 2023. The consequence of putting together cohorts in advance is that there will be a significant distortion in the level of the baseline and will therefore mask excess mortality.
Life expectancy
A commonly used measure for health development is life expectancy. This can be calculated in different ways, but the basis is always the mortality risk per age. With each year of life, the chance of being alive since birth slowly decreases. This is visualized in this graph for 4 decades since 2000:

We see here that the lines shift a little to the right every year: every 10 years we become one year older on average. If we look at the moment when half of the inhabitants have died (the gray dashed line at 50%), we see that that age will slowly increase from 81 years in 2000 to 85 years in 2030.
The most commonly used calculation method for life expectancy is a bit more complicated. We use the method that CBS also uses for this. We see here that in 2020 life expectancy for men fell by 0.9 years. In 2021 this was 1.0 years lower than expected and in the following years 0.7 years.

If the decline had only been the result of corona, you would expect (just like with the Spanish flu, for example) that life expectancy would have returned to the original forecast. The fact that this is not the case should be cause for further investigation.
Excess mortality
In the Standard Mortality Model, excess mortality is defined as the difference between the actually observed mortality and the expected mortality based on historical trends per age and gender.
This approach differs from methods that only compare with a historical average, because changes in population composition and long-term trends in mortality are also taken into account.

A positive deviation means that more deaths occur than could be expected based on historical development; a negative deviation indicates undermortality.
This graph has been corrected for “shifted mortality” in 2020 and 2021, also known as “undermortality after excess mortality”. This effect is described in the articleThe impact of mortality displacement during the SARS-CoV-2 pandemic. It is clearly visible that this (red colored) unexplained excess mortality starts in March 2021 and takes the place of corona mortality.
Limitations of the model
The Standard Mortality Model is based on the observation figures for the period 2010–2019. It is assumed that mortality trends would have continued after 2019 if major external disruptions had not occurred.
In addition, an exponential progression of mortality probabilities over time is assumed. Although historical observations support this approach, it does not provide certainty for future developments.
The model detects deviations from historical trends, but cannot itself provide causal explanations for these deviations. Factors such as pandemics, changes in care, demographics, lifestyle, registration, postponed treatments or vaccination effects may play a role.
For validation, the model was applied to pre-pandemic years. For 2019, the observed mortality largely remained within the calculated bandwidths.
Only in the longer term will it become clear to what extent mortality trends return to the historical pattern or whether there is a structural new equilibrium. On this basis, reconsideration of the parameterization of the Standard Mortality Model may be necessary.
Conclusions
The Norm Mortality Model allows us to create cross-sections in various ways to relate mortality to age and time. The calculation model is based on an exponential model, so that the mortality rate decreases more slowly. Although it has not been proven that this trend would have continued without corona, this assumption is preferable to other models that propose a different course from 2020. Only after a very long time will a stable situation arise that can form a new truth. Until then, any method of mortality forecasting remains dependent on assumptions about the continuation of historical trends.
All calculations are done in Excel and can therefore be shared by everyone. The file can be downloaded from our website via this link:Mortality model.xlsx.
The article was published on ResearchGate:Norm Mortality 2.0: An Exponential Mortality Model for the Analysis of Excess Mortality During and After the COVID-19 Pandemic.

I think that is certainly an improvement compared to version 1.0. The nuances at the end also testify to quality and reflection. Cheers!
Did you take 2 sigma = 95% for the bandwidth? That is a very big improvement in presentation of those lower ages. I've struggled with that too...
It would have been nice if you would also show the 95% band in the details (women 20 - 40). My impression, based on my graphs, was that there would not be much excess mortality left in 2024. But at a glance it obviously looks very bad for Pfizer. Unfortunately I have not yet taken/had no time to do what I announced earlier…. Because then I would have found that too.
I am still missing some kind of overall quantification of excess mortality per year after 2020 up to and including 2025.
We're not going to repeat the discussion, but I would like to note that in my estimation this is still a worst-case scenario. There have been inflection points in decline in mortality/100,000 earlier in time. It is not very unlikely that the historically relatively strong, almost straight downward line from 2010 to 2019 would have turned towards less decline between 2019 and 2026 if we had not seen a Corona...
Once again: we don't need to have that discussion again. Because! There is even a possibility that the trend towards a sharper decline would have started after 2019 as a result of our excellently functioning politicians with their wonderfully healthy new Wheel of 5, the environmental zones, the flight tax, and the blessings of the diverse society...
Hello Jan, thank you for your feedback! You say you don't want to repeat the discussion about the possibility of an inflection point, but I still want to come back to it. We will not know the definitive truth, but I see strong indications in the figures that the trend will continue.
1) There has been a very different mortality pattern since 2021. Waves, with the troughs more or less following the baseline. The image of an additional, temporary mortality on top of a trend, not of a stagnant baseline or something like that.
2) Life expectancy is increasing at the same pace as before 2020. But with a lag, caused by something that cannot yet be stated.
We will see what happens in some time, but I can see that the continuously increasing life expectancy will continue in that almost straight line for a while and will not have secretly turned a corner afterwards.
Prima.
Unfortunately, there remains deafening silence “outside” about the drama of 2021 – 2023……. Because that's exactly what it can be called!
.
Today the parliamentary inquiry committee really started externally. Persco & hearing for victims. Over 2 weken de verhoren. I fear it will be a cover-up survey. Even 100x worse than the Benefits scandal; which actually became more of a scandal when it was going to be “solved”!
Our government and therefore our taxes should be approximately halved. People simply have to arrange and solve their own affairs much more often.
I call that period and the aftermath a “Corona tragedy”, such as the excess mortality but also the accelerated increase in sick people. That increase would certainly have occurred without c-shots due to an unhealthy lifestyle (my hobbyhorse for years) but I clearly see a greater increase in sick people, even among people who have a healthy lifestyle. Sometimes I think gloomy "let them die because it is priceless... those who don't want to listen should just feel" but so many people have been put under pressure and everyone deserves to get a chance to heal or the relatives an explanation. Many are not interested in that because there is also such a thing as disease gain. Personal responsibility is hard work and fewer and fewer people feel like it. A well-known virologist from Belgium is involved in a battle within his own team, I just read in the online news, things are going hard. I do indeed expect a cover-up from the parliamentary inquiry committee, but if they start taking each other into account, this could easily become a breakthrough.
We'll just have to wait and see how the actuaries will present their next forecast table. It could again be a little less optimistic than the previous one – and that one was already less optimistic than the one before it. En die daarvoor was ook al minder optimistisch… etc.
They have a very strong financial interest, so they will not fool themselves... If they are too low, they will go bankrupt. If they are too high, a smart one of their members can take over the market.
I therefore think the most honest/reliable figures.
Another important difference: the actuaries are interested in the actual expected mortality. Just like the RIVM does, because insurance must be provided on that basis.
The countries with 'prolonged depression' (see article about country comparisons) also include France (in addition to Israel, where little can be expected: after all, Pfizer friend and I think Portugal and I think Austria).
Actuaries in France are also guessing wildly, I read in response to a question to AI: How do French actuaries explain the persistent excess mortality?
Fear that climate change will be blamed. Onze Kuipers is already busy 'manufacturing' the inquiry committee in this direction. See his recent report submitted to the WHO.
Genius can't say anything else: introducing a CO2 tax thus gets an extra motive and small-shot damage is conveniently explained away.
Nice work!
CBS and/or RIVM should do something about this...
Clear and reasonable. Thank you! It is certainly a good refinement of your model.
A detail: “In 2015, the number of births was lower,” -> the number of deaths was lower.
Corrected: “The number of deaths was lower in 2015, because birth rates lagged behind during the hunger winter in 1944 or 1945.”
Thank you!
Thanks for all the work guys.
These types of publications teach me time and time again that the fact is more important than the question of why something is the way it is (interpretation). Dachten ze bij het CBS ook maar zo. Life expectancy has not increased further since 2019, which is a fact as this article shows, made using CBS data.
And so, CBS says we have to work longer and longer because a modeler states that we are getting older (interpretation). Which feels very Orwellian, after all in 1984 the chocolate ratio was increased by -20 grams, didn't it? The Orwellian aspect lies in the fact (emphasis) that bureaucrats always do everything they can to ensure that their interpretation fits in with the issues of the day. We are getting older, even if we are not, and so we have to work longer.
Anyway, somehow I understand the idea of wanting to answer the why question. It is a more interesting question than the fact that 2+2=4, about which there is nothing more to ask.
So why has excess mortality persisted since 2020?
But there too the problem is that such questions may only be investigated by bureaucrats. And they know what the desired answer is, because they receive a subsidy for that!
The desired answer is: post-covid, right? (Emphasis on not true). In 2022, the department where I previously worked received a subsidy of around 30 million to map post-covid disease. The chief researcher published in 2023 that the 'vibe' in the department was good. My vibe would also be good if the government decided to transfer 30 million to my bank account. But I would feel a little less comfortable if the condition was that I had to flush that 30 million down the toilet every day in about 5 years with a team of intelligent young scientists. And that is what happened with the post-covid research in that department. Nothing has been published about post-covid research from that department since 2022, for the simple reason that what is not there cannot be found. And so the snake of wishful thinking bites its own tail and eats itself. That's what you get from wishful thinking.
Dank voor al dit rekenwerk, wat ik maar gedeeltelijk begrijp maar waarvan ik wel de uitslag als voldongen feit aanvaard.
Iets meer kennis heb ik over de mogelijke oorzaak van deze oversterfte ,wat in de onderstaande video wordt uiteengezet.
Kernpunten in deze video :het massaal injecteren bij de bevolking van een niet getest vaccin.
Het blijkt dat er na een gebruik van 2 jaar zeer schadelijke en dodelijke toxische effecten vastgesteld konden worden van het Lipid Nano Particle (LNP) en het bacterieel DNA ,aanwezig in het massaal gebruikte corona mRNA vaccin.
Omdat de Duitse corona enquête niet volledige transparantie oplevert en gezien het feit dat doorlopende gebruik van het schadelijke mRNA vaccin nog altijd gezondheidsschade oplevert ,wordt een proces met miljarden schadevergoeding overwogen ter compensatie van de nog levende slachtoffers. Essentie van de aanklacht hierbij is: Europa heeft bij de aankoop van het mRNA vaccin een ander vaccin geleverd gekregen dan besteld was.(In het oorspronkelijk bestelde vaccin ontbrak bacterieel DNA)
https://youtu.be/jhJrO8nVKks
Ook de Canadezen gevaccineerd met een niet getest mRNA coronavaccin?
https://youtu.be/Zv-eySq12mU
They did the bait & switch everywhere, right? (Is my reasonably informed impression). I think only our own employees received the actually tested formula. Right?
Maurice and Marianne will provide broadcasts to guide us through the parliamentary corona survey. They talked about guest invitations that won't make it into the official survey. I recommend Anton and Herman, among others, to come and speak about standard mortality! Do more people think that's a good idea? Something will have to be done as an “antidote” because what I am now seeing in the mainstream media makes me very sad despite my confidence in Maurice de Hond (if he gets the chance to not only mention ventilation).
I am available, but I wonder whether we fit into the PE's “desire picture”.
To avoid disappointment, it is advisable to temper expectations: the PEC is not a scientific panel. Charts and Standard Mortality are outside their scope. Their scope is: protocols, whether or not procedures have been followed, determining whether legislation and substantiation had been amended in time to justify the policy. And that was generally the case. So that's fine!
The issue will be whether politicians have acted adequately based on the current situation at that time. “The functioning of the House of Representatives”.
The PCR tests, for example, were an indispensable indicator. As soon as the experts suspected a resurgence of the virus, testing was of course intensified and it usually turned out that they were right. There is no reason to doubt this, not even from the documentation made available to the PEC.
Plus, it was also in the newspaper, so it was just right. That's the level.
Expected 'Critical questions'
– were the lockdowns too late? (Answer: not perfect, but with the knowledge of the time: excellent.)
– have the face mask deals been tendered correctly? (Important point of criticism because Sywert. The Commission must take a strict look at this.)
– were there sufficient PCR tests? (In general yes, compliments!)
– why did the Netherlands start vaccinating later than neighboring countries? ("Force majeur")
– has the government properly followed the advice of the OMT? (👍)
– was the implementation legally supported? (after various changes in legislation and regulations: most certainly!)
- etc. etc.
They better not invite me, that could only disrupt the carefully prepared money laundering operation.
That is why I request you to visit Marianne and Maurice. They can also make their voices heard in the mainstream media and make money laundering less clean. Thank you in advance ☺️
After Marion Koopmans (not everything because I can't handle that), I just listened to Bruno Bruins for a few minutes, I fell for it when he said "hantavirus" and then his imagination ran away with him, it seemed like "Chinese visiting the Keukenhof were discriminated against and that was discussed in the second room..." The Keukenhof did NOT open in 2020! “Measures” had been taken at airports (in my own words because I had just climbed back into my seat). No, Mr. Bruins, half of my environment works at airports and they were even the last with plastic screens and other nonsense against large drops. Many people were laid off at airports because they were NEVER needed anymore... So this was the PEC for me because even though we knew this in advance, I did not expect it to be so imaginative.
In the broadcast "Virus of Tomorrow" Ron Foucher answers the question: when did you first hear about this virus? We heard this very early, just after Sinterklaas. This was a joint interview with Marion Koopmans. In the inquiry committee on 29-5-2026, Marion Koopmans was asked the same question and she answered that it was on New Year's Day 2019 that she heard about it. Proclaiming untruths seems to be the characteristic feature. of this survey
Theoretically, of course, that could be true. You hear about it, but assume that it takes decades for drops to make the journey to Europe 😉
But this is going to be a very interesting interview.
I wrote on X:
The Great Blame begins. Virologist Koopmans: “The Cabinet put us under time pressure.”
Epidemiologist Alma Tostmann: Every day of lockdown delay is a century.
The tone seems to be set!
What you say is true, but there is also a kind of hopelessness that follows. Like: 'Just accept it, there's nothing you can do about it!' In that respect I agree with C, ie that an active counter-narrative could be useful. Just put a spoke in the wheel! By the way, I have no illusions that Maurice de Hond will do that for 'us'. And even if he wanted to, I don't think he could do it for 'us'. It is much stronger to do your best yourself and actively inform the PE yourself. If only everyone would do that, instead of wanting to be an audience where you watch the spectacle with popcorn in your hand, where a warrior like Maurice the Dog etc. makes it difficult for the PE. Infantile game. Bread and Games! It's like the ballad of Roosevelt by Langston Hughes (look that up) where the audience sits quietly in the hope that a hero will solve it for them. Then you can wait a long time, even if you are dealing with a hero!
Regarding whether the procedures have been followed 'properly' (something the PE will grill the policy makers about), after I had my say for the first time at Wybren (in 2024), I received a tip from some readers (including Cees, thanks Cees!) to actively inform the PE about my experiences (in following procedures) in the emergency room around March-May 2020. At the time I actually didn't feel like doing that, I knew the PE's answer as well. yes. Still, I sent them a note to which I… didn't even get a response!
In retrospect, I think it was the right choice that I informed the PE about not following old procedures when diagnosing the new disease*. NOT answering me must have cost them some effort. Just as it took the PE effort (two years of preparation) to ask the 'right' questions to all those policy makers, without it immediately becoming clear that Covid was a big farce with deadly consequences thanks to those policy makers. What I want to say is this: it is not the PE that is meaningless, but those who shaped the PE into what it is today, those people are meaningless! It is absolutely right that Gideon van Meijeren did not want to get involved in that case.
* which made it seem as if the new disease made all the old diseases disappear (with all the deadly consequences that entails). In medical terms this is called negligence and that is a punishable concept that should DEFINITELY be discussed during the survey.
That's right Willem, I have also done this many times with letters, emails, etc. Substantiated in a very modest way, figures included, etc. What did I sometimes get in return: "It is your own frustration because your children lost their jobs AND family members (but of course that could not be due to the measures) and even more strange statements, blah blah blah..." This is how I came up with a list and is now called 'c' where I entrust Anton with my e-mail address. After the craziest years, I try to relax regularly (often it works quite well), but lately I've been getting the feeling that those crazy years are all around us again. Viruses are being brought out of the stable, Ernst K and others are back on mainstream media, etc. Yesterday a walk with a friend, halfway onto a terrace, under a parasol with a nice breeze from the water and while listening to this person with terrible new stories (after all the misery I had heard before) about: bacteria that won't go away, shingles, stomach cancer, liver problems, etc. in this friend's circle, the staff came every 10 minutes to ask if we were not succumbing to the heat with words like “Are you still okay?” “At your age” (barely 60+, fit walkers…) and unfortunately I saw that the friend was completely caught up in the hysteria. On the way back, I made some attempts to reassure myself about the heat, which I did not feel, but this friend suddenly did... the stories about illness kept coming and I suddenly even heard myself recommending a "skin scan app" because I now understand this person's extreme fear of serious illness because, as this friend himself said, "I could easily be next...".
Any non-pure blood (not injected) could be next, to put it viciously. Sad, but true.
I wish it were different.
I wish that the knowingly perpetrators would be brought to justice, but... not so.
Where? I find that much more interesting than this nonsense with Maid Marion who calls us hateful conspiracy theorists. (With the ridiculous strawman conspiracies widely reported and the actual scheming and coordination with Fauci carefully kept out of the picture and undoubtedly not questioned. Sigh.)
The inquiry committee could have asked by which bodies Marion Koopmans was financed: Below is an advertising brochure from 2021 showing that Erasmus was partly financed by Ecohealth Alliance (Peter Daszak (and “Tony Fauci”)) (I cannot publish existing evidence of the financing of this closely involved cooperation)
Covid19 department
Department
Viroscience
Our mission is to limit the clinical and public outcomes of high-impact virus infections through an integrated field-to-bench-to-bedside research program.
Influenza Surveillance Newsletter (Dutch only)
Latest newsAll Viroscience news
podcastbanner
November 20, 2020
Virus Facts (all episodes)
When it comes to the coronavirus, you mainly hear about measures and opinions. What you hear much less are the facts. How far advanced are scientists in their fight against corona. What they learn every day about the virus and about the best way to fight it.
Banner background blue
November 25, 2021
VEO report on mutations and variation in publicly shared SARS-CoV-2 raw sequencing data
VEO submits the ninth report on mutations and variation in publicly shared SARS-CoV-2 raw sequencing data.
scientificpublicationsbanner
November 25, 2021
mRNA-1273 COVID-19 vaccination in patients receiving chemotherapy, immunotherapy, or chemoimmunotherapy for solid tumours: a prospective, multicentre, non-inferiority trial
scientificpublicationsbanner
November 25, 2021
Age-seroprevalence-curves-multi-strain-structure-influenza A virusNews
scientificpublicationsbanner
November 25, 2021
The race to understand ‘immune amnesia’
Scientists have known for years that measles can alter the immune system – but the latest evidence suggests it’s less of a mild tweaking, and more of a total reset.
scientificpublicationsbanner
November 25, 2021
Seasonal coronavirus–specific B cells with limited SARS-CoV-2 cross-reactivity dominate the IgG response in severe COVID-19
youtubebanner
November 25, 2021
Presentation of the Paul Nijgh medal
Video with Claudia Smulders and her fellow lab technicians, virology department at Erasmus MC
tv banner
November 18, 2021
The-Heart-of-Rotterdam
In the middle of Rotterdam you will find the Erasmus Medical Center, not only an academic hospital but also a breeding ground for scientific research. In eight episodes, Rijnmond speaks to scientists, doctors, students and patients. Who could suspect that so many discoveries in healthcare come straight from the heart of our city?
banner news
November 5, 2021
WHO unveils new 26-member panel to restart study of the pandemic’s origins
Permanent advisory group will also investigate future outbreaks and epidemics
About our department
Our research
Reference Centers
Research Lines
Principal Investigators & Postdocs
Projects
Notable results
Collaboration
ECO Health Alliance – The Department of Virology is closely involved in the Eco Health Alliance.
NCOH – The Department of Viroscience is one of the founding partners of NCOH, in addition to Utrecht University, Wageningen University & Research Centre, University Medical Center Utrecht and Academic Medical Centre Amsterdam.
NORONET – The Department of Virology of the Erasmus MC is partner of NoroNet., an informal network of scientists working in public health institutes or universities sharing virological, epidemiological and molecular data on the norovirus.
OVIT Consortium – The OVIT consortium is a Dutch consortium with a focus
Ecohealth, Chapel Hill, GOF, sneaky biological warfare research with huge profits from silence for those involved.
Maid Marion, Robin Fauci & Friar Daszak.
A true-life Disney horror movie. Silent Hill is nothing like it. Fewer victims.
It’s a Brave New World. Animal Farm.