Who Kaplan-Meier voor Dummies understands what the "belly" of a Kaplan-Meier graph says. Recently I was shown an Italian study in which a similar graph was shown. Here too, as with Nivel, the conclusion was that the vaccines had not caused mortality and that the excess mortality was among the unvaccinated. We first look at the Italian approach and then compare the findings with the Nivel report.
Kaplan-Meier 1: Italy
Italian study: COVID-19 vaccination not associated with an increase in mortality or selected PVR-SAEs incidence.
Are we worried about nothing? Are vaccines absolutely safe? According to experts, this is evident from everything: the situation in New Zealand, for example (which I here with ChatGPT) and a thorough, peer-reviewed, academic research from Italy would be decisive. The data comes from the Italian demographic databases and databases of hospital admissions for the period from January 2, 2021 to July 31, 2022.
The researchers of that peer-reviewed article in Vaccines | Like Nivel, came to the conclusion that mortality among vaccinated people was no greater than among unvaccinated people. 1did not show an increased risk of all-cause death, non-COVID death, or any PVR-SAEs, as compared to the unvaccinated A glance at the Kaplan-Meier graph makes it clear that there may be something to be bargained for.
They have made corrections to a number of comorbidities, including Covid-19, but write at the end of the strengths and weaknesses:
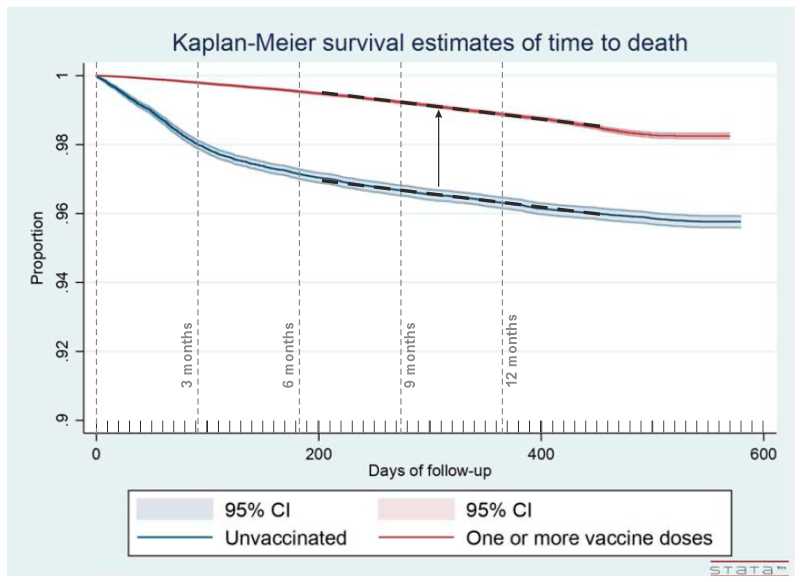
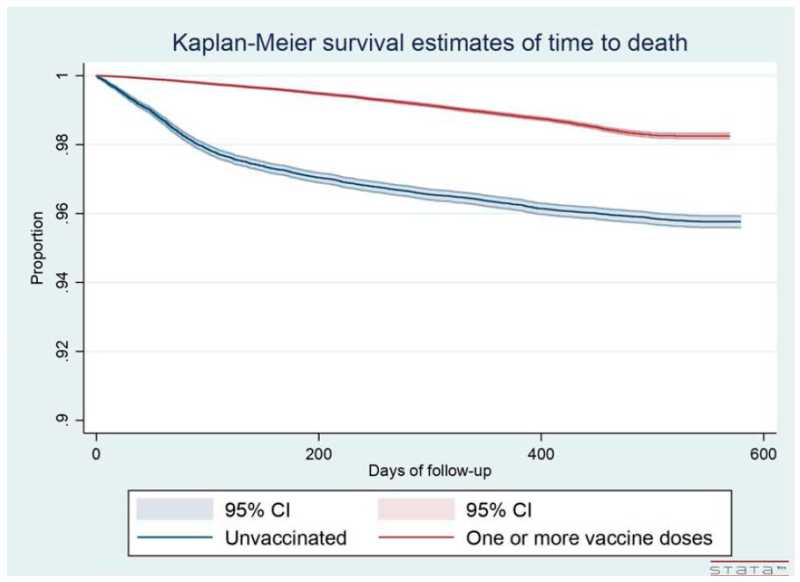
“… there may be disruption from the Healthy Vaccinee Effect, where vaccinated people are expected to engage in less risky behaviours."2there may be confounding due to the healthy vaccinee effect, wherein vaccinated people may be expected to adopt less risky behaviors It's really like this, see dangerous. That didn't seem like a good explanation to me and my well-read friend confirmed that. And despite that, we are just presented with this graph:
It is striking that this graph is shown in a report that aims to show that vaccination does not lead to mortality or serious side effects. Apparently, this cannot be achieved without leaning on the difference with the less healthy unvaccinated. That difference is interpreted as positive for vaccinations.
Only after about 7 months do we see a stable ratio in straight lines. And they run parallel to each other: no difference at all! But the first 7 months, that "HVE belly", count in the calculations because only the totals after a year and a half are compared. Then you get Nivel-like outcomes. The conclusion of the Italians is therefore obvious:
"In conclusion, COVID-19 vaccination was not associated with an increase in mortality or selected PVR-SAEs incidence. Further research is needed to evaluate the long-term safety of COVID-19 vaccines."
Quite a lot if you include the "Unhealthy Non-Vaccinee Effect". Then the vaccinated always come out better.
This study exploits the Unhealthy Non-vaccinee effect to prove the safety of vaccines. Something that the literature (e.g. in the excess mortality report by Meester/Jacobs) explicitly warns against.
"Further research in the coming years will be required to evaluate the long-term safety of COVID-19 vaccines."
You can say that again...!
Red flags for the enthusiast
The tables contain other worrying signs that deserve further investigation. They should have been given a little more attention in this research report, which had the objective of detecting possible damage (SAEs).
I'll make short bullets out of it here. For those who want to check: in the table below, the relevant cells are highlighted in yellow.
- Among the people who had had 1 jab, the number of deaths was 1.74%
- Among the people who had had 2 jabs, the number of deaths was 3.52%
“COVID-19 vaccination not associated with an increase in mortality“…? Maybe because of the following:
- With 3 and more injections: 0.65% deaths
[I assume that the difference between 1 and 2 jabs is not because 1-jabbers only had a few weeks and 2-jabs had much more time at their disposal (people usually work with person-years). It seems that people who lived through to injection 2 without any significant side effects were also much less sensitive to those later injections. AT]
- People with SARS-CoV-2: 1.11% deaths
- People who were not infected: 2.18% deaths
Twice as many deaths among the uninfected!? So why vaccinate, you might say.
- Janssen and AstraZeneca showed 2 to 5 times higher mortality than other vaccines.
- Janssen and AstraZeneca showed 2 to 5 times as many serious side effects as other vaccines.
How could these vaccines appear on the market in the first place?
- Of the people who received 1 dose, 0.25% developed myocarditis (1 in 400! Unlikely numbers... I read that right, didn't I?)
- Of the people who received 2 doses, 0.38% developed myocarditis (about 1 in 300!)
- For 3 or more injections: 0.09%
[Later doses may have only been taken by people who were not affected by the first two doses. And the elderly are much less susceptible to myocarditis. AT]
Same question: The 'power' of the trials was sufficient to signal side effects that occur on this scale. What went wrong there? Where were the regulators, the FDA, the EMA, the MEB?
Table 2 in the Italian report | ||
| Deaths by COVID-19 vaccine status | ||
| Total sample size | 316,315 persons | |
| Unvaccinated | 56.494 | 4.23% deaths |
| ≥1 dose | 259.821 | 1.29% deaths |
| 1 dose | 15.832 | 1.74% deaths |
| 2 Doses | 51.684 | 3.52% deaths |
| ≥3 doses | 192.305 | 0.65% deaths |
| Deaths by infection status | ||
| Uninfected | 207.721 | 2.18% deaths |
| Infected with SARS-CoV-2 | 108.594 | 1.11% deaths |
| Deaths by age | ||
| 0-29 years | 76.044 | 0.03% deaths |
| 30-59 years | 141.563 | 0.26% deaths |
| 60 years of age or older | 98.708 | 5.42% deaths |
| Deaths by sex | ||
| Women | 161.727 | 1.80% deaths |
| Men | 154.588 | 1.84% deaths |
| Deaths by vaccine type | ||
| bnt162b2 | 118.037 | 1.84% deaths |
| mRNA-1273 | 41.646 | 1.64% deaths |
| ChAdOx1 nCoV-19 | 2.235 | 3.27% deaths |
| JNJ-78436735 | 549 | 4.37% deaths |
| NVX-CoV2373 | 147 | 0.0% deaths |
| Mixed | 97.207 | 0.41% deaths |
| Potential vaccine-related serious adverse events (PVR-SAEs) | ||
| Total sample size | 316.315 | 0,66% PVR-SAE’s |
| Niet-gevaccineerden | 56.494 | 0,97% PVR-SAE’s |
| ≥1 dose | 259.821 | 0,60% PVR-SAE’s |
| 1 dose | 15.913 | 0,88% PVR-SAEs |
| 2 doses | 52.067 | 1,57% PVR-SAE’s |
| ≥3 doses | 191.841 | 0,31% PVR-SAE’s |
| PVR-SAE’s naar infectiestatus | ||
| Uninfected | 207.721 | 0,72% PVR-SAE’s |
| Geïnfecteerd | 108.594 | 0,56% PVR-SAE’s |
| PVR-SAE’s naar leeftijd | ||
| 0-29 years | 76.044 | 0,02% PVR-SAE’s |
| 30-59 years | 141.563 | 0,20% PVR-SAE’s |
| 60 years of age or older | 98.708 | 1,83% PVR-SAE’s |
| PVR-SAE’s naar geslacht | ||
| Women | 161.727 | 0,54% PVR-SAE’s |
| Men | 154.588 | 0,79% PVR-SAE’s |
| PVR-SAE’s per vaccintype | ||
| bnt162b2 | 118.135 | 0,82% PVR-SAEs |
| mRNA-1273 | 41.657 | 0,52% PVR-SAEs |
| ChAdOx1 nCoV-19 | 2.304 | 4,30% PVR-SAE’s |
| JNJ-78436735 | 551 | 1,63% PVR-SAE’s |
| NVX-CoV2373 | 147 | 0,68% PVR-SAE’s |
| Mixed | 97.027 | 0,26% PVR-SAE’s |
| Myocardinfarct naar COVID-19-vaccinstatus | ||
| Totaal steekproef | 316.315 | 0,15% myocardinfarct |
| Unvaccinated | 56.494 | 0,12% myocardinfarct |
| ≥1 dose | 259.821 | 0,16% myocardinfarct |
| 1 dose | 15.862 | 0,25% myocardinfarct |
| 2 Doses | 51.816 | 0,38% myocardinfarct |
| ≥3 doses | 192.143 | 0,09% myocardinfarct |
| Hartstilstand naar COVID-19 vaccinstatus | ||
| Total sample size | 316.315 | 0.15% cardiac arrest |
| Unvaccinated | 56.494 | 0.39% cardiac arrest |
| ≥1 dose | 259.821 | 0.10% cardiac arrest |
| 1 dose | 15.832 | 0.16% cardiac arrest |
| 2 Doses | 51.688 | 0.27% cardiac arrest |
| ≥3 doses | 192.301 | 0.05% cardiac arrest |
| Key outcomes by COVID-19 vaccination and infection status | ||
| Never infected | 207.721 | 2.18% deaths, 0.72% PVR-SAEs |
| Infected before vaccination | 33.815 | 2.39% deaths, 0.79% PVR-SAEs |
| Infected after vaccination | 97.374 | 1.21% deaths, 0.61% PVR-SAEs |
| Adjusted hazard ratios (HR) for death and PVR-SAEs indicate lower risks for vaccinated individuals compared to unvaccinated individuals. | ||
Kaplan-Meier 1I: The Netherlands
Nivel report: Excess mortality during the COVID-19 pandemic – Study of people with and without COVID-19 vaccination
In het veelbesproken Nivel-rapport zijn er twee meetpunten: het eerste op 3 maanden en het tweede op 12 maanden na vaccinatie. De ontwikkeling per dag of per week komt niet voor in de studie. Vergeten? Niet belangrijk?
However, the first quarter is analysed separately. Could they be expecting more deadly side effects in the first three months? Then you shouldn't have to correct them away with increased expectations. You'd like to find something like that right.
In most age groups, the Nivel researchers expect a slightly higher mortality in the first 3 months than in the reference period. In the vaccinated only a little higher and why that is we do not read, it will have to do with corrections and weighings.
For the unvaccinated, the mortality expectation is therefore higher than the reference period. This looks like an attempt to correct for the Healthy Vaccine Effect: removing the expected excess mortality in people who did not receive the jab, for example because their date of death was approaching. After three months, that period will be over, they may have thought. But is that so? They could have seen that in their data. And even then, instead of months 1-3 and 1-12, they might have been better off reporting month 4-12. Otherwise, they will unjustly take the HVE with them in favor of the safety of the vaccinations.
If you expect an HVE, you cannot detect possible mortality due to vaccination by comparing with unvaccinated people. This is only possible if the study population is carefully composed, which is simply not the case with observational research.
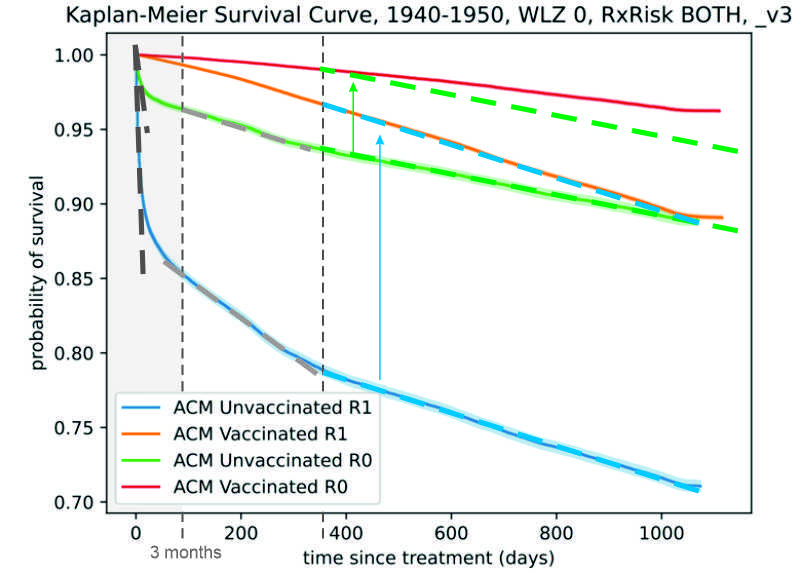
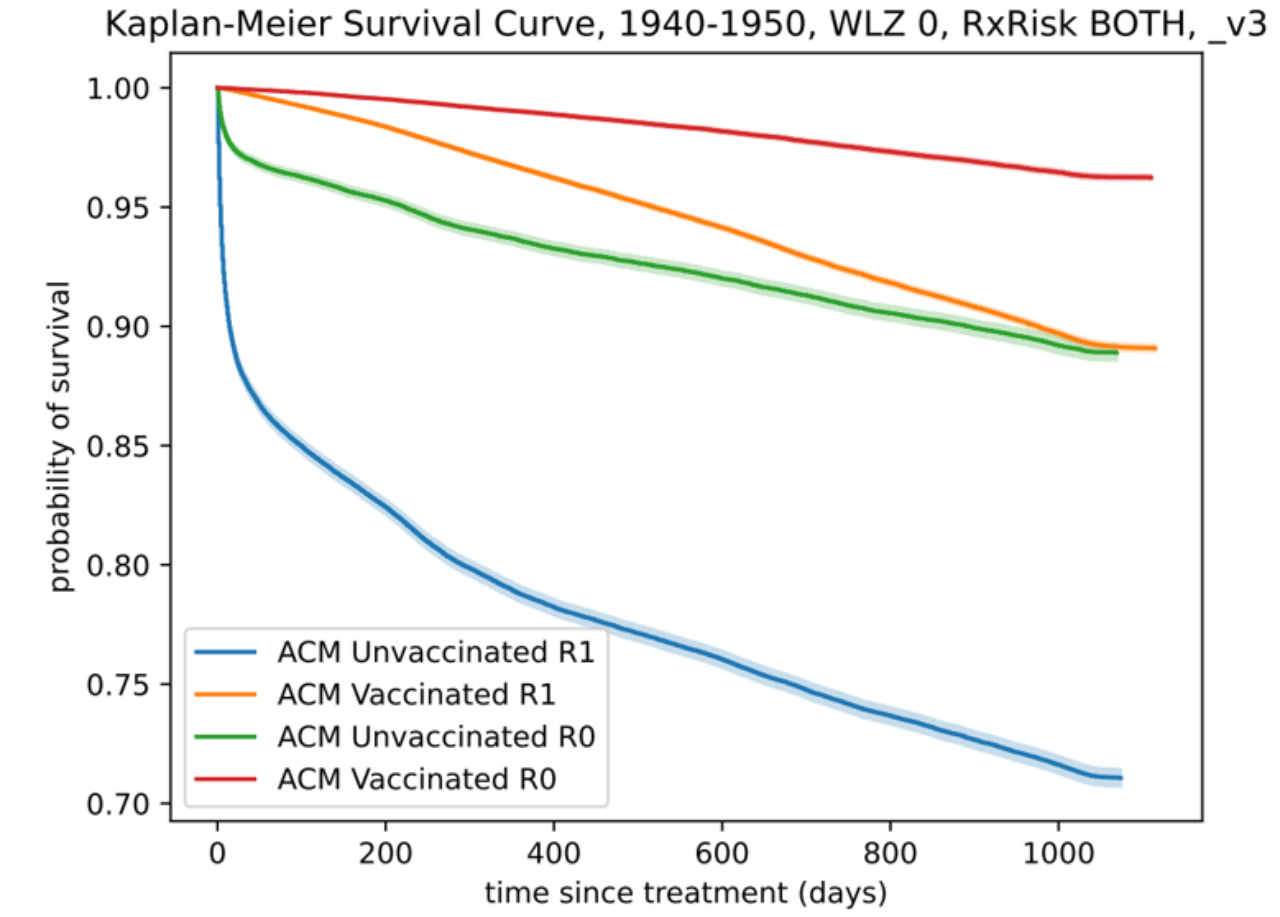
For the passage over time, we look at one of the Kaplan-Meier graphs (71-81 years) by Bram Bakker, chapter 6 in the Master Jacobs report.
With the dotted lines I have indicated where the lines are straight. In the first few weeks, actually on the first day, the difference is really huge, like Herman Steigstra has calculated here.
Only after about 1 year (second vertical dotted line) does the situation remain stable. Only then does a continuous mortality risk begin to emerge that you might have something to say about. But this is also where the research period of the Nivel report ends...
Nivel has looked at two snapshots: at 3 months and at 12 months (indicated by the dotted lines). It is only after 12 months that there is a continuous trend. Up to 12 months, the differences per day become smaller and that cannot have been caused by the vaccinations. The differences are also not in line with Covid mortality trends.
I copied the blue and green dotted lines upwards. The green does not coincide with the red after shifting, which we did see in Italy. The unvaccinated continue to die more here. This will have to do with the age cohort, because this is the case with people in their fifties, as we saw in the previous article.
The blue line almost coincides with the orange. In the first period, we have seen that the selection was based on health. It is very well possible that the people who did not die immediately were not as healthy as the vaccinated people. Nevertheless, mortality is exactly the same. This would mean that the vaccination has a negative effect on this group: healthy vaccinated people have the same mortality rate as the unhealthier unvaccinated people.
Even more striking is that Nivel's 'belly' is much deeper than that in Italy. In Italy, they didn't seem to be bothered by waiting times, non-consenters and other data pollution. So that could be 'pure' HVE there. On the basis of that graph, we may be able to say something more about the composition of those bellies in the Dutch data, which led to the amazing results of the Nivel report. If we subtract the 'pure' HVE, what is left in terms of data pollution, especially due to the waiting time problem? That, too, has Herman further elaborated.
In summary, the only thing Nivel has measured is what the Italian study is also based on: the Healthy Vaccine Effect that they had wanted to correct and on top of that the administrative chaos. This is how they come to similar conclusions.
Is there anything in the report about the HVE? Sure:
- On average, the vaccinated group is healthier than the unvaccinated group, for example because seriously ill people, who are about to die, no longer get vaccinated.
- This implies that the reason for not vaccinating may be related to a higher risk of death. However, even after correction for certain characteristics, we saw that excess mortality among the unvaccinated/unregistered was much higher than among vaccinated people. There are still many features that we have not taken into account.
As Maurice pointed out: for Obesity and smoking for example, has not been corrected.
And then just keep at it...
What do we think?
The fact that there are scientists who continue to work with this kind of data and this methodology in government-funded studies to prove vaccine safety is worrisome. It is a statistical fallacy: an unmistakable HVE is being turned to vaccine safety and the scientific elite is watching.
People who no longer received the vaccine at the end of their lives and died unvaccinated are included to show a lower mortality risk for vaccinated people, not to mention other health issues among unvaccinated people. This not only produces disinformation, but it damages everything that has to do with science, institutes and governments (and with healthcare).
P.S.
Nivel's expectations, as they have been reported, are exasperatingly sloppy. They are rounded to 2 decimal places. For example, a 3-month expectation for unvaccinated people (18-35 years) of 0.01% mortality is calculated. On the face of it, this corresponds exactly to the reference period on which this expectation is based: also 0.01%. But that is the rounded percentage of 15 deaths among 223,552 young people. That's 0.0067%. By presenting this percentage as 0.01%, they set the standard 50% higher than what has been observed. I couldn't find the justification for that. Could it really be carelessness? When it comes to such small numbers, you report per 100,000, not per hundred, right? We just have to hope that those roundings didn't end up in the calculations...
Of course, these are only small numbers... 0.01% would mean 22 deaths, not 15 deaths of students and young parents in this study. A difference of 7. But calculated for the entire Dutch population, this is a difference of more than 100 young people. I can't imagine that medicine has gotten away with that in the past. Careless, after Honesty the second core concept in the Guidelines for scientific integrity.
References
- 1did not show an increased risk of all-cause death, non-COVID death, or any PVR-SAEs, as compared to the unvaccinated
- 2there may be confounding due to the healthy vaccinee effect, wherein vaccinated people may be expected to adopt less risky behaviors


If both NIVEL and these Italian researchers continue to cling desperately to the conclusion that there is a high (non-covid) excess mortality among unvaccinated people, this should be a reason for an in-depth investigation into the explanation.
Let's assume that the bias caused by HVE and data pollution is indeed too small to draw the conclusions. Then the excess mortality from non-covid causes among unvaccinated people could be the result of delayed or incorrect care, specifically for that group. There are anecdotes of doctors who refused to treat unvaccinated patients. They had to get vaccinated first. If this turns out to be a structural phenomenon, it is very serious. Some (resentful) doctors will have given priority to vaccinated people, but I can't imagine that this has happened on a large scale. What other explanations could there be that apply specifically to the group of unvaccinated people?
The survey is from last year and Nivel is still clinging to absurd figures, so that "if..." You can leave it out I'm afraid.
I don't see any reason to assume that the bias caused by HVE and data pollution is too small to draw conclusions. They are just too big, so no conclusions can be drawn.
Totally agree. These conclusions are untenable. It's ridiculous that they stick to it.
But if they don't want to admit they're wrong, they'll still have to come up with a well-substantiated explanation.
This week, a family member met a young doctor at the consultation office. "We don't want two injections in our baby, but only the most tested "old-fashioned" one, because last time the baby became very sick from two injections". The doctor said "what nonsense because you don't know which shot anyway so what difference does it make". "50% chance that it was that new shot, so if the baby doesn't get very sick now, we know (almost) for sure" "By the way, it has been reported to the Lareb". The doctor got a very nasty attitude and started to force, of course there were no leaflets. The calculation was too complicated for this doctor. Of course, the baby went with one old-fashioned shot, which Prof. Capel is not negative about it, go home. Still very tense parents because it is not without risk either... The baby is doing fine, but the relationship with the child health clinic will never be okay. And that is not without risk because people are immediately dismissed as "antivaxxers".
On Monday, September 2, 2019, a population screening program started in Italy.
Blood samples were taken throughout the country for a heart disease study.
Those samples were, of course, preserved.
It later turned out that a significant proportion of those samples contained antibodies against the Sars-Cov-2 virus.
In view of the incubation period and the need to pass through the disease and produce antibodies, this visor must have been present throughout the country in the summer.
Bergamo was a psyop.
Then of course you can expect these kinds of articles.
By the way, I thought that many Italian doctors realize their errors and are actually pushing back.
The unhealthy non-vaccine effect has already been studied in another way.
A large group of people was examined to see whether they had been treated or admitted to hospital in the 5 years prior to 2020.
It was known whether these people had been vaccinated afterwards.
It turned out that the chance that the unvaccinated had been treated in hospital was 16% higher and the chance of being admitted to hospital was 3% higher.
Dat is een leuke! De vaccins werken dus ook met terugwerkende kracht.
Zou je de link naar dat onderzoek nog kunnen terugvinden?
https://jdee.substack.com/p/primary-clinical-outcomes-for-a-single-90d