On 20 October posted on FB.
Data: RIVM/bddataplan https://www.bddataplan.nl/corona/
In September, things looked worrisome with an exponential growth in hospital admissions. A doubling per week(!) made Gommers fear the worst for the end of November. That's where all the panic, excessive testing/declaring positive, extra measures, scaling down and shuffling patients around started. This in turn leads to more unrest among healthcare staff. It does not benefit the effectiveness of care.
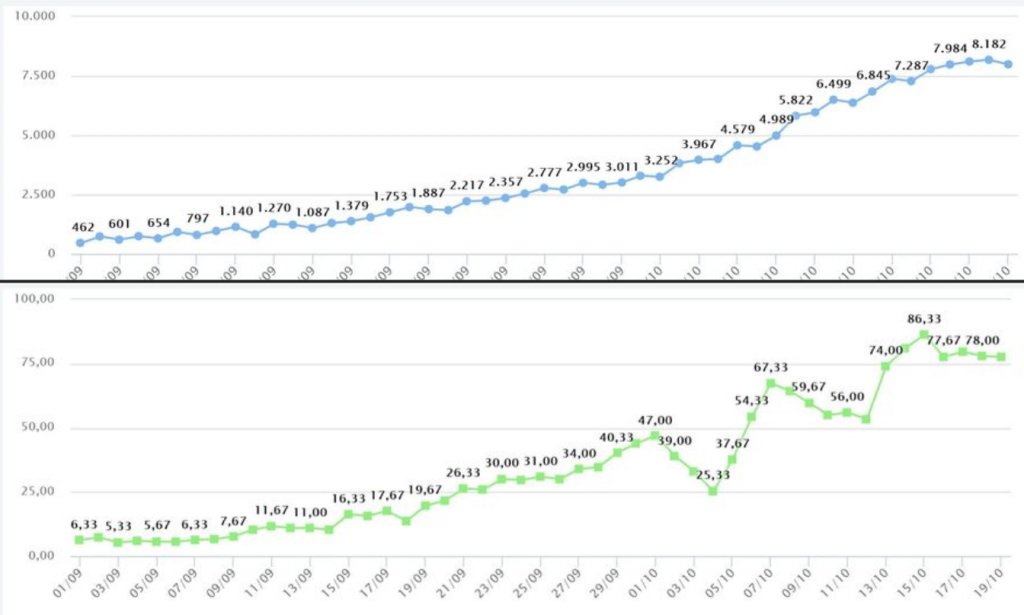
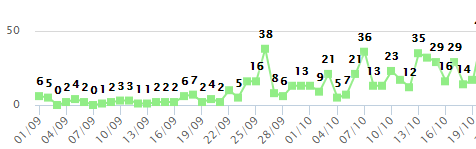
That weekly doubling was in small numbers: 5-10-20-40. See the green graph. So few admissions out of hundreds of thousands of infections can fluctuate a lot. It therefore became exciting in October: will that weekly doubling continue when the numbers get a bit bigger?
The rounded averages:
1st week of October: from 40 to 65 (+60% no doubling)
2nd week of October: from 65 to 80 (+28%, further stagnation)
Today (20/10, 3rd week) we are still fluctuating around 80.
We have reached a plateau for a while, it seems.
The decline in growth started even before the tightened measures could have an effect.
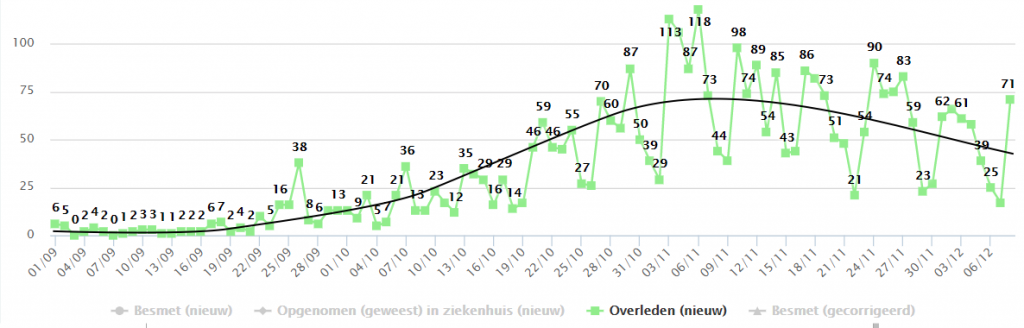
The R is in the month so there will certainly be more infections in the coming months. The sting of the exponential increase now seems to have been removed. This also applies to the mortality trend. In addition, proportionally fewer and fewer people are dying from corona anyway thanks to better treatments.
It is a pity that so little attention is paid to ventilation by the government, otherwise it would look a lot better. With ventilation you can significantly reduce the amount of virus in infectious air. In the summer, we have seen that large numbers of people can be infected in this way - perhaps partly immunized - without putting pressure on healthcare. #wereldstatistiekendag
[Edit: graph updated on December 8, 2020:]