People complain about people who no longer have confidence in government, science and the media. Similarly, we can complain about those clinging to remnants of credibility when it is shown time and again that information from official quarters raises great question marks. The information is rambling, opportunistic, not transparently substantiated, sometimes simply impossible. Indications point to positive effects, although the figures are still so abominable.
Two examples: A graph from a new rivm/Julius report with in-depth information by Hans Verwaart and a twitter thread by Cotijn Hebbs that gives an impression of the rivm reports in 2022. The échec of science. Even the government-run Cochrane institute is starting to show cracks, but more on that later.
New rivm calculation method: "adaptation2"
In September 2022, we saw a rivm graph that showed different values than the figures in the corresponding table. The staggeringly negative effectiveness (more deaths after vaccination) was simply shopped away. Months 7-8-9 were not displayed correctly.

The figures were presented more favourably than they actually were, a mortal sin according to the official Guidelines for Scientific Integrity of the Knaw, the scientific institute that awarded Jaap van Dissel an honorary medal.
That graph will not have been comfortable for the rivm either. They have now come up with a different calculation method. The figures have been edited with "adjustment2". What that means is not told, but the graph now looks, in The latest report, like this:
Hans Verwaart looked at the effect of the new calculation method "adaptation2" per age group.
Adaptation2 by age group
On 31 May, RIVM published a report including additional material in which the vaccine effectiveness per age group is calculated.
They calculated three values:
- firstly, the value resulting from the inclusion of all deaths in the vaccinated and unvaccinated group for a certain age category, see parameter "rough";
- an adjusted value was then calculated ('adjustment1'), taking into account gender, year of birth and country of birth;
- The last variant is "adaptation2". This is like "adjustment1" but then underlying suffering is also included.
RIVM does not make clear in its publication how these adjusted values were calculated. So there can be no control over it.
Protection against death from any cause
There are many causes from which people can die, but since the outbreak of Covid-19, corona has become an important cause, especially in months when the corona wave peaks, and especially among the oldest groups. It can therefore be expected that if a vaccine limits the number of deaths from Covid-19, this will also be reflected in the protection against death regardless of the cause. In principle, the corona vaccine should not have a positive or negative effect on deaths from a cause other than Covid-19. In practice, we do expect a slightly positive effect, because in general, on average, the health of a vaccinated person is better. There are non-vaccinated people who would have liked to get a jab, but whose health did not allow it. Also, people with Covid-19 were not pricked, which affects the statistic of unvaccinated with Covid-19.
The protection against death from Covid-19 has not been further elaborated here.
Vaccine effectiveness (VE)
The graphs below show the VE against death regardless of the cause. The highest achievable value is one (that is 100%), the protection is then optimal. Not a single vaccinated person will die. Of course, this limit cannot be reached in practice.
When the VE is zero, there is no form of protection against death.
However, the VE can also become negative. A negative value means that a vaccinated person in a certain group has a greater chance of death than an unvaccinated person in a similar group.
For the sake of completeness: about 10 months after completing the basic vaccination (two jabs) of the oldest groups, anyone who wanted to could have a booster in about two months.
Age group 90 plus
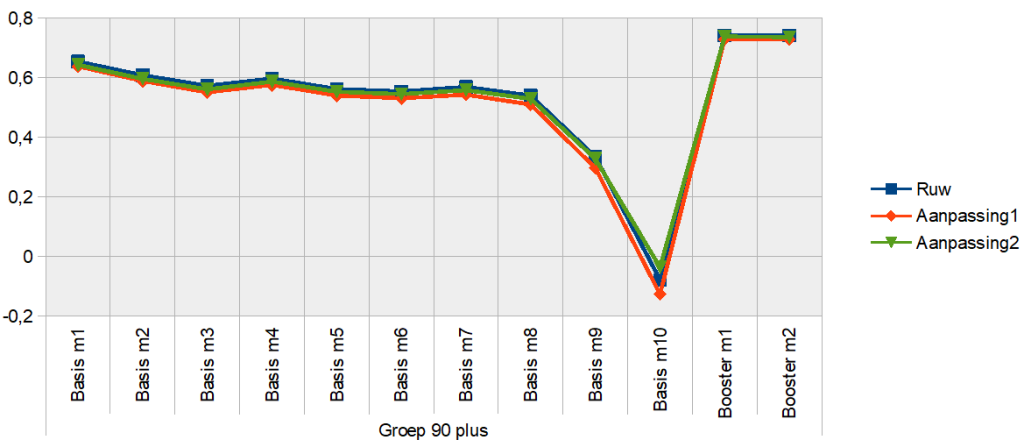
In the figure above for the group 90 plus it is clear that over time the protection decreases. Seven months after completion of the basic vaccination, a sharper decrease occurs, and after 10 months the VE is even slightly negative. For this group, the booster actually came too late, the booster itself did cause the VE to rise again.
In this group, there appears to be little difference between the raw data and the adjusted data.
Age group 70-89
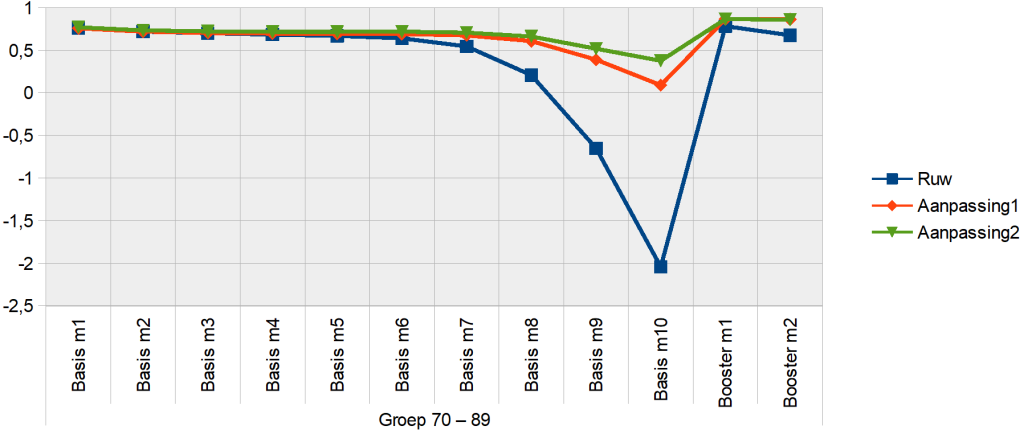
In contrast to the 90 plus group, the adjustment in this group has caused large differences between the raw and adjusted data. In months 9 and 10, the raw data is considerably negative, but the adjusted curves remain positive. Here, too, a steady decline has been seen over time since the completion of the basic vaccination. In the three curves, the trough is in month 10. After obtaining the booster, the protection is back up to standard.
Age group 50-69
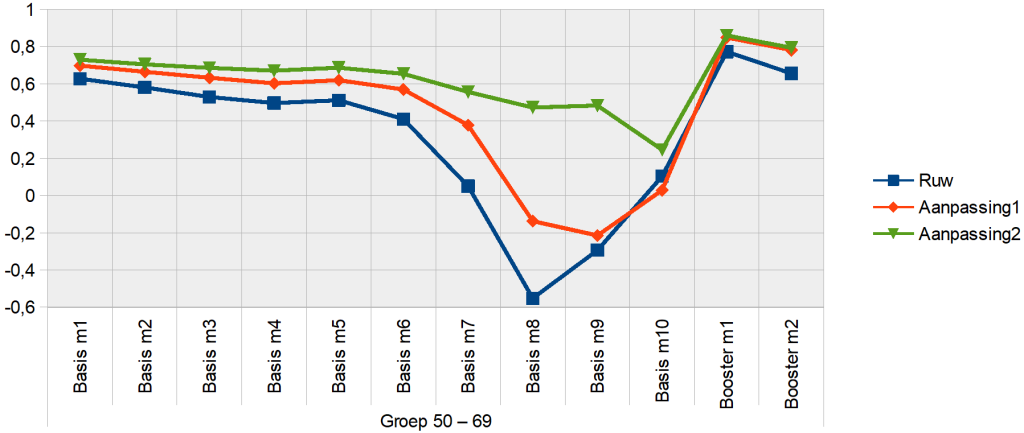
Again, the differences between the raw and adjusted data are considerable. In contrast to the older life groups, two remarkable things stand out:
- With the "rough" curve, the trough is already in month 8 and "recovery" takes place in months 9 and 10. However, that is incorrect. That the valley is already in month 8 is very plausible because this group only completed the basic vaccination in April or May. So there was only eight months at most between the basic and the booster vaccination. The "recovery" shown will presumably be mixing of data between base and booster, i.e.dat the data in months 9 and 10 will also include boosters.
- For the "adjustment1" curve, the low point is one month later, in month 9. And with "adjustment2" even a month later. Again, there is no logical explanation for this, except mixing data.
The curve "adjustment2" never becomes negative, the other two do.
Age group 12-49
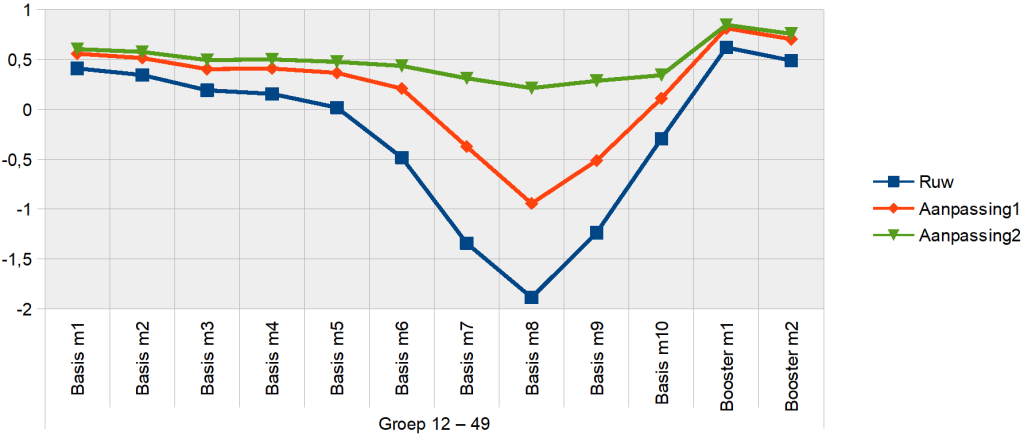
Here too we see that the valley is in month 8, but now again for all three curves. This group was the last to receive the basic vaccination, in this group there is also a large number of people who have taken the Janssen vaccine, with only one jab covering the entire basis. This may be a reason that the valley does not fall earlier. Furthermore, we see the phenomenon that also occurred in the previous group, that after the trough there is a "recovery" lasting several months. Here, too, there will probably be mixing of basic and booster vaccination.
The curve "adjustment2" never becomes negative, the other two do.
Summing up and concluding:
- For all groups, the protection provided by the basic vaccination (against death from any cause) decreases as the time elapsed since the completion of this vaccination round increases. After setting the booster, the VE is back to normal;
- For all groups, the vaccine effectiveness is negative in the rough data. For the oldest group this also applies to the two adjusted curves, for the other three groups the VE is positive at least for the curve "adjustment2";
- In groups 12-49 and 50-69, there seems to be a period of recovery between the trough of the VE curves and the setting of the booster. Perhaps this is a mixture of data between base and booster.
- It is unclear and therefore impossible to check how RIVM has translated the raw data into the two adjusted curves.
So much for Hans Verwaart. There may be more appealing names to quote. However, these are often crystallized observations of facts that were previously explored on this blog or even raised for the first time, sometimes years ago. Fortunately, there are more people who follow current events critically. For example, I came across the Twitter thread below from Cotijn Hebbs, which shows that more people pay attention when reading government reports. Did you still have confidence in the interpretations of government institutions? Feel free to read on.
Twitter thread by Cotijn Hebbs (@trip6)
@RIVM disinforms with discontinuity about increased burden of disease due to corona after basic series On July 5, 2022 published @rivm The figures on vaccination effectiveness over the period March-June: https://rivm.nl/documenten/effectiviteit-van-covid-19-vaccinatie-tegen-ziekenhuis-en-intensive-care-opname-in-14
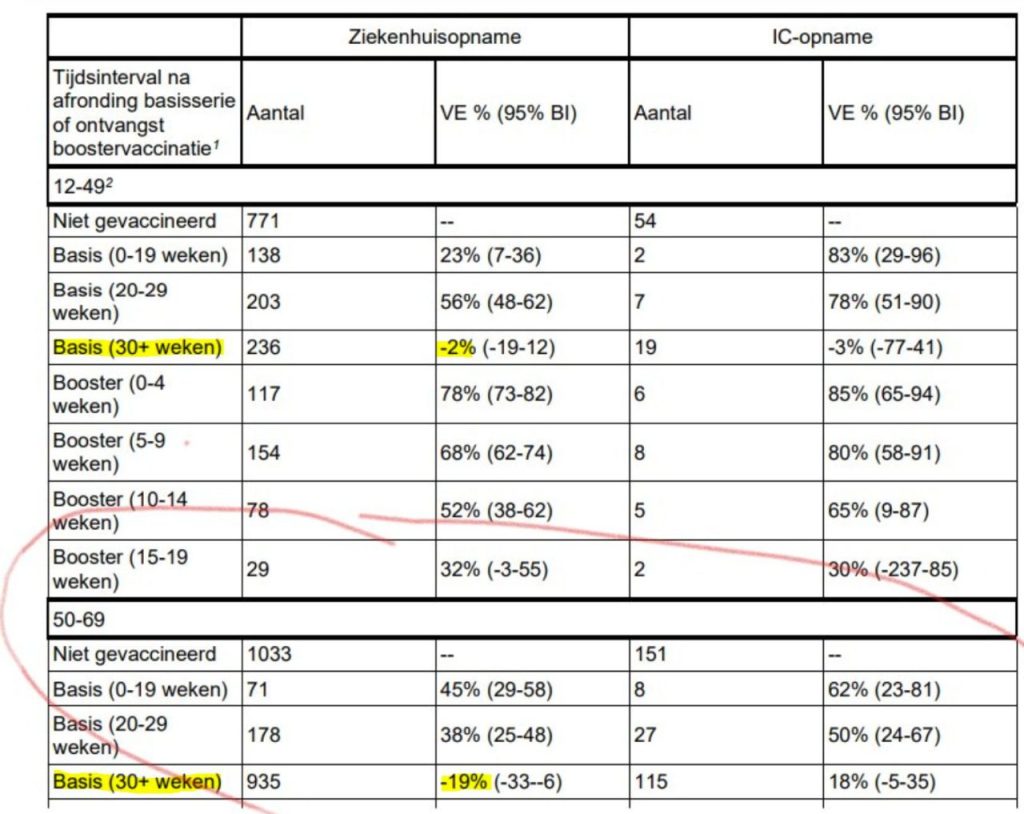
This showed that people aged 50-69, who only received the basic series (i.e. the large group who "thanked for the booster"), are much more likely to be hospitalized due to corona than unvaccinated people (Table 4)
This was the follow-up to previous reports, for example a month earlier, when the negative vaccine effectiveness against hospitalization for these booster bedankers of 50-69 was "only" -19%. https://rivm.nl/documenten/effectiviteit-van-covid-19-vaccinatie-tegen-ziekenhuis-en-intensive-care-opname-in-13...
What surprised me last month, when new figures were published? https://rivm.nl/documenten/covid-19-ziekenhuis-en-intensive-care-opnames-per-vaccinatiestatus-in-nederland-opnames... The reporting methodology has changed, and the figures are now difficult to compare!
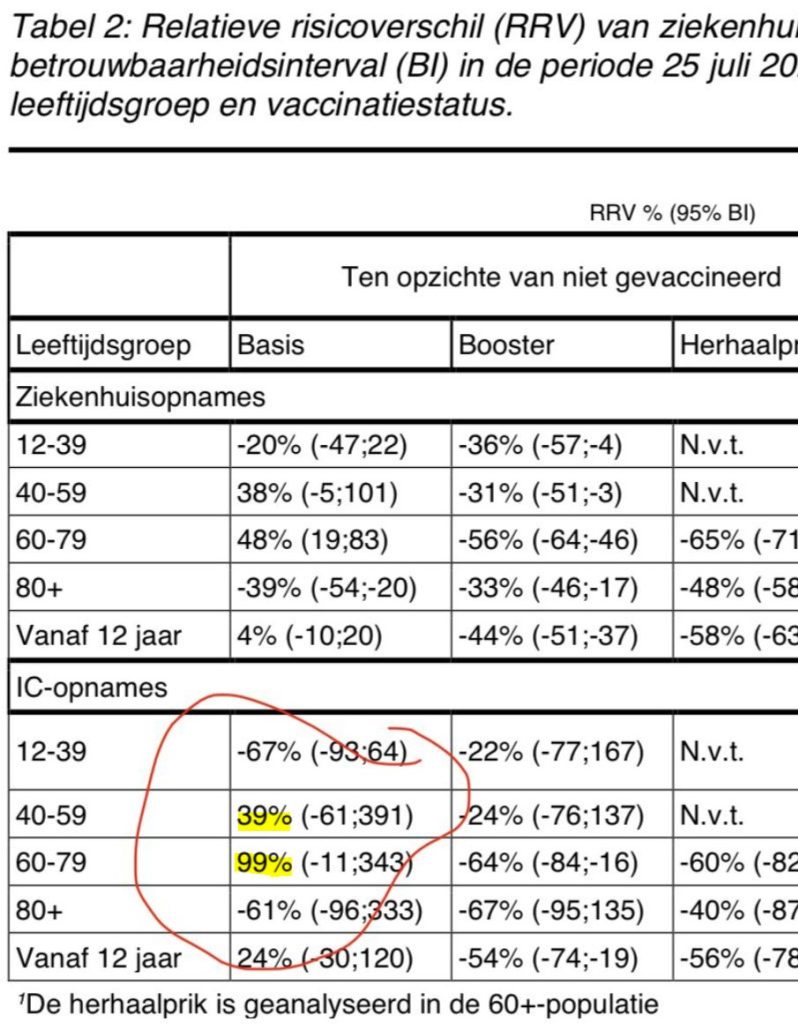
It is now reported in "Relative Risk Difference". Positive number is poor protection. That now stands at 61% for 60-79, but that's a different age classification than the previous 50-69 report, really, why @rivm? Concealing? Deception? Disinformation?
There is a lot else to criticize about this report. But the real, quite shocking fact remains undisguised, although the trend is now almost impossible to trace: In the 60-79 age group, if you have thanked for the booster, so only received the basic series of vaccines, you are much more susceptible to severe corona with hospitalization and someone else's bedside, than an unvaccinated peer.
The figures for August 2022: https://rivm.nl/sites/default/files/2022-08/NICE_CIMS_rapport_20220830.pdf...
[in all under-80s, basic jabs were more likely to have a corona hospitalization than the unvaccinated – ed.]
Figures dated 18-September check those IC admissions RRV 99%!! https://rivm.nl/sites/default/files/2022-09/NICE_CIMS_rapport_20220927.pdf...
The September update is not coming, it seems. Too painful for the vaccinated and, above all, their medical advisors?
[Not included here: some disastrous reports from our neighboring countries. See full thread below.]
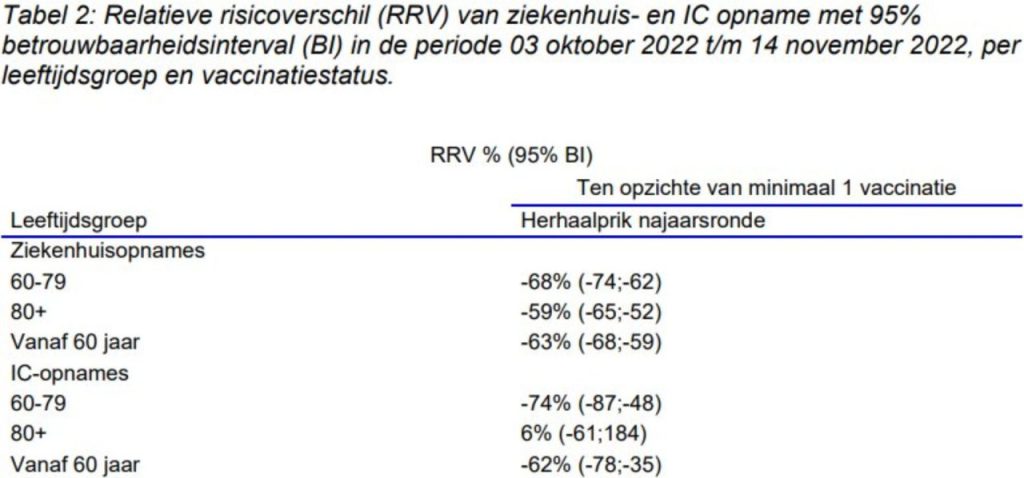
Why today is unclear to me, but last Tuesday, after November 8, there was already an update within 2 weeks. What a deception. And another update from the RIVM. We don't put "compared to not vaccinated" in it. The basic series is very risk-increasing (100%?) compared to vaccinated. So we publish the effectiveness of repeat jab compared to "had at least 1 vaccine".






0 reactions