
The last remnants of vaccine effectiveness are being picked out in all kinds of ways. From shifting from vaccinated to unvaccinated (because they did not consent to registration of their data) to comparing subgroups of vaccinated instead of vaccinated versus unvaccinated.
Having confidence in a government when it comes to an emergency injection does not mean that that trust is there if that same government notes it somewhere. Administration is apparently more frightening for 7% of the population than an injection. That group has made it difficult to assess the vaccine effectiveness achieved. Last week, two rivm publications were published. The confusion is great and what emerges from it above all: the vaccines are a tragedy. Or not?
Vaccine effectiveness against hospitalizations
Below is an example graph of vaccine effectiveness as we would like to see it. We recognize the usual quarterly wave pattern of the disease that comes and goes with waves; a fascinating interplay between immunity and virulence. Especially with the elderly, of course. In times of high virulence, a vaccine has the most effect.
What is good to see: the last prick (purple) has the most effect. Then at 80+ we see the repeat jab and the booster. At 60-79 especially the booster, there fewer people have taken the repeat jab. In order to remain well protected, it is therefore important to get your vaccine in time.
This is how we get corona under control together.
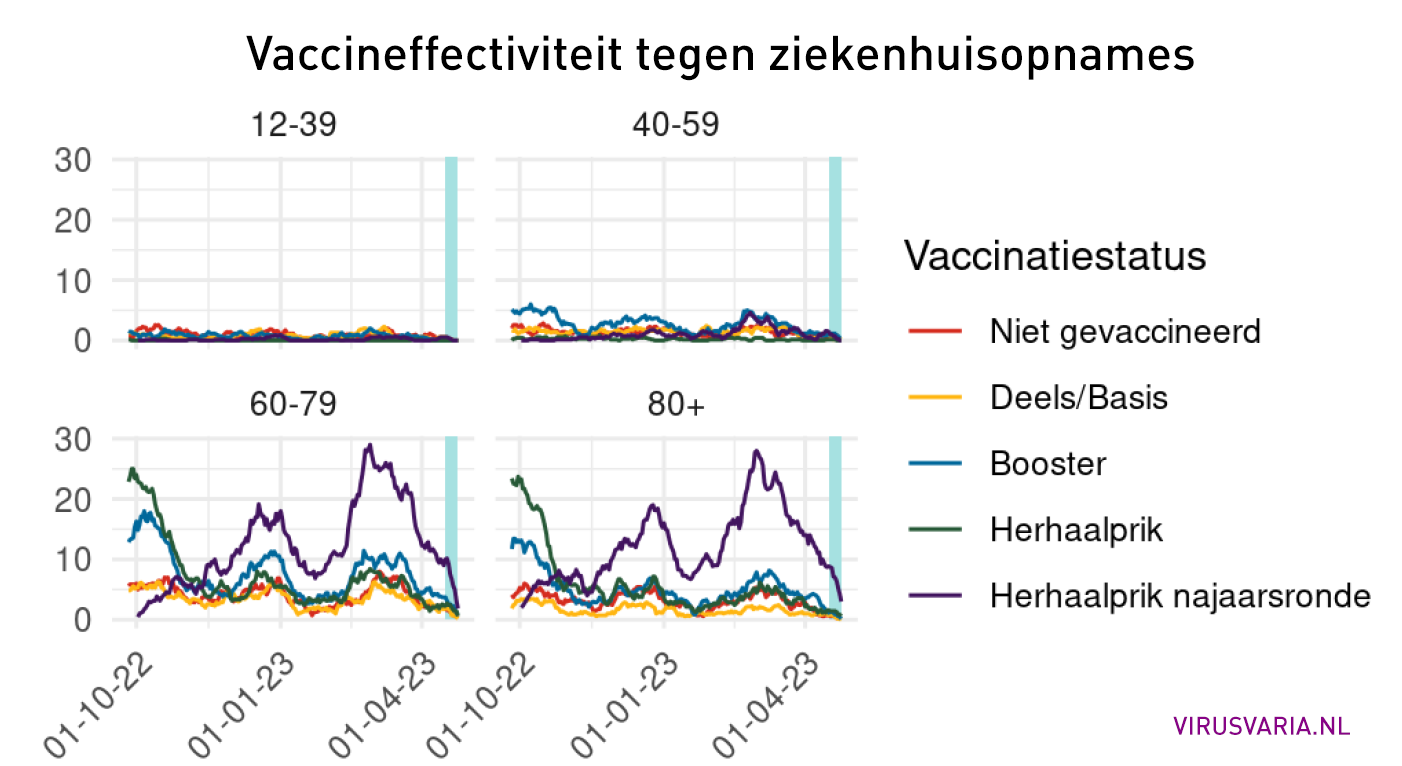
So far so good.
Only: I changed the title of the chart, it's not vaccine effectiveness. It's the other way around: what's shown in this graph are the vaccination statuses of hospitalizations per day, in absolute numbers.
Repeat injections in particular are in hospital with corona. And well, if the majority of the population has had the repeat injection, it is not surprising that this is somewhat reflected in the hospital - unless those injections really work very well, of course. Then people who have properly received their autumn round shot would not end up in the hospital. At least not more often than the people who haven't.
In the media, attention is now mainly drawn to various calculation methods that could increase vaccine effectiveness by a few percent. Maurice wrote something about it yesterday. Below we review another report.
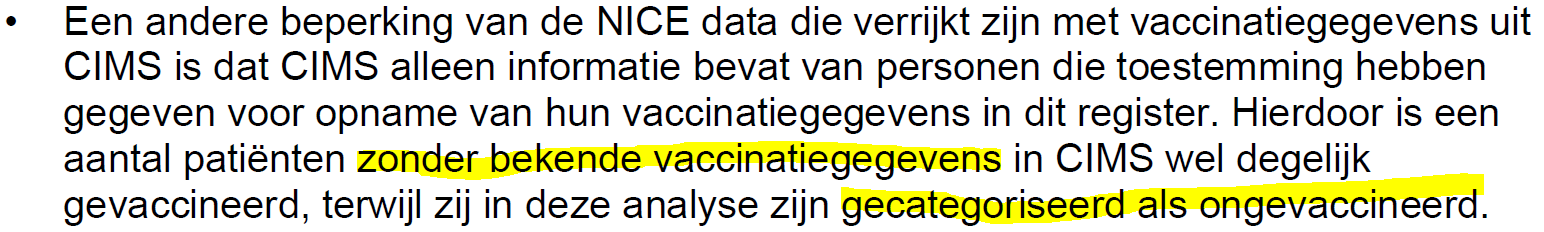
In de bevolking: 7% "non-consent"
In a study published last week1RIVM in collaboration with Julius Health Center: Information bias of vaccine effectiveness estimation due to informed consent for national registration of COVID-19 vaccination: estimation and correction using a data augmentation model it is argued that it is not possible to determine vaccine effectiveness because not everyone has given permission to register his/her identity with the injection data. As a result, there remains uncertainty in hospitals about a residual percentage of people with vaccination status 'unknown', a percentage that can also fluctuate over time.
By shifting these 'non-consenters', the researchers in the study first calculate a vaccination percentage that is much lower than reported in previous reports. They then calculate how you can achieve higher percentages. These higher percentages are closer to what had previously been reported. Is this a trick to substantiate remarkable reports in the previous reports? In any case, the non-consent percentage in the Netherlands is being juggled: 7%. And then also during the Delta wave, when the vaccines were able to prove themselves well because of the virulence of Delta, again at the end of 2021. But what about now, in 2023?
Nu in het ziekenhuis: 2% "non-consent"
Last week also saw the publication of a report by the RIVM COVID-19 epidemiology and surveillance team.2COVID-19 hospital and intensive care admissions by vaccination status in the Netherlands (admissions 03 October 2022 – 01 May 2023) This reports on the situation in hospitals and ICUs over the last six months, according to vaccination status.
The number of non-consenters in hospitals appears to be only 2%
If you include the non-consent group among the vaccinated, this can have opposite effects:
- In population screening, the total number of vaccinated people is increased. The total number of Covid patients is what it is. The chance of ending up in hospital as a vaccinated person with Covid is therefore reduced.
- Patients are sick. If the non-consenters in that group of patients move to the vaccinated, the total number of vaccinated sick people is therefore increased. That is actually more chance of admission = worse VE. The chance of admission for corona is increased.
An example: Hospital with 70 vaccinated, 15 unvaccinated, 15 unknown
- Unknown excluded: 15/85 =18%of admissions are unvaccinated, 82% vaccinated
- Unknown as vaccinated included: 15/100 =15%of admissions are unvaccinated, 85% vaccinated
- Unknown as unvaccinated included: 30/100 =30%of admissions are unvaccinated, 70% vaccinated
It is clear that there is something to be gained here for vaccine effectiveness. When drawing up the balance sheet in hospitals, the highest VE is achieved if the non-consent group is counted among the unvaccinated.
It is the scraping together of percentages, but it does not alter the fact that this is not scientifically investigated down to the percent. Ultimately, we would like to know exactly how it works. That's not to say we don't know anything until then.
In reality, there are far fewer non-consenters and more unvaccinated than in this example. In real life, there are much smaller differences. So small that you might wonder if they are relevant in the discussion of vaccines (insofar as discussion is allowed.)
So what are the real differences?
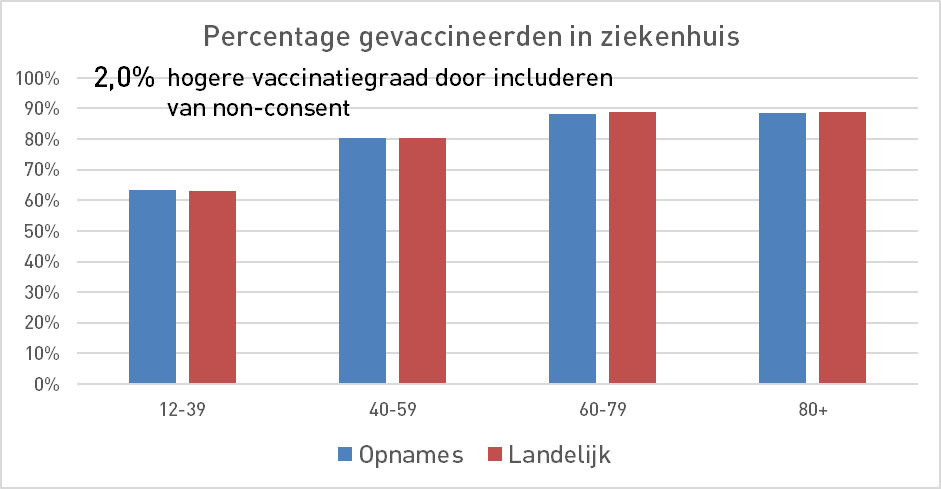
We take a look at the vaccination rates in the Netherlands and then at the vaccination rates among the corona hospital admissions of the past six months, as reported by rivm. The blue bar shows the actual percentage of vaccinated patients among the patients.
The red bar is the 'reference' percentage, as you would expect based on the national vaccination percentage. This is independent of whether shots are registered by name or not. So we know that some people have been vaccinated, but not who. That doesn't matter for the height of the red bar, only for the blue one.
If we do not correct for non-consent in the hospital and keep it out everywhere, we see that the vaccinated are slightly underrepresented compared to the national percentage. In any case, that is not a negative effectiveness of the vaccines among corona patients.

Twice as many people die outside the hospital as in the hospital. If those are more likely to be vaccinated than unvaccinated, that could explain the difference. Vaccinated people who die suddenly - without a hospital - lower the blue bar. Unfortunately, the data used to verify this will not be released.
For example, if we count 2 percent more vaccinated people than are currently registered (this happens if we consider the non-consent group as vaccinated), then that difference disappears.
At 4%, it is already turning into the disadvantage of the vaccines. As a result, the VE becomes negative. Note: this is only to illustrate the tipping point. In the hospital, it's only 2%.
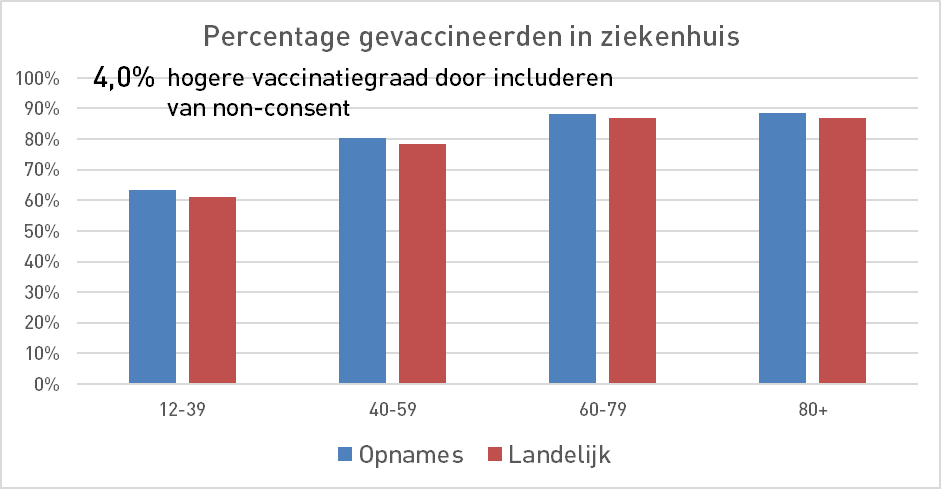
In short, the differences are minimal. That also reminds us of the facts: the vaccines are nowhere near dramatically reducing hospital admissions. In the hospital, with an effective vaccine, you would expect much smaller, for example, half smaller blue bars. Now that the vaccinated are becoming corona patients in the hospital in about the same proportion as in the population, what is the point of vaccination at all?
So how important is vaccination?
The graphs in the report itself confirm the picture.
In Grafiekje A zien we de aantallen patiënten per vaccinatiestatus. Het valt op dat de paarse lijnen veel hoger zijn dan de andere. Dat komt omdat er veel meer "Herhaalprik najaarsronde" geprikten zijn in de bevolking, bij de 60-plussers. Je kunt de opnames dus beter relatief bekijken, per vaccinatiestatus. Dat is in grafiek B en C gedaan.
Graph C, where the scale has been reduced, is the clearest. We also see here the minute differences that we saw in the bar graphs.
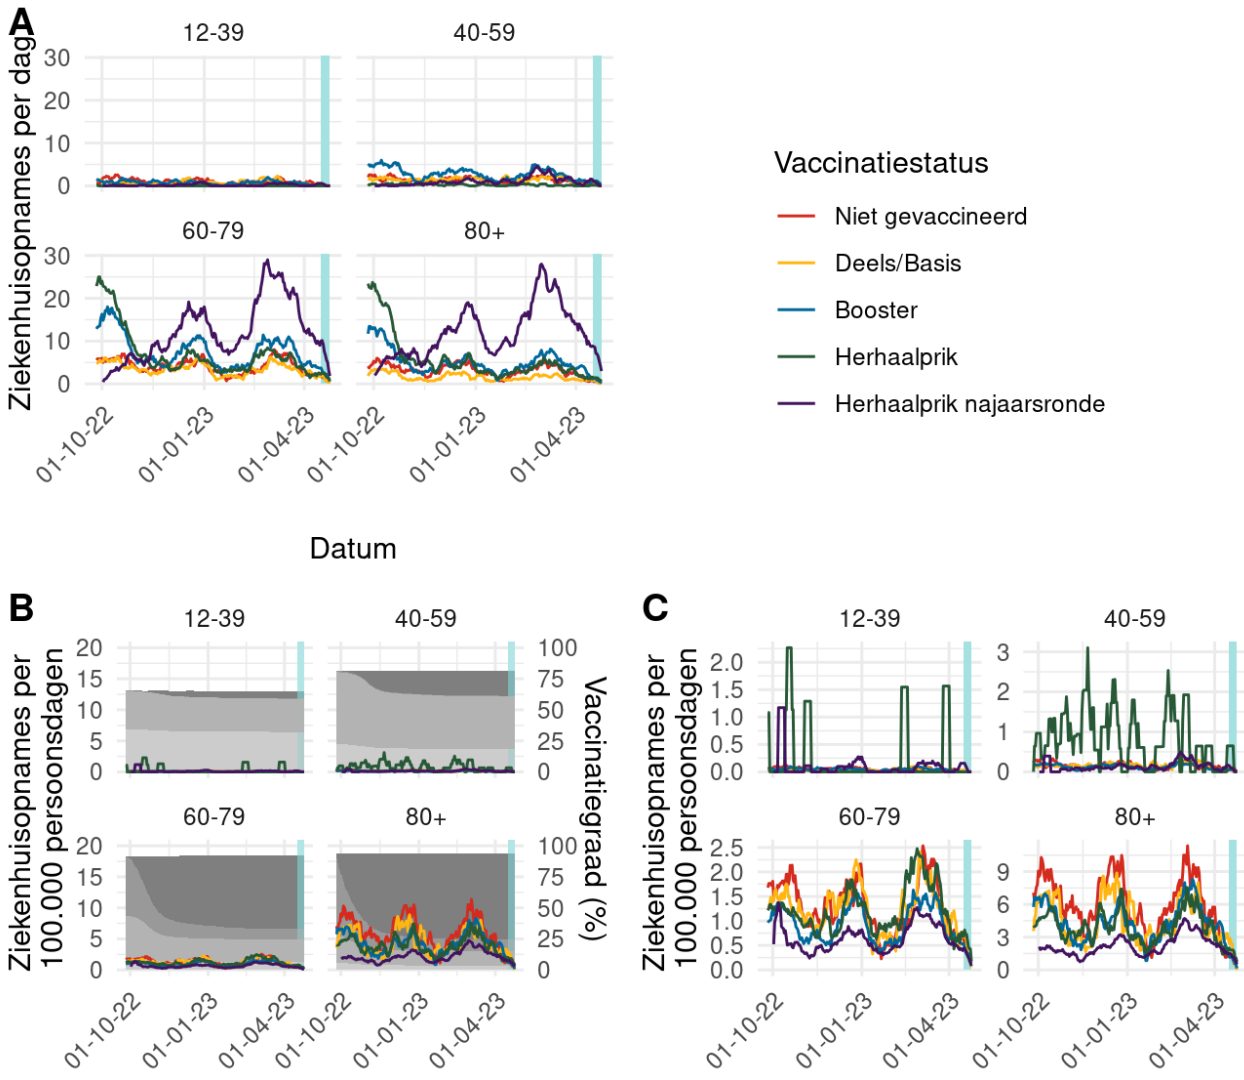
Zoals eerder in het rapport vermeld is "vaccinatiestatus onbekend" bij de niet-gevaccineerden opgeteld. Dat heeft de rode lijn iets te hoog gemaakt.
With an effective vaccine, you would expect the red line of unvaccinated people to clearly hover well above the other lines with 3, 4, perhaps 10 times as many hospital admissions, especially in the older age groups for which the vaccine was intended. Or think of polio, where that factor is even higher. At the very least, I would like to see something like the purple line in Chart A in the "per 100,000" chart, which also started this article.
But what do we see?
The red line for unvaccinated people peeks out a little here and there at 80+, but otherwise the red line disappears behind the other vaccination statuses of those who have been vaccinated. There needs to be a lot of ASMR and personalization to squeeze any effectiveness out of this.
But also look at 40-59: the repeat jabs come to the hospital with corona much more often than the rest! Obvious.
This seems like a disastrous picture to me. Surely doctors or care managers who report this and then proceed to the order of the day will one day be held accountable? Or should that be done by the ministry that issued the implementation orders...?
The differences have not been significant since Omikron and can be called negligible in the last six months. And yet there has been a lot of vaccination in 2022. In 2022, approximately 8 million jabs were made.
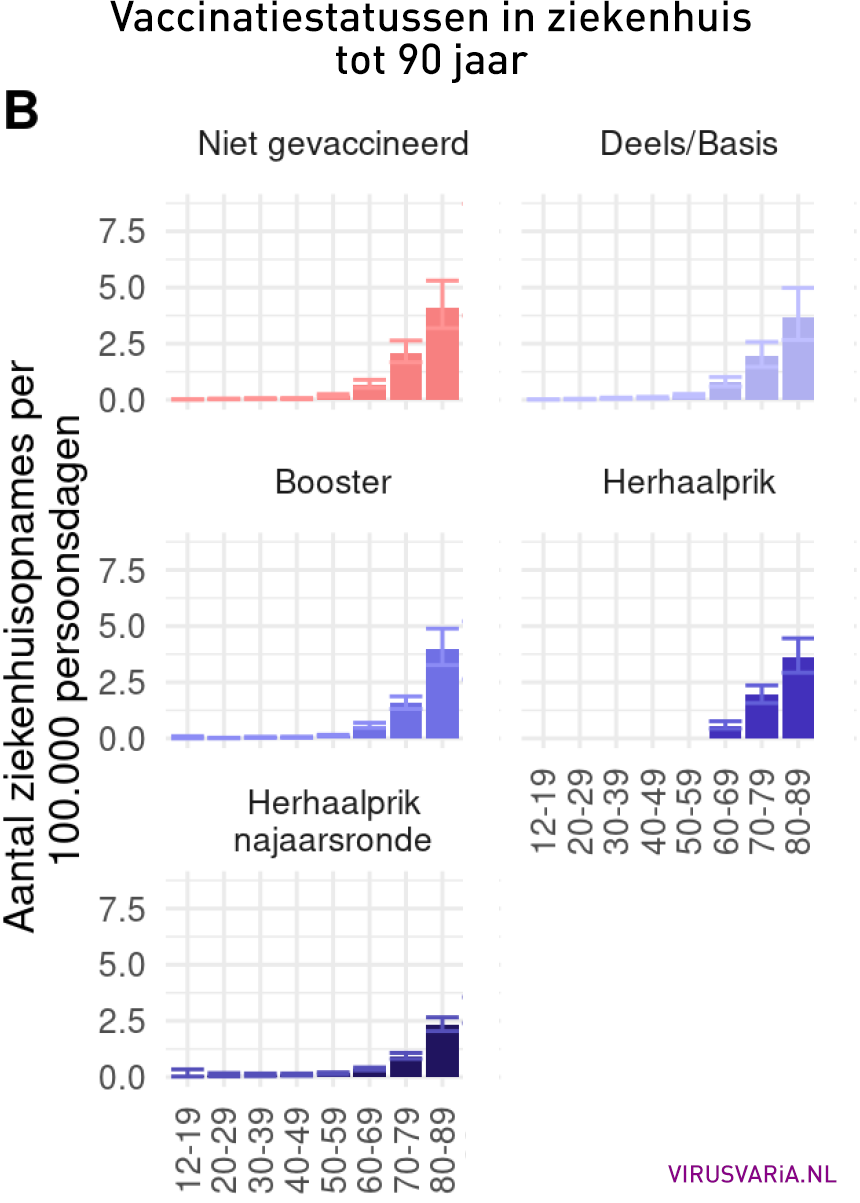
Another graph from the report, where I highlighted the 90-somethings.3The 90+ bars were iconic, while 90+ only covers 1% of the population. That would make a well-identifiable 1% of the population seem like an excuse for jabbing the entire population. Try to pay particular attention to the margins of uncertainty, indicated by the lighter colored lines. Only above the age of 70 is there any difference between non-vaccinated and repeat injection. The 'healthy vaccine' effect could also play a role here. If only elderly people who were in a reasonable health condition had received the autumn shot, that could explain part of the 'success' of that shot. Still apart from it Fenton effect, where recently vaccinated people are considered unvaccinated.
At 70+, the difference is only beginning to emerge: lower bars and the top margins (2.6) fall under the lower margins in the other age groups.
By continuing to deal with the Delta wave, the impression is created that vaccines are effective for everyone. To the extent that they have ever been, they have not been for about three-quarters of the population: the 70-year-olds, for a year and a half. For those three-quarters, only potential side effects are de facto served.
If we ever get to see the vaccination statuses of all patients, not just corona patients, then only meaningful risk/benefit analyzes can be made, also about vaccinations around the Delta Golf and before that... I'm holding my breath. We already saw that there is a lot going on there article by Hans Verwaart. For a long time, there has been no efficacy for the vast majority.
The fuss about percentages more or less effectiveness of corona vaccinations is a mock battle in the rearguard. The effectiveness does not meet the minimum effectiveness requirements for vaccines.
The WHO itself states:

And don't start messing around about the difference between trials and real world, efficacy and effectiveness. They are flut products and it is extremely worrying that our government is allowing a power grab from an industry that does not even adhere to its own codes, an industrial cooperative with the WTO as its governance.
aside
2% non-consent in hospitals, which is 5% lower than the national percentage. How is that possible? Options:
- In the hospital, two-thirds still reveal their vaccination status. My guess is that most will be happy to tell the doctor that they have done everything they can to prevent Covid. Most people are going to talk anyway when it comes down to it. (So: non-consent = actually all vaccinated.)
- Unvaccinated people do not want to tell the doctor that it is their own fault that they got corona. (So: that 2% is unvaccinated but has registered non-consent.)
- The vaccines work quite well because of a subgroup of 7% vaccinated non-consenters, less than a third end up in the hospital. That's what you might expect from a somewhat effective vaccine with a high vaccination rate.
- Young people in particular have refused and they do not come to hospital with Covid. But ages of non-consenters are unknown because not registered so we don't know.
We do not know what happened to those 5%, whether they were not included or made their status known after admission. We don't know if they didn't jog either. We just assume they were vaccinated.
There are unvaccinated people who have taken the trouble to report their non-consent. They did not want to be identified as jab refusers. If 2% of non-consenters come from the unvaccinated 20% of the population, then 1 in 10 unvaccinated people should have taken that trouble. It seems unlikely to me. Perhaps Maurice could gauge that?
Footnotes
- 1RIVM in collaboration with Julius Health Center: Information bias of vaccine effectiveness estimation due to informed consent for national registration of COVID-19 vaccination: estimation and correction using a data augmentation model
- 2
- 3The 90+ bars were iconic, while 90+ only covers 1% of the population. That would make a well-identifiable 1% of the population seem like an excuse for jabbing the entire population.

Thanks again, Anton. Still shouting in the desert. But glad there are still people who do this.
Another approach: What if the 'vaccines' had worked? Weren't we already completely thrown to death with successful stories? The government has all MSM channels and social media in its pocket. Maarten Keulemans occasionally makes a pathetic attempt to at least partially justify it. What Marc Bonten says in the AD is completely absurd, but it's all just in the newspaper.
Isn't it up to the vaccine advocates to prove that it worked? Instead of the other way around.
The fact that there are no such publications says it all?
Harrowing to see how vaccination victims are treated. Unfortunately, most victims don't even realize they've been hit by the Covid jabs.
How sick is a culture if those in power are not open to those who are victims of their mismanagement?
And anyone who criticizes is a far-right, anti-Semitic antivax conspiracy theorist. Nice and easy, but a very dangerous development.