
Dit artikel is destijds ook geplaatst bij maurice.nl en mede daardoor opgepikt door o.m. Thierry Baudet en Pieter Omtzigt, wat uiteindelijk leidde tot de motie Omtzigt.
Last summer we had to deal with an unprecedented summer mortality. It was already evident in May, but excess mortality was only occasionally reported. And still no alarm bells are ringing among our health guards. A status update of my posts from a month ago, supplemented with new calculations and recent figures.
[Edit: Also read the Eucalyptic Society's analysis of this article, link at the bottom of this page, which calculates that vaccinations are the main cause.]
Short recap
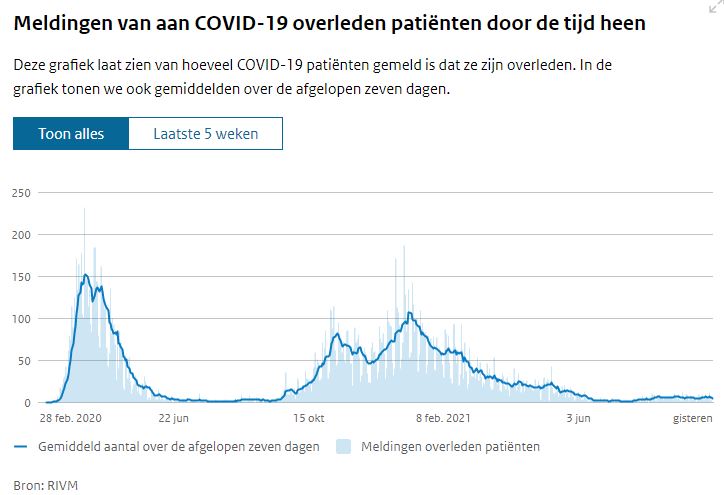
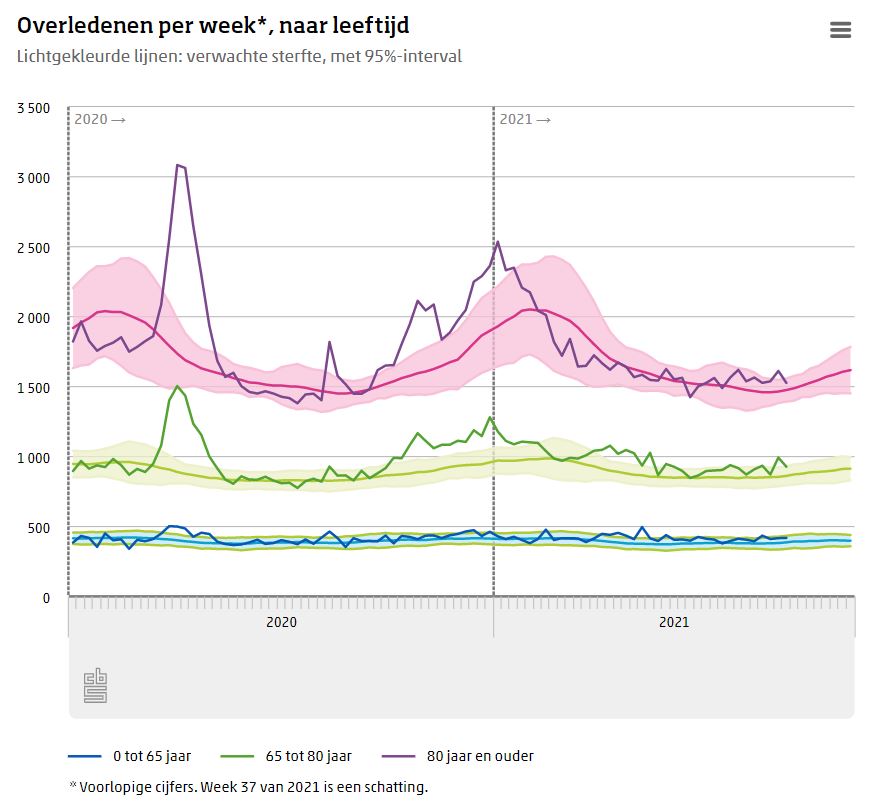
[Summary of the August article] On superficial consideration, Graphs 1 and 2 show a similar picture. Due to the high peaks, the smaller movements at weekly level are more difficult to see. Still, something stands out when you overlay the graphs: not every group follows the overall average of covid mortality. I have recolored the blue graph to purple so that it stands out better against the 65-80 group in particular.
Where there was hardly any Covid mortality, I informed the baseline of the expected mortality. The tops of the purple covid line are scaled to the tops of deaths in each age group. What stands out, see the highlighted part, is that the excess mortality has not been explained by Covid for months. All the more reason to dive into that.
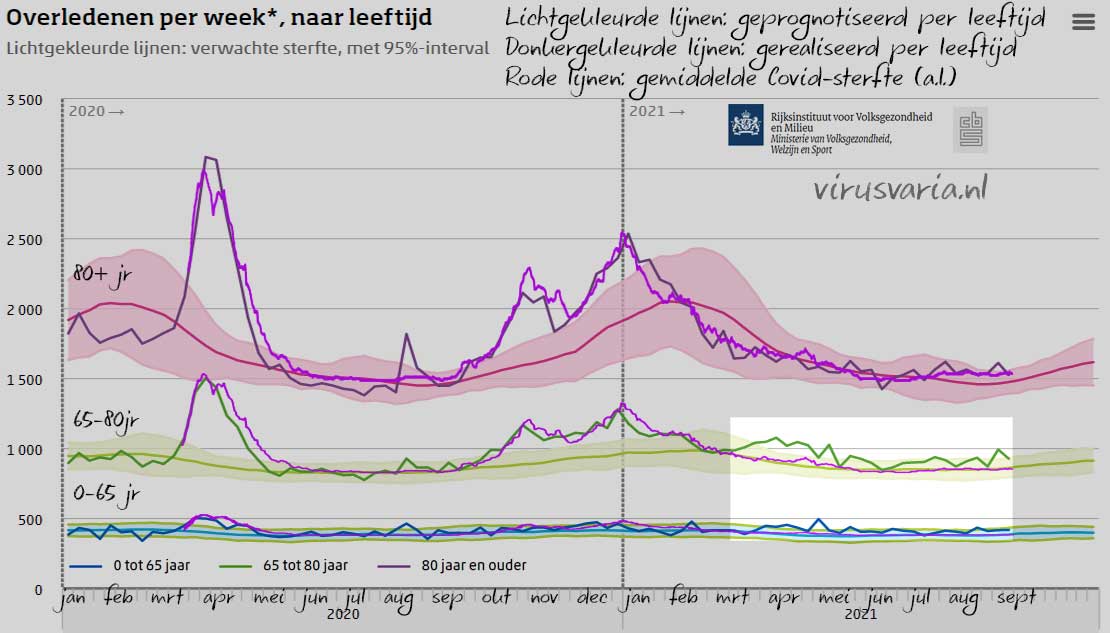
The largest differences occur in the group of 65-80 years. There is not much to see in the group of over-80s: with an average age expectation of 82 years, it is understandable that the differences in the older group of over-80s are less noticeable.
In the younger group of 0-65, mortality (and the seasonal effect) is naturally much lower and the differences on this scale are not striking. The totals are also much lower. Yet something similar is happening there.
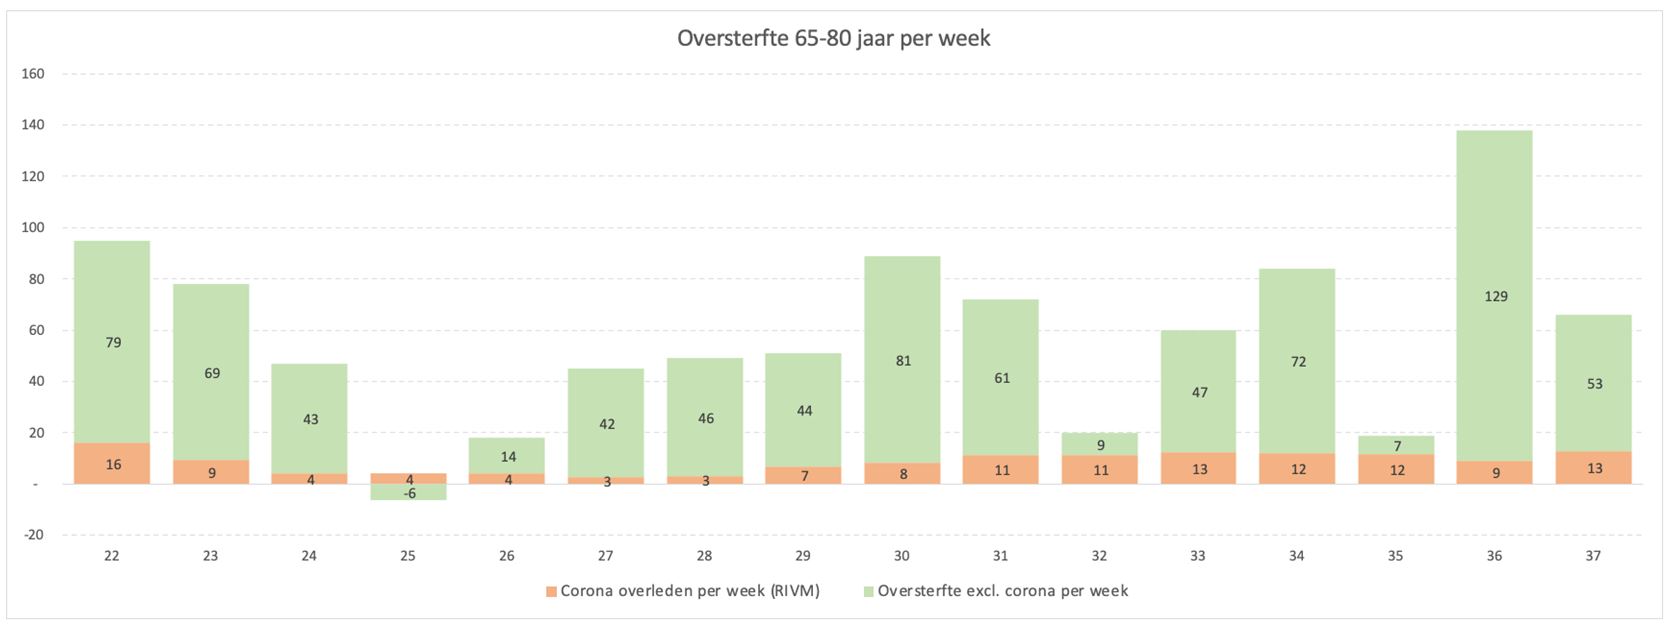
Looking at Chart 3, the phenomenon has been occurring since March 2021. For six months. In the past six months, however, the rivm has only reported excess mortality if the green line exceeded the margin of uncertainty. You would expect the value to fluctuate around the expectation from week to week, within the margin of uncertainty. That does not happen: it is structurally above expectations and sometimes even above the expected bandwidth.
No under-mortality
After the excessive mortality of winter 2020-2021, you could expect a period of undermortality. Nevertheless, we are faced with excess mortality. It is likely that the figures are weakened by 'hidden' under-mortality. If you take that into account, the image will not be any better. The group over 80 years of age would also be higher than the expected average.
Small probability calculation
We zoom in on the age group of 65-80 and then in the period when Covid hardly played a role, to prevent pollution. We take a shorter period from week 22 to now (week 37), which is from the beginning of June to the end of September. That is a period of almost four months (16 weeks).
You would expect the under-mortality to roughly eliminate excess mortality over a period of 16 weeks. If not, something must be wrong. If we simplify that idea, you can say that you have to be above the expectation line just as often as below it. This over/under-mortality equilibrium is comparable to flipping a coin.
For the idea: to flip a coin 16 times in a row, you have to mathematically flip a coin 131,070 times. The probability of that sequence occurring spontaneously is 0.0008%. If you see it happening, there is every reason to suspect the coin, toss it or count it or maybe something else, you don't know.
It may be purely coincidental, but in a period in which a List-A virus makes the country unsafe against which mass emergency vaccinations are hastily deployed, you should expect some extra alertness.
This has been going on for six months now, but we continue to look at the distinctly 'Covid-free' summer months, from June onwards. An economist and data analyst friend started working on that period and initially came back with the following data. (A further analysis is in preparation).
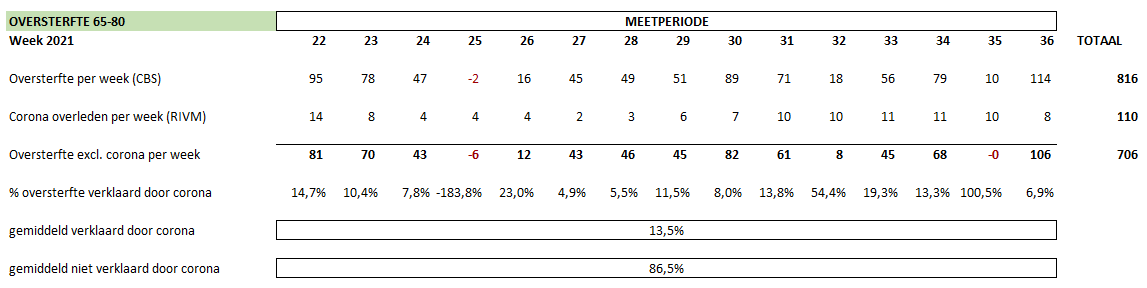
In the group of 65-80 years, only 13.5% of summer excess mortality can be explained by corona. No attention is paid to the remaining 86.5%. After all, according to our public health specialists, there is actually no excess mortality because it is generally still just within the uncertainty margin on a weekly basis. So all measures are aimed at those 13.5% Covid deaths.
Summer mortality 6.3% higher among 65-80 year olds
The total mortality rate last summer was 6.3% higher than expected, among the group of 65-80 year olds.

Of that surplus, only 13.5% has been explained by Covid.
How many people are affected?
Based on CBS and RIVM figures with week 37 (just downloaded), there are 942 people in that age group. The total number of additional deaths, including the other two age groups, is 2149, in 16 weeks. That's almost twenty people a day, three of them on or with Covid. Calculate that for half a year, so times 180. There are thousands of deaths, and I am approaching 3,500 so far (3492), taking into account rounding. And that is not mainly people in their eighties, as with Covid, but proportionally more younger people, not only under 80 but a quarter are even younger than 65.
Comparison with summer 2020
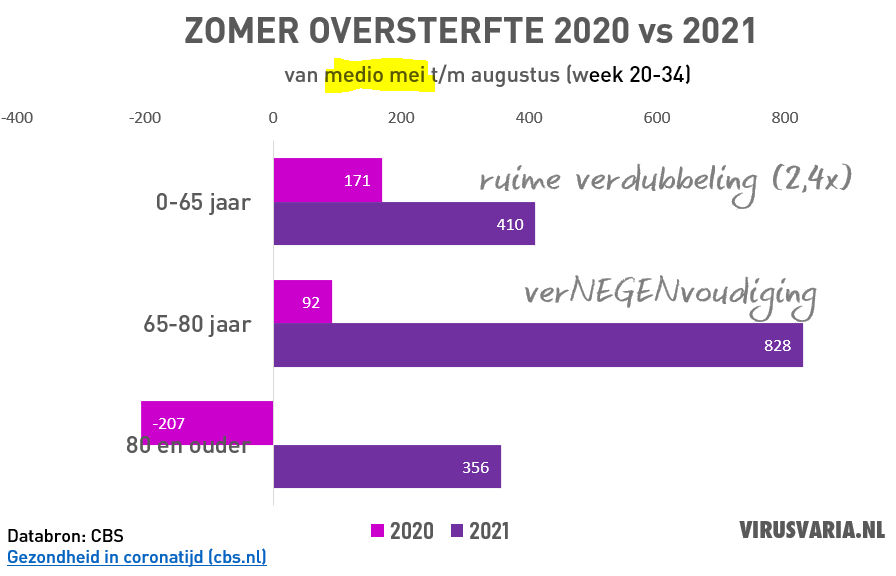
Comparisons with previous years also show that we are dealing with abnormal mortality. I have already shown this in previous articles. For example, this chart goes from week 20 to week 34. (The featured area of the updated chart at the top of this article shows that the pattern has continued in recent weeks.)
Comparison with previous summers
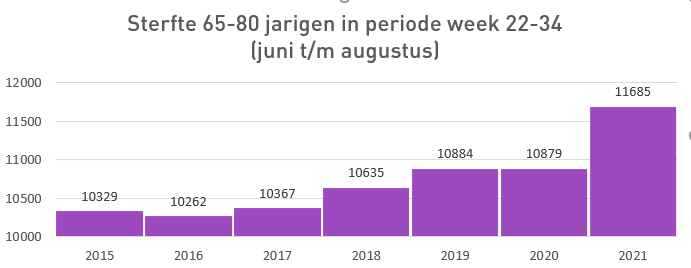
Previous years produce the same picture. We see an upward trend from 2016, which will have to do with population structure (but perhaps also with declining living conditions, who knows).
In 2020, that increase will stagnate, probably due to an under-mortality in response to the Covid mortality not long before. Covid can be thought away by taking a piece of 2019 and sticking it on in 2020, so that the trend is continued from 2015. Then you see the huge jump that summer 2021 makes.
Comparison with other countries
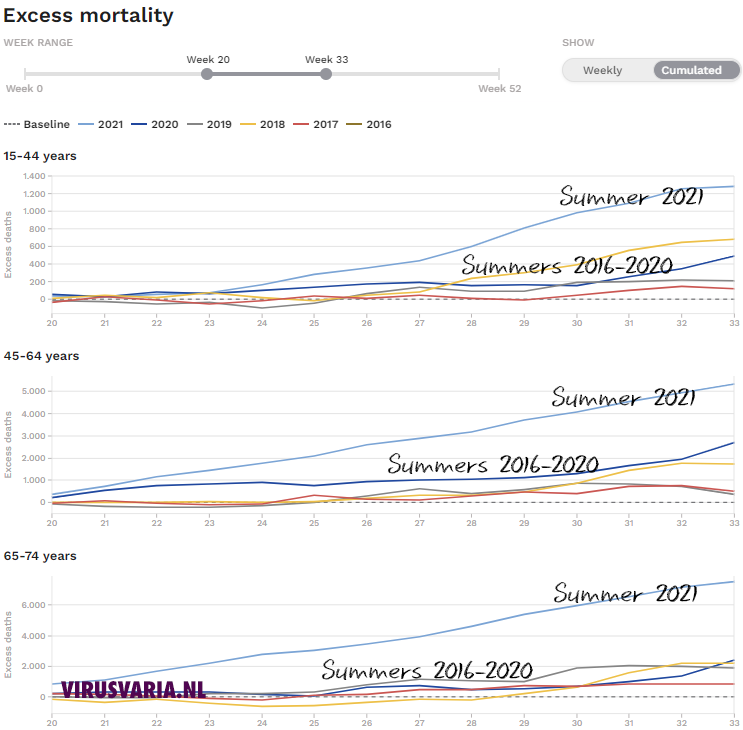
Euromomo is a website on which you can view the mortality rates of 27 member countries and to what extent they differ from the average of other years.
Here, too, you can see that this silent excess mortality causes striking numbers of deaths compared to previous summers.
Do they really have to compare the quarterly figures in six months' time to find out that a lot of extra people have mysteriously died?
Speculations
Should we start speculating about the causes ourselves?
- Gets the vws predicted loss of 520,000 QALYs, Cast aside by the cabinet, shaped in this way?
- Deferred care? Is it only happening in the Netherlands, with our weird care shortage? As you can see in Euromomo's Chart 7, we are certainly not alone. Further analysis could perhaps find a link between countries with care shortages and summer mortality.
- Is it general socio-economic disruption?
- Does crime play a role, domestic violence?
- Do restrictions on freedom, enforced behavioural changes, deprived future prospects have an impact?
- Does fear of death affect?
- Could it have something to do with the vaccinations, there may be a remarkable number of deaths from diseases such as heart failure or brain hemorrhages, sudden wrong blood values, something with platelets, spikes and ACE2 receptors?
- Immunity-related, after two seasons of semi-isolation an immunity atrophy?
As long as it is not paid attention to, we will have to keep guessing.
