
Suppose the Minister of Infrastructure and Water Management is flashed. He drives 80 on a road where you are really only allowed 60. An annoying issue that requires a solution and that is also found: his ministry orders to increase the speed limit at that location. An 80-km sign is placed and a new photo is taken. Problem solved: look, you can just drive 80. That's exactly what happened to the excess mortality limit. Just look: there was no excess mortality.
UPDATE: THE CORONA DASHBOARD WAS CORRECTED ON 4 MAY, A FEW DAYS AFTER THE PUBLICATION OF THIS BLOG.
Headlines:
- The government has changed the definition of 'expected mortality' on the corona dashboard.
- The upper limit of the uncertainty margin has been raised from 188 to 500. An increase to more than 250% of the previous limit.
- The structural increase in mortality since spring/summer 2021 will thus disappear well below the signal value.
- Future mortality of up to 500 extra deaths per week remains under the radar
- Excess mortality rates become incomparable with previous years (trend break)
- Other countries will receive much more excess mortality than we do in the healthy Netherlands. Comparing becomes difficult.
- For example, if the 'excess mortality' remains structurally at 400 deaths per week, theoretically there would be perhaps 20,000 extra deaths on an annual basis without there being any excess mortality. That is comparable to the number of people who have died from Covid in three years (!). Is the idea perhaps that we will accept that as normal mortality?
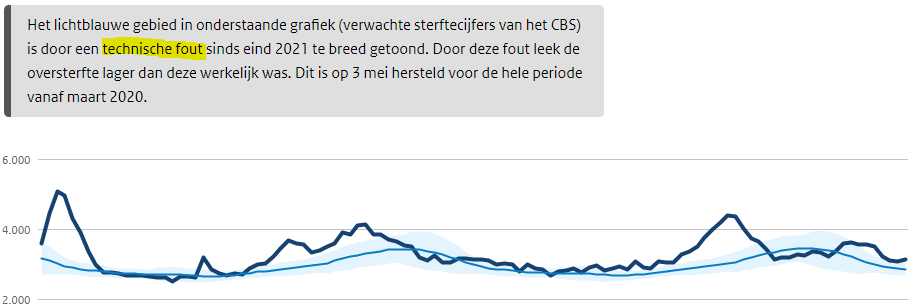
Kijk goed naar de lichtblauwe strook in onderstaande grafiek, dan zie je dat die afwisselend smal en breed wordt. De getalletjes veranderen ook. Op 23 december 2021 is de smalle strook vervangen door de brede, op het coronadashboard. Er staat bij: "Bron: CBS". Als dit inderdaad de nieuwe CBS-norm is heeft dit enorme gevolgen - en waarom zouden we daaraan twijfelen?
First read the text in the image, which shows the previous and the current graph alternately.
The light blue margin strip indicates that, based on previous data, there may be weeks in which CBS expects that there may be some more fluctuation in the number of deaths. This is stated in the unchanged explanatory memorandum. Within that uncertainty margin, values above and below the line normally cancel each other out.
In the summer this fluctuation is minimal, so we have no foreseeable periods (including weeks) with increased mortality. It is therefore immediately noticeable when there is an unforeseen heat wave to which the elderly succumb. The upper margin is then exceeded; a signal that something is wrong because that is excess mortality. Or rather: that was excess mortality. If we look in the picture above at the heat wave peak at the beginning of August 2021 (right above July 21), then that is only just under the new norm to call excess mortality. 500 more people may now die in a week than expected and during the heat wave there were 542.
The margin strip in the summer period has thus been made more than two-and-a-half times higher, from 188 to 500. Also in winter, the margin is slightly increased but much less, so that the seasonal effect is almost no longer visible. The band is almost the same width throughout the year. In the past, the winter margin was 7x as large as the summer margin. The winter margin is now only one and a half times as large. What's in store for us next summer, you ask? And why does CBS expect this?
At least, the government website states that CBS expects that. Strangely enough, the old standard is still used in the weekly reports on the CBS website itself. Is CBS working so slowly that the change from the end of December has still not been implemented? Or is it a political initiative by the ministry that CBS does not want to participate in? Answering the Omtzigt motion may take some time... Even though it is a crucial parameter.
Flip-out: How crucial is the upper limit?
Last year, CBS's weekly reports made it clear that a persistent increase in mortality near or just above the upper limit was not seen as alarming excess mortality. Perhaps behind the scenes, but in no case externally, even despite the fact that no compensatory periods of under-mortality occurred. Mortality in the Netherlands has remained strongly elevated for months in a row since the spring. After the mortality wave, of which you can see the decline above in the first weeks of 2021, strangely enough there is no under-mortality. Was that 'normal level' perhaps a disguised excess mortality? The level constantly hovered around the upper margin and no longer fell below the expected value.
Gloomy perspective
It is therefore very conceivable that in the coming months or years, 400 to 500 more people may die every week than we were used to and that this will not be seen as excess mortality. Then we are talking about a possible additional death of 20,000 people per year that remains under the radar as 'within the margins'. So here we make normal what was absolutely not normal six months ago. Is this a scientifically sound intervention or is it supposed to disguise something? (I can't help but think of flower shoes).
Now imagine that a chemical factory explodes or something happens to the drinking water due to a sunken toxic tanker with an illegal cargo, I name it. Or a poison train that overturns and contaminates the groundwater. While that rubbish was allowed into the country at the request of a minister, supported by scientists and enthusiastic media. Three quarters of the Netherlands receives that rubbish. Some die within a few weeks, but the vast majority are left with damage to the heart and blood vessels and cerebral blood flow, which they eventually succumb to. Some after six months, some after three years or more. Or if they come into contact with a virus. As long as no more than 450 die per week, there is no reason to sound the alarm under the new standard. See summer 2021. Exactly the same thing happened there with 150-200 people per week, for 30 weeks - and CBS did not identify a problem.
In the meantime, there is still no explanation for that excess mortality from spring/summer 2021, an excess mortality that still persists and is sometimes invisible because of a circulating virus with over- and under-mortality effects. That excess mortality has now been retroactively brushed away by the government.
Perhaps this will become the basis of the answer to the motion by Pieter Omtzigt om die onverklaarde oversterfte door een derde partij uit te laten zoeken: "Welke oversterfte?". De motie is van 2 december 2021, de wijziging is van 22 december, nog geen drie weken daarna. Men is zich dus terdege bewust van het probleem. Waarom horen we er dan niets over?
Politiek zou het zeer welkom zijn als blijkt dat we altijd veel te strakke normen hebben gehanteerd. "Oh gelukkig, we dachten alleen maar dat het oversterfte was - dat was helemaal niet zo." De wetenschappelijke onderbouwing voor deze escape laat vast nog even op zich wachten. Kennelijk is CBS nog niet overtuigd of... bestaat er daar de moed om aan werkweigering te doen. Dat zou hoopgevend zijn. Zo had het rivm ook voor de maatregelen moeten gaan liggen. Die kon het kabinet echter ook zonder hun hulp doorvoeren; rivm was slechts adviseur.
Road signal value
Below you can see the mortality in the 'quiet' year 2015. However, it's all about the gray lines. I took 2015 because in that year mortality was very even, so the lines are clearly visible. The gray lines are the mortality graphs from 2010-2019.
Sketchily I put the old top margin in green above it and the new one in purple, only during the summer weeks.
Are those grey lines from previous years really the basis for raising the upper value from 188 to 500 on 22 December 2021? Maybe if you want to close your eyes to excess mortality politically, but not if you want to signal it statistically?
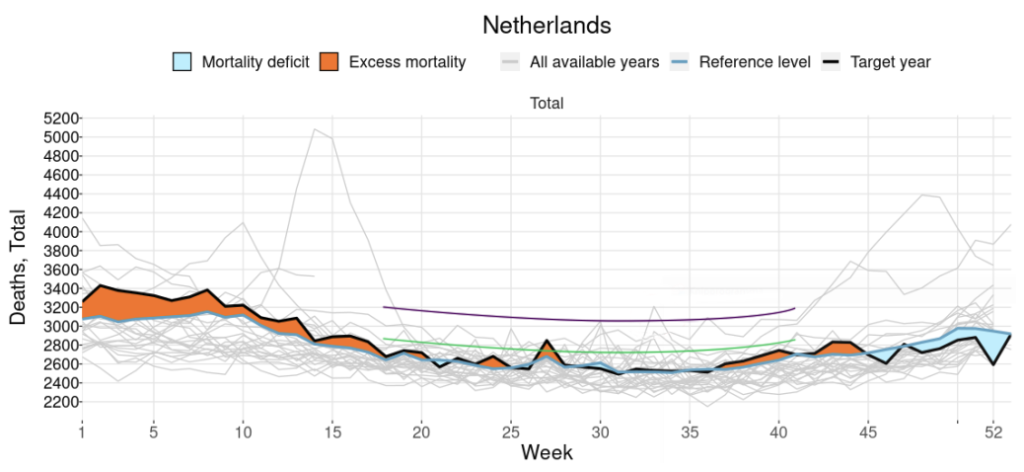
You will probably recognize the high peak on the left in the gray lines: the large first corona wave with the top in week 14 (of 2020). The dot that peaks above the purple line in week 34 is the heat wave peak of 2020. The other peaks that you see in the summers between week 20 and week 40 are often previous heat waves that will therefore go unnoticed in the future - at least not if periods of excess mortality are maintained. It looks like climate science. There is therefore no longer a signal value for these phenomena. Significant, structurally increased mortality is no longer excess mortality as long as the 500 per week is not reached. In a summer period of 20 weeks, this could amount to 10,000 deaths. More than an average Covid year.
Increased excess mortality stays under the radar for much longer.
Thanks to Jillis, Herman, Maurice and the HARROW for their support. At first, we all thought that CBS had adjusted the standards, as stated on the corona dashboard. But it's actually even worse. CBS itself still uses the old standard and does not seem to do what the highest boss wants. The Ministry of Health and the Environment itself:
- commits fraud in writing (CBS is not the source of the data in the graph at all, the crucial margins do not come from CBS)
- commits falsification of history by presenting 2021 as if it was already under 'the new regime'
- would like to have thousands of deaths disappear from the statistics, just when there is a thorny issue about unexplained excess mortality
- misleads the population by presenting wishful thinking as science-based statistics
P.S.: You would almost think that it has to do with side effects of the vaccinations heavily pushed by the same Ministry and that the excess mortality really has to be reduced, if it is not left, then it is right.
Virusvaria contains informative articles that deserve more readers.
Sharing, discussing or summarizing an article is (with reference to the source) very much appreciated.
Shorter link to this article:
https://virusvaria.nl/sterftefraude/


Thank you for this information. This is indeed disturbing.
Two questions;
Is there a place where I can find the old values to download?
I think it determined the expected values and the margin of uncertainty over the last five previous years. Have they taken the 2020s into account to determine the expected and uncertainty margin?
I don't know exactly; the old values can probably still be downloaded from CBS. In their weekly report, they are still working with that in any case.
Only on the corona dashboard are other margins. Willfulness or misunderstanding? Do they really come from CBS? So why does CBS use two standards? Or does the Ministry process cbs input? I don't know.
increased, from 2,695 to 2,697.
I think 2 people per week is 104 per year instead of 730 per year?
I have now removed that paragraph and that 104 is only correct if there is excess mortality every week.
What worries me most is that we as citizens seem to be trapped, anyway another "Covid" variant will emerge and we will be stuck with pointless and imposed restrictions again this fall and probably winter without being able to counterbalance it let alone refuse it due to sanctions/fines/loss of work & income. Meanwhile, the digital passport is already ready with the QR and we lose our freedom to vaccination obligation and other checks on everything we do digitally, such as banking and our mobile phone. Thank you very much for all the information, clarifications and explanations! If you can make this so clear to someone like me on a site, why doesn't this happen en masse and a government/mismanagement like this is not just denounced and stopped. this should not be allowed in a democratic country like the Netherlands! I think the whole tax system is already criminal when it comes to inheritance from your parental home and your own accumulated savings, but this is really unheard of literally and figuratively and it scares me a lot 🙁
Hi Jala, I already mentioned it here but here is a link to an interview from 2006. Yes I know it takes a long time that interview, maybe first watch from the 56th minute or so. But actually it is a nice story anyway. The link starts the interview with the question about (mandatory) vaccination Greeting v. Sander
https://www.youtube.com/watch?v=RcKIBgg-eQM&t=3589s
I have to say that, unfortunately, we no longer seem to be dealing with competent 'authorities' but with competent authorities. And where the authority falls away, grumbling and opposition will automatically undermine the power exercised. The government and its agencies always lose in this way; the only question is: how long this tampering can be seen ?..
Thank you for this clear explanation.
I hope that you and others (Maurice, EG, Maarten vd Berg, Daniel vd Tuin, Auke, etc, etc) download the original data and keep it very well.
One day all this fraud and polishing will come to light and then the 'real' data will be needed again.
In the meantime, I will continue to inform people and I hope that in the autumn, when of course respiratory viruses are circulating again, an even larger group of people will say: cabinet it is time for you to stop with pointless measures and even better, get on with it. We no longer participate in it.
Dear Anton, what a story again. Father government takes good care of us. Go back to sleep there is nothing wrong, the government tells us. Yes yes...
Well it fits nicely with a book I'm reading now, by Marcel Messing. Title is "Are We Waking Up?" In an interview around that book in 2006, he already mentions that in order to achieve a new world order, the most logical step is to declare a pandemic at some point, sow fear and then roll out a global vaccination program. Incidentally, he also mentions other measures such as far-reaching electronic surveillance and restrictions on civil rights, etc. Mmm... already expressed in 2006... Brrrr Hotels
Bizarre weather. But.... surely they can't hide this in the total number of deaths per year? So how does 2021 compare to other years? We know the number of people who have formally died from or with Covid. That way you have to see the pattern, right? Only annoying (for us then) that the data are only known at the end of the year.
I suspect that very soon all criticism and comments will be branded as misinformation by anyone. The logical next step is that your European Digital Pass will not only be linked to your health status, income and travel. Think of logging in to the computer so that everything you eat out can be assessed.
By the way, I would like to thank you for the work and the way in which it is effectively made clear.
Fraud seems to be increasingly leading where an unsuspecting citizen expects everything to be fine. In the link a glimpse into the way in which people are politically busy with each other:
https://www.youtube.com/watch?v=t2eAsoVYNho
All well and good, but you can't just increase the margins of what is normal for weekly mortality at will, without violating the laws of statistics!
There is a certain chance of a member of the Dutch population dying within a certain week. That probability can be described by means of a Poisson distribution. For the non-statisticians among us: take a look at Wikipedia, there this is well explained.
The expectation value of this probability distribution is around 3000. In a Poisson distribution, the value of the variance is also then 3000, and the standard deviation sigma is then the square root of 3000, which is about 55.
If CBS has so far used a margin of 188, that is not unreasonable. That is more than 3 times sigma. In statistics, it is customary to speak of a significant deviation. (Actually already at 2 times sigma).
And now that margin has been increased by CBS to 500, which is 9 sigmas !!
We are talking about the Central Bureau of Statistics, aren't we? You can assume that there are people working there who work something like statistics? Then I can well imagine that it is now war with the Ministry of Health, Welfare and Sport. Because as a statistician you can't let this go over your side.
Suppose you let this pass, how do you as a statistician at any time (because that moment comes !) still explain this ??
Again – because we have already experienced it several times – data is being misused for political purposes.
CBS still uses the old standard, just look at the weekly reports. The corona dashboard is on the website of the national government and there the graphs have been adjusted, while the explanation states that it is all CBS material. So that's... Well, not correct. It goes like with the face masks and the one and a half meters: It is not substantiated, it is not correct, there may even be opposition from CBS now – but the ministry just rams on.
Hi Anton, I myself started looking for clues in the code and I found this:
https://github.com/minvws/nl-covid19-data-backend-processing/blob/master/main/sql/data/CBS_Verwacht_Aantal_Overledenen_2020_2012.csv
On 16 April 2021, the figures for the expected mortality, with margins, were included. So here are the 'alternative' margins already, even before the excess mortality peaks have occurred, to which Omtzigt responded.
This does not mean that there is no harm in the sense, but it does mean that there was already an alternative determination of the excess mortality limit roaming around the corona dashboard team.
The file with the 'alternative' margins is most likely manual work: the margins save 1 with the values that are now in the graph, so probably a rounding error. Furthermore, there is a clear typo in the file name: 2012 must of course be 2021.
My guess is that there is backend code that converts the cbs data into a format that can be used in the frontend (in the code of the frontend you can only see that they expect integers from the backend).
Something clearly happened in December. Maybe a backend developer just thought to fix a mistake in a calculation by doing the calculation itself, just as happened for this file, not knowing that that's not the right calculation.
Interesting!
Only: this file of 16 April 2021 contains mortality data up to week 52 of 2021. It seems to me to be test data. But I'm going to compare anyway. Thanks!
Whatever else comes out, Anton: it's great that you stay alert to this!
Thanks Frans. Something has come out: the corona dashboard has been corrected, van Haga is going to ask parliamentary questions about this. If a thief puts something back after a hot act, is everything OK again?
Are they desperate? That's what I think when they do something so transparent...
For everyone who receives notifications on this post: the corona dashboard has been corrected, Van Haga will ask parliamentary questions about this.
Because if a thief puts something back after a hot act, is everything OK again?
But if I unintentionally forget to pay for something in the supermarket, brand it at home and then go back to the supermarket to pay for it. Am I a thief?
Or in this case: if the erroneous information was posted without bad intentions and now corrected, is that culpable? I don't see those bad intentions so quickly, because by publishing a smaller excess mortality, the government has presented the problem as smaller than it is.
You don't notice it at home, you get caught, and it's not the first time you've tried something like this. That feels different.
But why then propose the excess mortality smaller? I see here more of a human error than a big 'conspiracy'.
Human error is normal, but not if it gives the desired outcome. Would the mistake have been made so easily if it had come out that a giant overstefte would have taken place ??
Hi Hans, the point is that they prefer to keep the excess mortality small. Because then a) the vaccine has worked well and/or b) there are few excess mortality problems as a result of possible side effects of the vaccine. So.. on the contrary, it is very useful in the stall to show the excess mortality lower than really, especially since critical (but unanswered) questions about excess mortality as a possible result of side effects have been on the table for quite some time, also in the Chamber. This error is unfortunately a bit a la caught with the fingers in the cookie jar.
Excuse Hans I should have started with hi Theo. With this: hi Theo see my comment above!