
An important update on the advancing insight into excess mortality, also available at steig.nl
We have been dealing with persistent excess mortality since 2020, something that has now been contradicted by the RIVM. But when is mortality excess mortality? That is of course when the observed mortality (the weekly number of deaths) is clearly higher than what you expect. There we of course shift the problem to what that expected value is. So that is a prediction, a prognosis.
Choices
When making a forecast, we have to choose between two approaches:
- You look at what (development of) mortality was in the years that are representative of the death pattern.
- You look at the last few years and assume that THEY were representative.
The first method in fact excludes the corona years, because in these years mortality was increased, first due to corona and later "unexplained". It is precisely for this reason that CBS adopted the calculations in 2020 from RIVM, which would have included these years. Statistics Netherlands therefore makes a forecast based on mortality in the 5 years prior to corona. 2015-2019. The development of the population composition (the ageing population and the baby boom) plays the most important role in this.
We have also developed a model based on the same assumptions, but take 10 years into account for the forecast. This is described in this article: An analysis of excess mortality based on age and sex..... This allows us to calculate a forecast very precisely, broken down by age and gender. The annual figures are very similar to those of Statistics Netherlands, but the seasonal course is identical to the model that RIVM has been using for decades.
RIVM follows the second approach. They therefore assume that mortality in the last five corona years is representative and have been using this in their own forecasts since 2024. As a result, the upper limit of their forecast is now more than 8% higher than the forecast based on pre-corona figures.
Based on 2010-2019
Based on the current population composition as of 1 January of each calendar year and the mortality figures for 2010-2019, we can make a prediction of what mortality would have been if there had been no corona and no vaccinations. We also take into account a seasonal course as RIVM has been doing for decades, because it looks very reliable. We then get this graph:
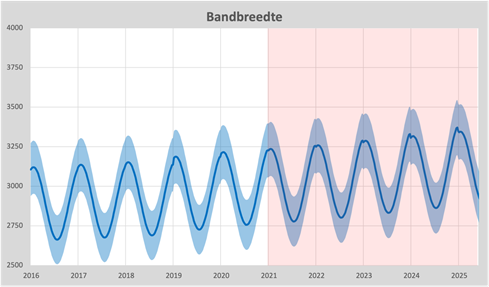
Since 2016, we have seen the baseline as a blue line and the bandwidth based on our own calculations. We see an annual increase of around 1%, which is adjusted on January 1 of each calendar year. So that is only based on population growth and age structure. Until 2021, the prognosis is based on the mortality probabilities 10 years earlier. From 2021 onwards, we will therefore take the mortality probability of 2020 and the population pyramid for the year itself. That difference is indicated by the light red background from 2021.
Excess mortality
Now we can draw the actual mortality in this graph and see how the observed mortality behaves in relation to expectations.
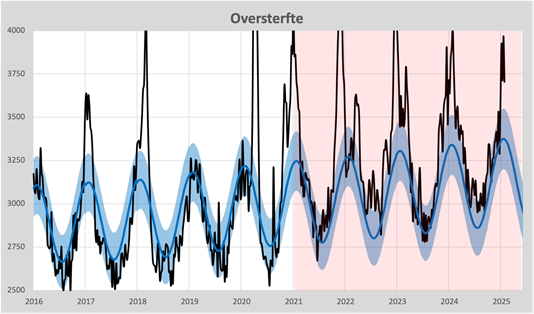
If we first look at the years before corona, we see that almost all mortality falls within the bandwidth. Only the flu waves of 2017 and 2018 stand out. We also see the ever-occurring undermortality after a flu wave (summer 2017 and 2018). The weekly fluctuations remain neatly within the forecasts, the blue bandwidth.
2020 also behaves completely normal in terms of figures. A short fierce wave due to corona and a significant undermortality afterwards. Well, of course, the second wave, because "corona was not done with us yet".
However, from the summer of 2021 we see a completely different pattern. A much more erratic course and mortality is almost always above the baseline. The average excess mortality per year was highest at 9% in 2021 in 2021 and then slowly decreased to around 6%. So there is still no undermortality by a long shot.
RIVM's prognosis
Since 2024, RIVM has taken over the art of forecasting from CBS again. To keep in touch with the years before corona, the previous years have also been mapped out. The RIVM's calculation method (average of 5 previous years) results in their forecast increasing by around 6% per year. After a forecast that was too low until 2022, the upper limit of the RIVM is now 8% higher than you would expect based on the demographic figures:
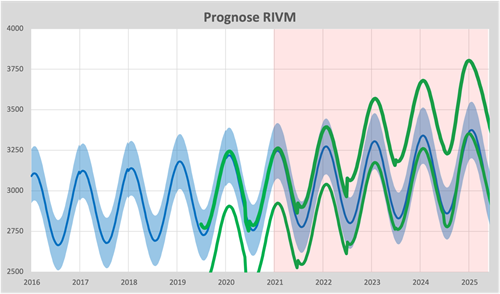
We also see the annual adjustments as of 1 July of each calendar year. Especially the one in July 2022 can be seen very clearly. The annual increases have ensured that the current excess mortality of 6% has been overtaken by the RIVM forecast. We also just see in this graph that the forecast has been brought forward by a month since 2025: the top is now already at the end of December and that was always at the end of January. Exactly what we observe in the mortality figures: flu comes a month earlier than before 2020.
A piece of cake to neutralize excess mortality. This will then be the graph according to RIVM:
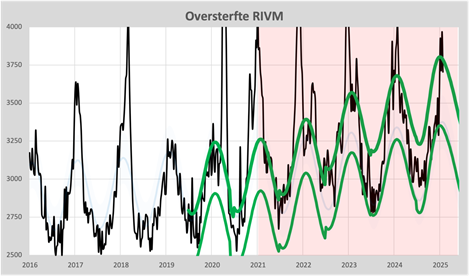
From 2024, excess mortality will be almost entirely "captured" by the adjustments to the model. Excess mortality has thus become a political choice and is no longer based on the pre-corona health situation.
Smooth
A final step in representing excess mortality is to "smooth" the baseline. By subtracting the weekly forecasts from the actual mortality, we are left with only the excess mortality itself. If we then include corona mortality and the estimated contribution of influenza in the same graph, we get a clear picture:
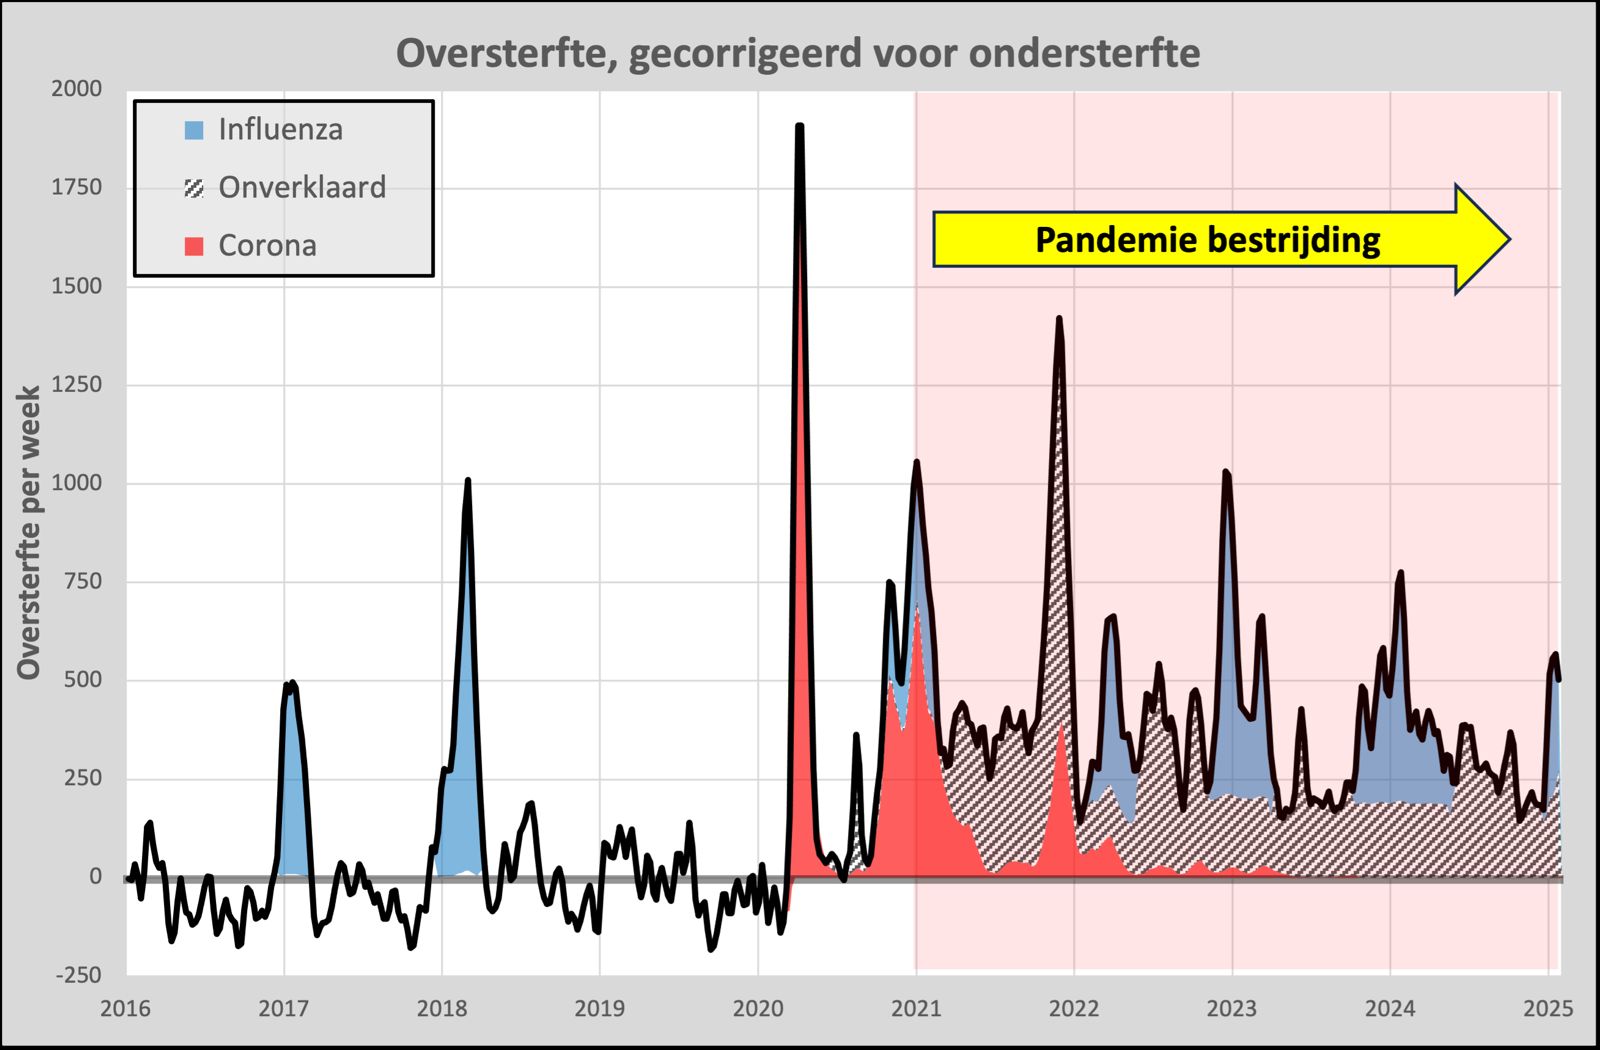
We now clearly see the contribution of corona to excess mortality. In 2017 and 2018 there were influenza waves that we can now compare with the influenza waves from 2022. Influenza in 2017 and 2018 started in January, while those from 2022 already started in November and also lasted longer. In fact, the Delta Wave started back in October and is still unexplained! The official figures from the RIVM explain only 20% with corona, there would have been no influenza, but what then? An influenza wave well into the spring...
We also see that weekly mortality has been structurally increased by around 250. Could that have to do with the pandemic control that started in 2021? Could this approach have affected our immune system?
This graph includes the ever-occurring undermortality after excess mortality. The mortality between the influenza waves thus becomes representative of the mortality that would have occurred without influenza, people can of course only die once! We are thus seeing a slowly decreasing excess mortality. We have to wait and see what awaits us this winter!
Conclusion
Excess mortality is determined by the choices made when setting the forecasts. Prediction has therefore been elevated to an art. Both CBS and we ourselves use the (age- and gender-dependent) mortality probabilities from before corona for this. That seems to be the most honest way to base the predictions on. RIVM uses the years with excess mortality to predict mortality for the following year. RIVM therefore predicts excess mortality and comes to the conclusion "Not increased". The excess mortality is therefore designated as "Not increased" and that is correct.

If we now agree that we calculate the "temperature rise" that would be going on with the reference level of the last five years, then there is nothing wrong at all! So stop the climate measures. Nothing to see here.
Yes, how about BMI?! I made that comparison here too...
That shifted top also nicely captures those strange new October peaks, because they would otherwise stick out so stupidly.
Had the page https://www.rivm.nl/monitoring-sterftecijfers-nederland Haven't watched it yet, just saw it now and you won't believe it, but the RIVM has already rewritten its own history!
Since this afternoon - without further explanation - they have had different, slightly lower expectations with retroactive effect from July 1, 2024. It doesn't make that much of a difference, but the fact that they are overwriting their own previous expectations looks bad. The expectation has also now been shortened by 2 months, instead of 3 months, now only 1 month ahead, especially under the motto: “You can always adjust it if reality turns out to be different.”
You'd have to laugh if it weren't such a deadly serious matter. Imagine that companies rewrite their financial forecasts afterwards to make their results look even better or less bad when they are in dire straits. This is just 1984!
I see the lower limit has been lowered and the upper limit increased. This increased the bandwidth by 25%, retroactive to 2022. Thanks for your attention!
It makes little difference indeed. It is common for them to adjust their expectations afterwards, they already did that in 2021. see https://virusvaria.nl/modellen-als-spiegels-van-de-competentie/
The RIVM appears not to be scientific.
The 'official' excess mortality has been concealed to such an extent that State Secretary Vincent Karremans and others believe that we will no longer have excess mortality since 2022 and that research is therefore not necessary.
The downside of the new RIVM calculation method is that we are now stuck with an unexplained lower life expectancy. Unfortunately, the latter has not yet reached politics. Enough reason to continue with parliamentary questions on this subject, I think.
Cumulative mortality may make it even clearer. Loss of qualities would further indicate the intervention as a negative influence.
Thank you for this clear explanation – it couldn't be clearer!
I do have one more question, “an influenza wave well into the spring”, which I do not see marked in blue in the picture. Did you forget to color it or am I misunderstanding that?
Well, that was corrected at the last minute, but the correction did not go through properly for me (I posted the article here). Thanks!
Good argument, but it will convince few in the mainstream, because it is just a model. Unfortunately.
I'm very much in favor of triangulation.
Why don't you include the figures that do not come from a model, but are rock solid and come from CBS.
1. Actuaries (mathematicians at insurance companies) have adjusted mortality tables. The expected age is decreasing. Very important for life insurance!
2. CBS reports a decrease in the expected age of death. FNV has already argued that the retirement age should not increase further, but should instead decrease.
These 2 pieces of information, in combination with the argument, make the argument much stronger. Especially if with that argument you could calculate (is that possible?) how much life expectancy has been shortened. If that matches the figures from CBS and actuaries, then you have a strong story!
Thanks for your feedback Jan.
The only thing that is a “model”, that is the baseline, the annual expected mortality based on demographics. This is therefore virtually the same as the CBS forecast, except that we adopt the seasonal fluctuations from the RIVM: a pure sinus with a predetermined course. The RIVM will adjust the amplitude of this sinus annually from 2022.
CBS uses a capricious bandwidth, a model based on the average of the weekly figures of 5 years.
We have also described life expectancy in this article:
https://steig.nl/blog/2024/12/08/wat-is-de-levensverwachting/
We have had to give up a year since 2020, which corresponds to what Statistics Netherlands publishes.
The government knows perfectly well that something is going on with those Covid shots.
They just don't want the general public to know that either. There could be several reasons for this. If it is publicly admitted, it is likely to cause enormous unrest and popular anger.
A lower life expectancy is financially beneficial, but that is a conspiracy theory.
The EU, partly on behalf of the Netherlands, recently purchased another 146 million Moderna shots. Parliamentary questions should also be asked about this.
See:
https://www.brusselstimes.com/1409349/european-commission-signs-contract-with-moderna-for-covid-19-vaccines
(LN had placed her comment incorrectly. It belongs here:)
Such a shame that all that money is not spent on preventing illness, e.g. improving ventilation, which can significantly reduce the spread of aerosols and therefore flu, Covid19, etc.
I am thinking in particular of schools, WWZ institutions, train/tram/metro/bus, but also restaurants, theaters, clubhouses, everything where people are crowded together and/or stay for a long time. And then regularly check the settings (is outside air being mixed? What percentage?) and replace filters.
It would be better to build new large vaccine factories in the hope (?) that there will be another Covid-19 pandemic. By the way, the construction of the large AstraZeneca factory in Liverpool (£450 M) has just been canceled…
Thank you Herman. You say “almost the same as CBS” but I see more than a year's difference in forecasts, and that from the start. How come?
Explanation:
In that article you write “These lines correspond well with the forecasts provided by CBS”. But if I remove the 2020 nods from the CBS lines, I find a “life expectancy” (actually mortality expectancy) for men and women for 2020 of 80.5 and 83.5 years respectively. for men and women. In your own graph these are approximately 82 and 85 years, so both are one and a half years more.
You're right. However, your/Herman's model, like any model, is always uncertain and is therefore open to discussion. While that is the crucial basis for the justified criticism of the policy, in my opinion. So RIVM/CBS simply says: "What's wrong with a base line equal to the average of the last 5 years, including the larger bandwidth. That's how we always did it"? And that is difficult to counter. And then there is id. no excess mortality.
Hence my plea for triangulation.
You can then demonstrate that the decrease in life expectancy calculated by Statistics Netherlands/actuaries exactly corresponds to the decrease in life expectancy due to your calculated excess mortality. In my opinion, this makes it clearer that excess mortality is not only a model issue, but also appears from other sources. That simply makes your argument much more convincing and therefore much more difficult to refute. And in my opinion, that should be our aim in a world where these facts are still denied.
I therefore argue for a link between the "soft" concept of excess mortality and the undeniably hard figures of Statistics Netherlands/actuaries regarding average life expectancy.
And then there is still the major challenge of irrefutably determining whether this excess mortality/shorter life expectancy mainly affects those who have or have not been vaccinated. This should be possible with complete micro-data.
I'm at a loss as to whether that data is complete or still not......
It is certainly an extra support for the chosen method and also seems feasible to me (but I may be speaking out of turn, because Herman is in charge in that regard).
Those who have/have not been vaxed will always remain within a bandwidth between a maximum and minimum scenario. Unless Trump annexes us (we also have a beautiful beach!) and makes all that protected data public 😉
What “hard” figures are there regarding life expectancy from CBS/actuarial science? The only hard figures that exist are numbers of deaths and their ages. It is helpful to count the number of inhabitants and even less helpful is the cause of death. So what is “hard” here? With a calculation model and assumptions you can construct something less hard from hard figures. The assumption that without corona/vaccinations health would hardly have changed is a very plausible assumption. You can use that in a model.
The RIVM assumes that health will suddenly deteriorate by 10% by 2021 and that there is no identifiable cause for this, which is quite something! That deteriorated health is then the new standard for life expectancy. So someone who is 80 years old and now dies from corona/vaccination participates in the life expectancy of someone who is, say, 20 years old. Trust the model blindly!
And again, which HARD numbers are most useful in describing the current health situation?
Jan, Herman replied to my comment instead of yours and I'm not sure if you will be notified. So here it is.
I personally think that validation with external figures (from actuaries, for example) might provide more authority. This does not make the figures themselves any harder. But actually someone else should do such an assessment, not Herman himself. Then you have another butcher/own meat inspection.
(this was in response to Miranda at 10:31)
This is interesting: according to CBS, men die at the same age again and their life expectancy is back to what it was before Corona. So then the excess mortality is over, right?
For women, things are slightly different, according to this article.
https://www.nrc.nl/nieuws/2025/02/11/cbs-sterfte-neemt-toe-vooral-onder-tachtigplussers-en-vrouwen-a4882669?utm_source=SIM&utm_medium=email&utm_campaign=nieuwsbrieven&utm_content=nrcavond&utm_term=20250211
And never forget: CBS previously found that there was excess mortality: NRC from 3-2-2023:
The studies are limited to deaths in 2020 and 2021. There was also excess mortality in 2022: 14.5 thousand more people died than expected. This made 2022 the third year in a row with excess mortality, CBS reported last week.
That just depends on expectations! If you assume that people will always live the same age, then it sounds good. But for many years, life expectancy steadily increased.
CBS therefore expected - apart from the dip in 2020-2021 - that the trend of previous years would be resumed from 2022. Via the link of Herman's article: https://opendata.cbs.nl/#/CBS/nl/dataset/84883NED/line?ts=1733052911887
But now, years after the corona crisis, life expectancy is still lagging behind that trend - for both men and women.
Good point. That certainly puts things into perspective.
I think it is arrogant (or whatever I should call it...) for CBS to predict in 2020 that life expectancy will increase by more than 5 years in the next 40 years. That is very optimistic. And assumes that life is very feasible.
Anyway, if you can really get cancer and cardiovascular disease under control, then a lot is still possible. `
In short, at some point I think CBS will no longer be able to hold itself to its old predictions.
But it is certainly true that the trend has been rudely reversed in 2020 (or at least 2021). And that requires better research than has been published to date.
Better research is needed, has been a long-standing request.
My research questions would be:
1 – in which age groups is there excess mortality (and then per 10 years, and not 0-65 years in one group)?
2 – for which causes of death is there a more than expected increasing trend?
3 – the percentage of {injected once or more} among the deceased is comparable to that among the general population. ?
Ad 1 – Herman has this, among other things, about this https://steig.nl/blog/2024/06/07/hoe-zit-het-eigenlijk-met-de-qalys/geschreven;
2 – respiratory diseases, non-natural causes of death (including accidental falls) and “other” show a striking increasing trend since 2020 or since 2021 (source: CBS cause of death statistics);
3 – is not easily stored, is poorly or incorrectly published; Herman has this, among other things, about this https://steig.nl/blog/2024/05/17/de-eindafrekening/ and https://steig.nl/blog/2024/11/11/oversterfte-bij-gevaccineerden-2/ and https://steig.nl/blog/2024/12/22/ written.
There is still excess mortality, but now mainly among the elderly. If a young person dies prematurely, this has a much greater impact on average life expectancy than if someone aged 80 dies a few years earlier. That is why the average life expectancy now seems to be approaching that before the corona period (or rather, before the vax campaign).
Young people no longer take booster injections (or repeat injections).
It is encouraging that the life expectancy of people who have stopped taking booster shots is increasing again. If you are not dead after two or three years after the last injection, then you probably have no hidden injection damage.
Nevertheless, I believe that vax damage and excess mortality should be thoroughly and independently investigated, and that lessons should be learned from it.
There is an equal amount of excess mortality at all ages if you compare it with a normal mortality pattern. I would even say: at younger ages, the picture is that excess mortality decreases at the age of 80+ and increases under the age of 70. But figures for 2024 are not yet available.
Herman, I thought you recently tweeted that excess mortality under 65 seems to have disappeared by the end of 2024???
The gem. life expectancy was at its lowest point in 2021-2022. The difference with before corona was something like 0.8 years. Now that difference is much smaller.
What about that?
Until 2020, life expectancy for women increased by one year every 12 years, for men one year every 4 years. In 2021, an average of one year off. We are now back at the same forecast as 2020, but an average of one year should have been added because we are living longer and longer.
That is logical and, in terms of extrapolation, completely true. And a sudden stop to that trend is also strange. So on that basis there is still excess mortality. At sometime.
But in my opinion you cannot hold on to the linear trend of prolonging life “eternally”. So at some point it becomes very difficult to speak of excess mortality on a scientific basis, if at any point mortality is a lot "better" than before Corona. I'll leave it open how big that “piece” should be...
What is and remains very relevant in my opinion is the degree of deviation in causes of mortality before and after Corona/the injection campaigns...
If there are major shifts in this, I believe there is still a lot going on, even if there is no longer excess mortality. And there are indications of decreases and increases in types of mortality...
Herman, thank you for this explanation. I attach great importance to your calculations. So there is still excess mortality, among all age groups, and life expectancy is about a year lower than expected.
A certain Hans Verwaart also publishes about this on X. He comes to the same conclusion.
This is a sad result. It makes it much more difficult to talk about this with people who have been injected several times. But I will keep trying with reference to your and Anton's findings. Thanks for all the work.
By the way, I am convinced that my own life expectancy has already decreased by a few years after just 1 injection. (I have recovered reasonably well, but still have palpitations, higher blood pressure, allergic complaints and IBS (irritable bowel). Before the injection I was perfectly healthy).