
Virusvaria readers will find in this article the confirmation of dozens of articles I have written on this subject since raising the issue of excess mortality in the Netherlands, from vaccination to deferred care. The article can also be found on Researchgate.
By Herman Steigstra in collaboration with Anton Theunissen, Jillis Kriek, Ronald Meester
Summary
We propose a different way of determining excess mortality. Our approach takes into account age and gender, but also under-mortality that you would expect after a period of excess mortality. After all, if this under-mortality does not seem to be happening, it is actually hidden excess mortality. The purpose of a better excess mortality estimate is first and foremost to determine whether this excess mortality is real. In addition, it is about finding clues about the cause such as Covid-19, delayed care or vaccinations. We note that excess mortality in the Netherlands remains consistently high during 2020 – 2022 and has shifted from high to low age and towards men. Here, we discuss the implications of these findings in the light of the possible causes of excess mortality.
Introduction
Excess mortality is a measure of how many more people die than you would expect, and occurs, for example, during or after an epidemic. We immediately note that in the case of excess mortality it is very important how many deaths were expected and it is therefore also evident that it is, to some extent, a model property. A different model for expected mortality yields different excess mortality numbers. It is therefore important to estimate the expected mortality as realistically as possible.
Every calendar year, CBS provides a forecast for expected mortality on a weekly basis. This forecast is split into three age cohorts: 0 - 65, 65 - 80 and 80+. Every week the number of deaths is counted for each of the three cohorts. If the difference for the week in question is greater than a certain bandwidth that has been determined in advance, CBS refers to this as excess mortality. In fact, CBS starts every week with a clean slate to determine excess mortality.
Due to this method of counting over a very short period of time, the uncertainty in the figures is very high, and according to CBS the threshold for excess mortality is often not met due to this uncertainty. This method is unsatisfactory for at least two reasons.
First of all, when mortality stays within weekly bandwidth limits, excess mortality is not ruled out. If you are on the same side of the bandwidth every week, then over a longer period this does inevitably add up to excess mortality. Here's an analogy that might be helpful. If a coin is tossed 10 times, an outcome of 6 heads will not immediately lead to the conclusion that the coin is not pure. However, if you see heads 600 times on 100 tosses, there is reason to doubt the purity of the coin. So, starting over every time is not a good idea because it’s all about the cumulative effect and decreasing uncertainty.
But there is a second reason why starting over every week is not correct. After a period of excess mortality, you would expect a period of under-mortality, because people in poor health died more often during the excess mortality period. If we don't observe that under-mortality, we're in fact dealing with excess mortality as well, although somewhat hidden in the dynamics of the numbers.
In addition to these problems, we must of course also look closely at the way CBS does its forecasts. Since 2 October 2020, CBS has been using a new method to determine the baseline (the expected number of deaths). This is described on their webpage Excess mortality and expected mortality. To date, the five years before corona (2015 - 2019) serve as a basis for the forecast during and after the corona years. That is logical, because the exceptional mortality during the corona years is of course not a good reference for determining expectations. The baseline is determined using the mortality probabilities from the period 2015 - 2019 in combination with the annually updated population structure for the years after 2019. This baseline is the expectation that Statistics Netherlands uses to make statements about excess mortality.
The baseline that we determine below turns out to be somewhat higher than that of CBS. This means that it is not down to our expected figures when we observe excess mortality where CBS does not. It really depends on the way in which you determine excess mortality.
We use the mortality figures and figures on the composition of the population from CBS itself, so there are no differences there either. However, we do show that we can use the CBS figures for mortality and population composition to make an accurate estimate of the number of expected deaths by age at death. We can then see if and how the pattern has changed since vaccinations started, which provides us with information about the factuality and causes of excess mortality.
Our method
In our analysis, we only use the primary data for the period 2010-2019 that is available at CBS for this purpose: the Population trends since 1950 and the Number of deaths per year. With the help of these figures, forecasts for the mortality probability are first calculated per year and per age (i.e. not per cohort as in the case of Statistics Netherlands, but for each age separately). Statistics Netherlands (CBS) has also published figures for this, but these ultimately result in incorrect annual totals.
The mortality rate
The expected number of deaths for each age is the product of the population size and the mortality rate. In doing so, we must take into account the development of life expectancy. In these calculations, we must carefully consider the age at death in relation to the year for which the population composition is tabulated. By using the combination of age at death and the average population composition for each calendar year, we avoid systematic errors in the calculations.
We then calculate a mortality probability for each age-calendar year combination as the quotient of the number of deaths and the average number of inhabitants for that year, each for men and women separately. A regression line is calculated through these ten probabilities (from 2010 - 2019).
To illustrate this, we give two lines, for men of 50 and 60 years old respectively.
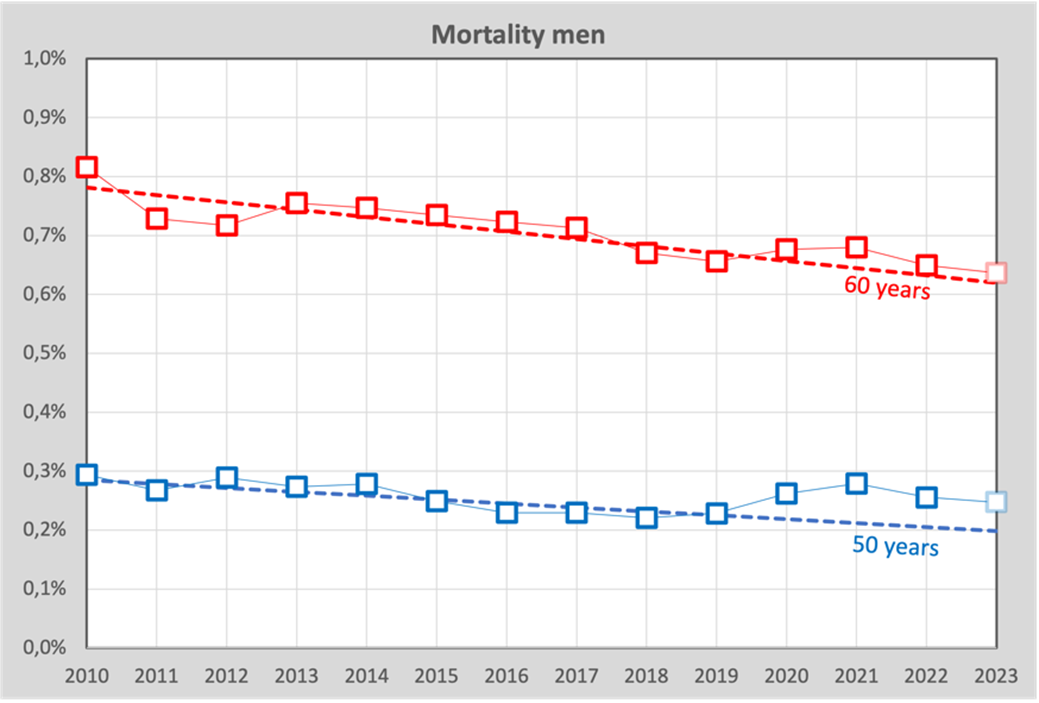
The dashed lines are the calculated trend lines through the years 2010-2019, the blocks are the actual death probabilities for these 14 years (2023 is based on an estimate). Based on the accumulated excess mortality up to and including week 43, a forecast for excess mortality in 2023 has been included. These lines are calculated for each age.
Before we continue, we make some observations about the regression line, which is based on the years 2010 – 2019, and is the basis for the expectation of the years beyond. A critic may (rightly!) remark that a regression line cannot possibly be "correct". After all, although the mortality probabilities are apparently structurally decreasing, it will be impossible to do so in a linear fashion in the future, because eventually the trend will have to level off. That is of course correct, but we have found that it makes virtually no difference in the short term that we are talking about here (a few years). A more sophisticated model will be able to better explain and predict the decline in mortality rates, and we can also apply a model in which the mortality rates stop declining at a certain point. This is important for longer-term forecasts, but not for the purpose of this article, as our own calculations show.
The results of the calculations are tables with mortality probabilities per age-year combination. Incidentally, we can already see something remarkable in the figure above: men aged 50 were apparently hit harder compared to the expected mortality rate than those aged 60.
To gain more insight into the result, we totaled the figures for two age groups as the mortality probabilities for 45-60 years and for 65-80 years; still broken down by men and women. The blocks are the percentages of actual deaths, the dashed lines are the forecasts under the assumption that there would have been no corona:

And for the age 65-80 years:
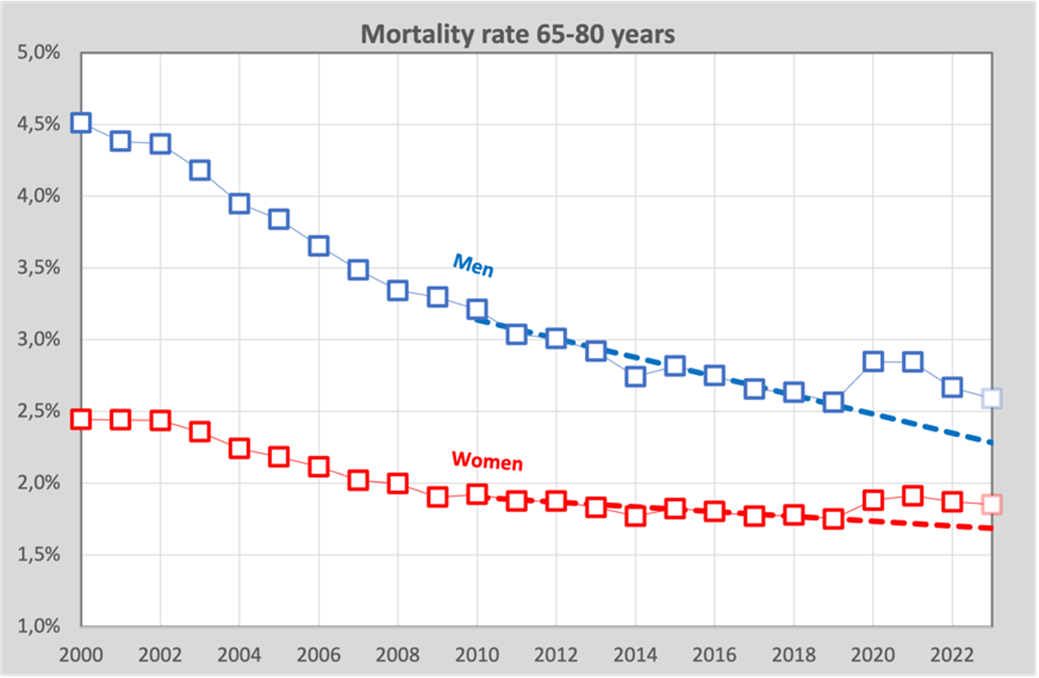
We see here that over the years, the annual chance of dying is slowly decreasing. Women still live longer on average than men (the annual probability of death is smaller), but the gap is narrowing. The mortality rate of men is now as high as that of women about 20 years ago.
What is also striking is that among women between 45 and 60 years of age, the mortality rate during the first corona year (2020) does decrease according to the multi-annual trend, but in contrast, a slight increase can be seen among men. In the first year of vaccination, we also see an increase in the number of women who have died. There is apparently a difference between men and women here, more on that later.
The baseline
The ultimate goal of these calculations is to obtain a baseline. The baseline is the expected number of deaths per age, based on mortality in the period 2015 to 2019. We can then use this baseline to estimate the forecast for the years after 2019.
For each year, we multiply the mortality the probability for each age by the size of the population for the group in question, and thus obtain an estimate for the number of expected deaths. In this way, we obtain a curve for each calendar year that predicts mortality per age. The difference between the actual mortality and the forecast (the baseline) is then the excess mortality. This is a different baseline representation than the one shown by CBS, which has the week number as its horizontal axis. Our baseline, on the other hand, has age on the horizontal axis, and now allows us to see exactly what happens to mortality in the years after 2019 compared to the years before.

In this graph, as an example, we see the baseline calculated for 2020 for both men and women. What is immediately striking is the sharp peak among 75-year-olds. This is a consequence of the baby boom, the birth wave in 1946 immediately after the Second World War.
The uncertainty
There is always a certain amount of uncertainty in the values of the baseline. As a first check, we compare whether the baseline values calculated along these lines correspond to the forecast issued by CBS. The CBS forecast is also a calculation with a mathematical model, based on population growth. It is not clear exactly how CBS takes into account the development of life expectancy. It will be interesting to see whether our totals across all ages are close to the annual totals of CBS. Below is an overview of the values that are found according to our calculation model compared to the figures published by CBS:
| Forecast Model | CBS forecast | ||
| Year | 2017 | 2023 | |
| 2018 | 151,969 | 150,885 | |
| 2019 | 154,000 | 152,508 | |
| 2020 | 155,666 | 154,253 | 153,400 |
| 2021 | 156,819 | 156,107 | 154,887 |
| 2022 | 158,175 | 158,035 | 155,491 |
We found several sources at CBS with different forecasts as well, two of which we show here. The most recently published baseline can be read in the article Excess mortality in September. The forecast from 2017 was closest to the baseline used in 2023 for 2021 and 2022.
The differences are not large and can be well explained by the differences in calculation technique. Certainly compared to the excess mortality numbers, which are in the order of 15,000 per year, the differences in estimates are acceptable. It does seem to indicate that CBS does not sufficiently take into account of the aging of the population, which means that our forecast figures are slightly higher, as we announced earlier.
The estimates for the mortality figures of CBS have clearly varied enormously over the years. For example, we find the estimate used for 2020 as published on December 19, 2017 of 154,247. On December 16, 2020 this figure increased to 164,092, almost 10,000 more. Here, corona seems to have been retrospectively incorporated into the forecast for 2020 and later revoked to the current value of 154,253. CBS does not make all of this clear on its website, and it is impossible for us to ascertain how and why the method has apparently been adjusted over the years. What is remarkable is that the baseline was apparently adjusted downwards over the years, resulting in a slightly increasing excess mortality over the years, according to CBS.
Excess mortality
Now that we have an expectation for the number of deaths for each age, we can graph excess mortality by age for each corona year. In the first year of the pandemic, there was almost exclusively excess mortality attributed to the coronavirus itself. Here is the graph for excess mortality in 2020:
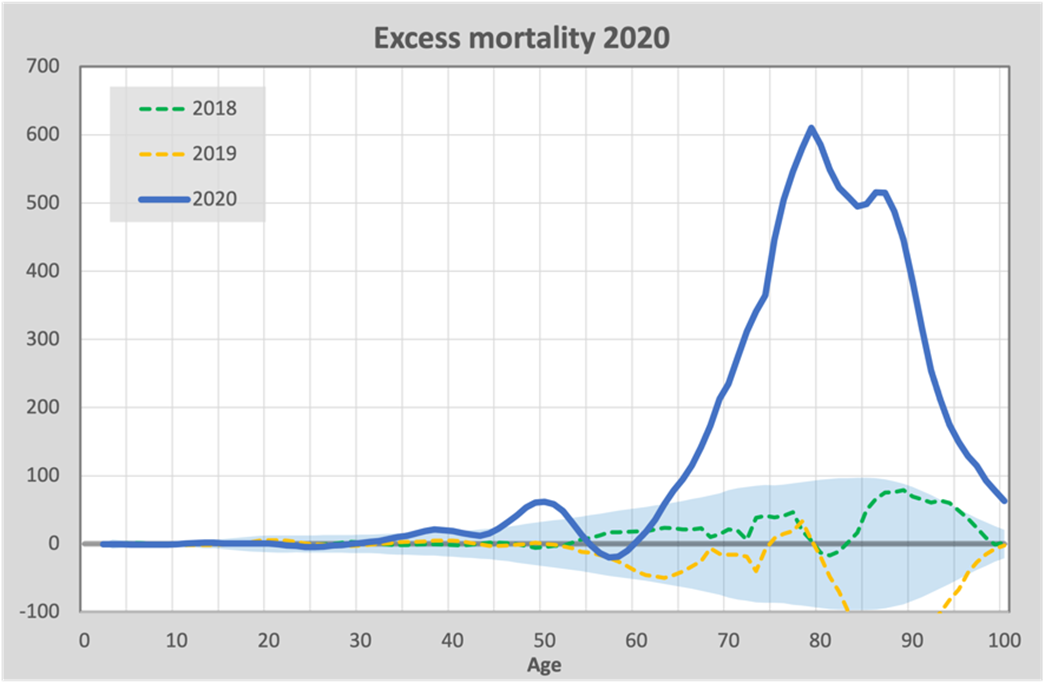
To avoid misunderstandings, we note that this is a very different graph than the previous one. In the previous graph we outlined the baseline, which in this new graph is flattened on the horizontal axis, as it were. So in this new graph, we are looking at mortality relative to the previously calculated baseline.
We see a total excess mortality in 2020 of 13,012 and this follows a pattern that we also see in flu epidemics: excess mortality almost exclusively over the age of 65. For comparison, excess mortality in 2018 and 2019 is included, where there was a flu epidemic in 2018 (green) and no flu in 2019 (yellow). In 2020, we see a much higher mortality in the same age group than in the 2018 flu. We can further clearly see that there is an under-mortality in 2019 that mirrors the excess mortality in 2018: under-mortality after excess mortality. We also expect to see this phenomenon in 2021 as a result of the high excess mortality in 2020.
As an indication, a bandwidth is also included. That is the range within which the number of deaths should lie with 95% certainty without an epidemic. We see that the wave at 50 years falls just outside of that.
Under-mortality after excess mortality
A period of excess mortality is always followed by a period of under-mortality. As we have already written, this is caused by the fact that a flu wave mainly affects the weaker members of society, who then actually die earlier than if there had been no flu. This is explained in more detail in this publication for example. For at least a year after a flu wave, there is under-mortality.
So actually, after the first corona year (2020), we should see an undermortality as a result of the first and second corona waves. However, we do not see undermortality, perhaps because the British variant and later the Delta variant came along. The actual excess mortality is somewhat distorted by the under-mortality that we do not see. If we want to make an estimate of the actual excess mortality, we need to include an estimate for this invisible under-mortality.
To get a feel for this phenomenon, we look back on previous years (2015 - 2019) in which years with flu alternated with years without flu. We calculate the total excess mortality during the first 4 months of each of these years (during which flu may occur) and compare it with the 8 subsequent months. If we depict this graphically, we get the following graph:
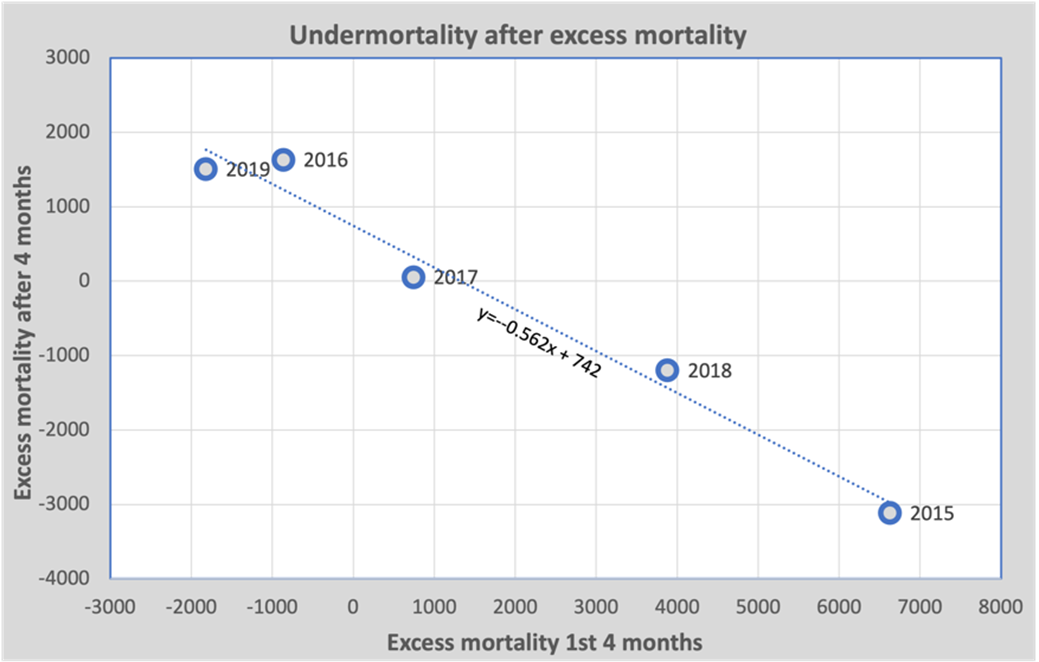
The horizontal axis shows the excess mortality during the first 4 months of the year. For example, in 2015 there was an excess mortality of 6629, followed by an under-mortality of 3111 in the remaining 8 months. The regression line through these points predicts that 56% of excess mortality in the first four months will be compensated by under-mortality during the following eight months – this is reflected in the coefficient of the regression line.
The question that now needs an answer is whether we can apply this model to excess mortality in the corona years. The calculations give a value for the eight months after an epidemic. In 2020, however, we are dealing with two waves in the case of corona. The first wave briefly caused under-mortality during the second wave, which became slightly lower as a result. The second wave certainly caused under-mortality in 2021. But it's not clear whether we could reasonably decide to use the same numbers – that's not how it works, of course.
However, the effect does exist. There are several choices to be made now. In the graphs below, we opt for a conservative estimate that only 50% of excess mortality in 2020 will have an effect on under-mortality in 2021, but someone who estimates otherwise can easily make his or her own choice in this regard. For him or her, the red dotted lines in the graphs below will turn out somewhat differently.
Excess mortality in 2021
Vaccination started in the Netherlands on 6 January 2021. The first vaccinations were administered in the first months of 2021, the repeat vaccinations a few months later and the so-called boosters in the autumn. The expectation was that vaccination would reduce excess mortality: we were promised 95% protection by Pfizer and the government. However, nothing could be further from the truth, and it's interesting to see what the numbers say:
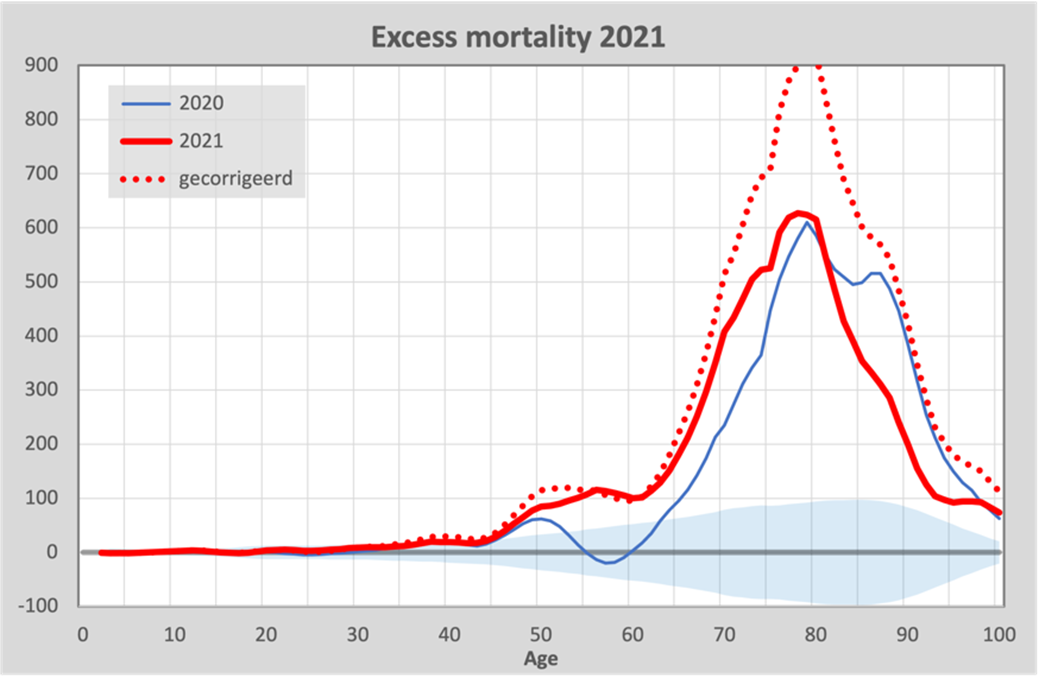
We see that from 2021 onwards, there has been some decrease in excess mortality among the very elderly, but it disappears after correcting for ‘under-mortality after excess mortality’. The red dashed line is the corrected excess mortality, by adding 50% of the excess mortality in 2020 to excess mortality in 2021 as we explained above. We emphasize that the magnitude of the correction cannot be accurately determined, but the effect itself is not disputed. Therefore, we chose a lower percentage than observed with an influenza epidemic.
But we see the biggest difference between the ages of 50 and 75. Compared to 2020, in 2021 we see an additional mortality of around 100 - 200 deaths per year for every age in this category. The government's official position is still that this excess mortality is caused by corona and delayed care, despite the vaccination, as described in the report by Statistics Netherlands (CBS/RIVM).
Excess mortality in 2022
By 2022, we had the Omicron variant, which ensured that there were virtually no more deaths from Covid-19. The excess mortality should then disappear, but it did not. On the contrary, we see a strikingly similar pattern as in previous years, re-emphasizing that the size of the correction may be up for debate:
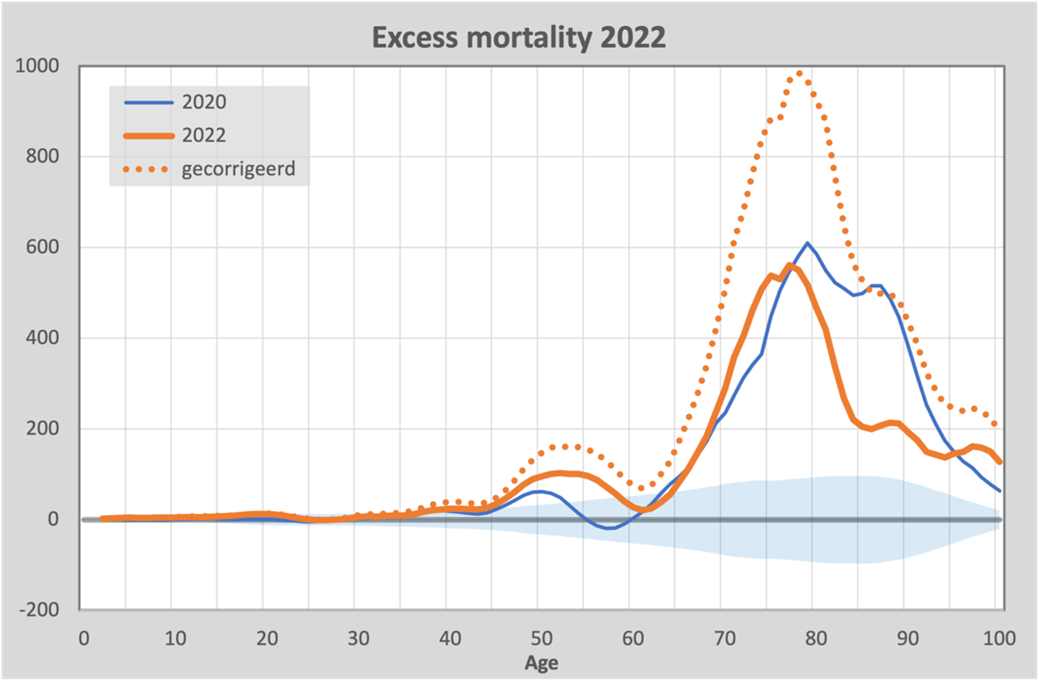
The rising mortality among the group aged 40 - 65 is particularly striking. This group is normally never affected by influenza that results in death.
Excess mortality in 2023
For 2023, figures are not yet available for the number of deaths broken down by age and gender. Of course, there are figures available on a weekly basis, and if we compare these with those for 2022, we see almost exactly the same numbers of deaths as in 2022. This is remarkable, because in 2023 there are virtually no more deaths from corona. In the Netherlands, these numbers are no longer kept by the GGD. There is still a quarterly report by CBS in which they mention an average of two deaths with Covid-19 per day. In Belgium, these statistics are maintained by Sciensano. They see less than 1 death from Covid-19 per day in Belgium. And yet, in the Netherlands there is just as much excess mortality as in 2022. We therefore use the death rates for 2022 as a prognosis for 2023.
The following graph brings together all the figures adjusted for under-mortality, including the forecast for 2023.
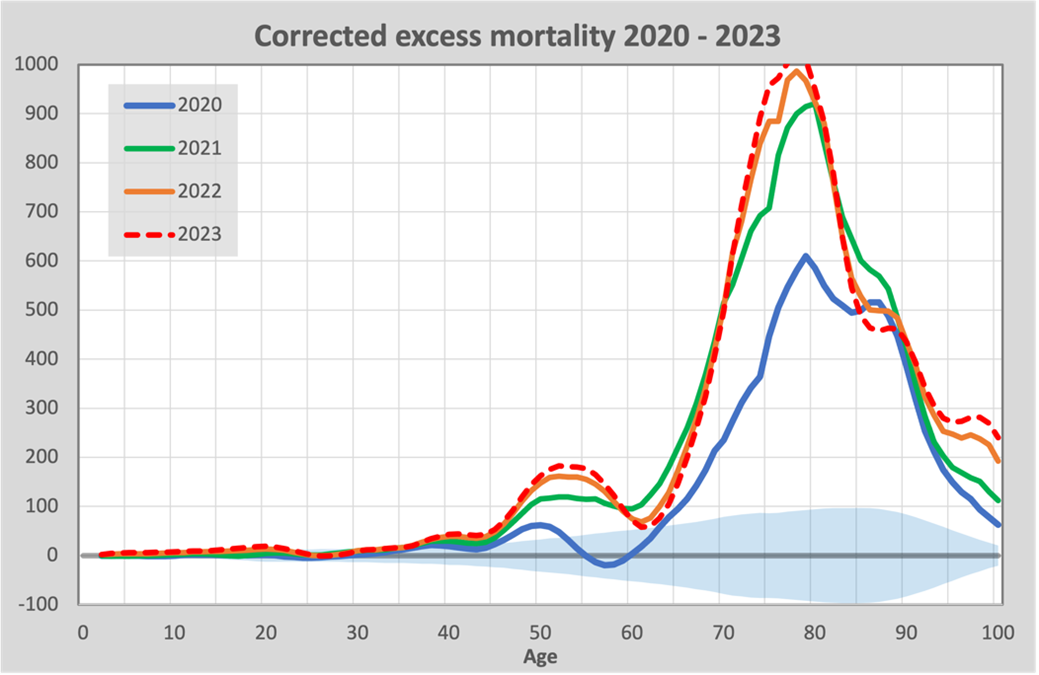
We see here clearly and unmistakably that there was more excess mortality in all the years in which vaccination was carried out than in the year without vaccination.
Mortality risks in percentages
It is mainly the elderly who die most often, but it is also interesting to look at the percentage increase in the risk of dying for each age. These are basically the same figures as shown above, but in proportion to the number of deaths you can expect for each age. The following graph shows that:

Here we see something special. For the elderly, excess mortality continues to fluctuate around 10% during the three corona years. However, for the ages under 55 years, it increases by around 5 -10% every year. The risk of mortality is increasing every year, while there is hardly any corona anymore. There are obviously no complete annual figures for 2023 yet, but the figures so far paint a picture identical to 2022.
Unexplained excess mortality
During the first wave of corona at the beginning of 2020, it was already noted that it was mainly the elderly and vulnerable with underlying suffering who ended up in the ICU and often died from it. Later, it was also found that the average age of death almost corresponded to life expectancy. The excess mortality was thus fully explained.
As for 2021 and 2022, the government is not very forthcoming. There is a site where we can query life expectancy but we find little information there. With the tools we just acquired, let's take a closer look. To do so, see this chart:
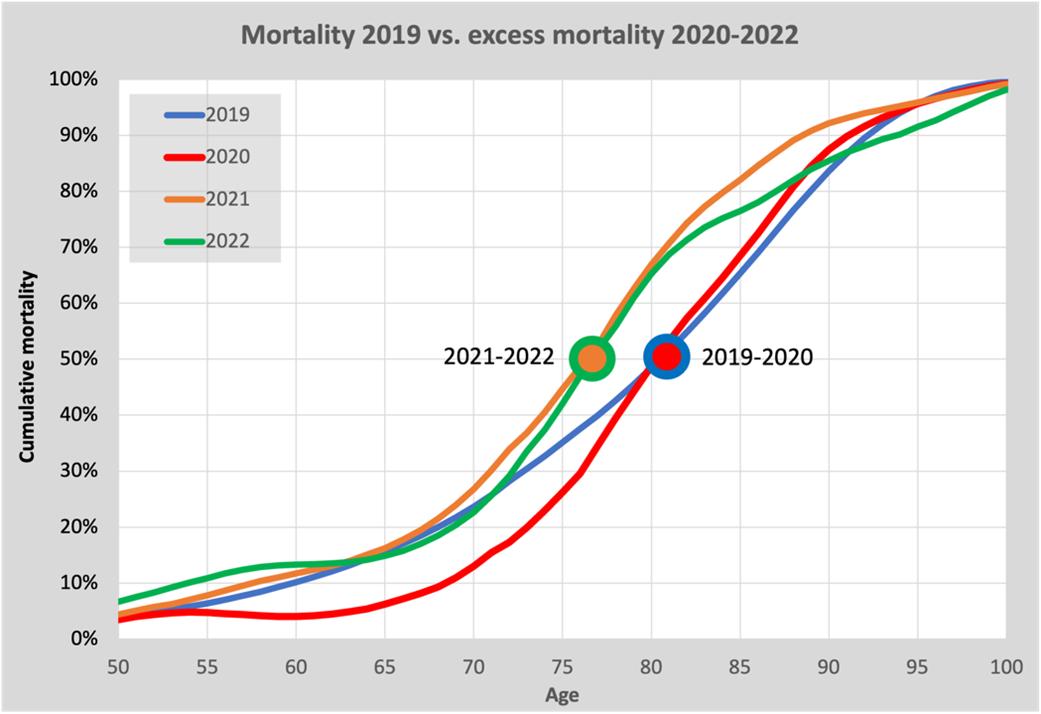
To get an impression of where the excess mortality comes from, we compare the excess mortality in 2020-2022 with the mortality in 2019. It may be a somewhat difficult graph to interpret because we are comparing excess mortality in 2020 - 2022 with mortality in 2019.
In this graph, cumulative mortality for 2019 is plotted as a blue line as a function of age at death. The part of the graph under the age of 50 is omitted from the graph, because there are few deaths there. We see here that exactly half of the number of deaths occurred under the age of 81.5. This age is the median and marked with the blue/red circle. This age also corresponds well with life expectancy according to Statistics Netherlands.
For excess mortality, we start in 2020, the red line. We see that the average age to die from corona has not changed compared to the normal average age to die in 2019: the medians coincide. However, there are clearly virtually no deaths from corona under the age of 65 and slightly more over the age of 75. This is all easy to understand if you keep in mind that in 2020 excess mortality was almost entirely due to corona.
How different the picture becomes in 2021: the orange line. The excess mortality starts to increase as early as 50 years of age. It is mainly the deaths below age 70 that bring down the average age of death by almost 5 years; a picture very different from 2020. And the most surprising thing is that the pattern in 2022 (the green line) is pretty much the same as it was in 2021. After corona has virtually disappears, the pattern does not recover: the 5-year shift remains. With an excess mortality of around 10%, this means a reduction in life expectancy of about 0.5%. We cannot escape the conclusion that a phenomenon other than corona itself is responsible for the unexplained excess mortality. That conclusion is not surprising either.
The causes of this unexplained excess mortality still remain to be investigated. The fact that since 2021 the age of death of this group has suddenly been lowered by roughly 5 years seems to rule out a number of causes. After all, hidden mortality from corona would only increase the number of deaths and it would not cause a shift in age. Furthermore, in infectious diseases, excess mortality among men is generally higher than that among women, as can be read here , for example. This difference also disappears in 2021, yet another reason to think of causes other than corona.
If delayed care were the cause, then this would mean that if the withheld care had been able to continue, a life extension of almost 5 years would be the norm. Even specialists think this is a utopia, so deferred care seems to be ruled out as a cause for lowering the age at death by five years. Moreover, it has not been shown how a period of withheld care in 2020 could be able to impact mortality in 2023 to this extent. This seems to exhaust the officially recognized causes of excess mortality.
Discussion and conclusion
The interpretation of these figures is not just up to statisticians. Medical specialists may want to comment on this.
It is evident that vaccination has in no way contributed to the protection of our health: excess mortality is still rising. Especially in the 80+ group, you should see an under-mortality after the severe excess mortality. This, too, continues to be absent. In fact, after adjusting for this expected under-mortality that we cannot see, there is even a sustained increase in excess mortality.
By emphasizing age at death, the picture emerges that since 2021 there has been a decrease of age of almost 5 years in excess mortality due to unexplained excess mortality. This does not fit with deferred care nor with hidden corona mortality as explanations for the excess mortality. Vaccination as a cause no longer seems so far-fetched.
Excess mortality in 2023 remained the same as in all previous corona years. If the first year of the pandemic was a pandemic of Covid-19, then the years that followed are a pandemic of unexplained excess mortality. So, no more Covid-19, but another vaccination campaign against this disease that is no longer prevalent.
Various causes seem unlikely in advance, such as delayed care and missed screening appointments. The government's refusal to investigate the possibility that vaccinations contributed to excess mortality is striking. A complete and open approach to the study of excess mortality should also take this factor into account. It would be better to rule the vaccines out, if only to try to restore confidence in vaccines and vaccination, which is showing a significant surge.
Hoe dan ook, er zijn in de cijfers geen aanwijzingen dat vaccinatie een gunstig effect heeft gehad op de sterfte. Iets wat je voor zo'n massale gezondheidsinterventie toch wel zou mogen verwachten. De politiek en de overheid wensen blijkbaar alleen naar de vermeende voordelen van de massale vaccinatie te kijken, maar lijkt blind voor de mogelijke nadelen. De geschiedenis van de geneeskunde heeft geleerd dat dat een gevaarlijke benadering is.
The underlying data and the Excel file can be downloaded from the website github.com.

Maybe it's the aftermath of the virus itself?
It is a selective virus if it is suddenly mainly preferred for men aged 45-60. The group that normally has nothing to fear from flu and such.
It has now been shown that it is a lab virus, through good investigative journalism. But I wouldn't dare to take the vaccine. If only because I've heard too many stories around me about serious suspected side effects.
After-effects that are more intense than corona itself, while we didn't even get sick from it? Isn't that what the vaccine was meant for to prevent that?
People between the ages of 60 and 65 have been vaccinated relatively little. Has this been taken into account in the calculation of effects? The same goes for other percentages of shots by age group.
The calculations do not take into account vaccinations or corona. In particular, it predicts the baseline for the years 2020-2023 and from there what excess mortality can be determined. From the pattern that then becomes visible, you can virtually rule out certain causes
Would be interesting. Because a few months ago, it was already concluded that deferred care did not lead to additional mortality in 2020, 2021, 2022. In that case, 'causes of other excess mortality' mainly involves vaccination damage. At most, you can argue about whether this percentage is 60 percent or almost 100 percent.
The article assumes that the excess mortality was almost entirely caused by corona. In the first year, it appears that significantly fewer antibiotics were prescribed. GPs were less so because they were partly closed and or did not want to let infected people in. In hospitals and care homes less so, because when people tested positive, they knew it was a virus, so antibiotics are useless. While every virologist should know that a flu virus infection regularly leads to (also) bacterial pneumonia.
No, we hardly mention that on purpose. However, we do mark the first year as "corona only" because there were no vaccines then. Correct note that mortality may be related to withholding antibiotics. We tried to stay away from the medical aspect and focus on the numbers themselves
It's great that Ronald Meester is also joining us!
The excel file is still missing on github.
Excess Mortality Model is a txt file.
Or am I doing something wrong?
Apparently something went wrong during installation. It should be there now
Good to read, and really appreciate all this research.
From a formal point of view, of course, it remains a matter of conjecture. But those jabs are really suspect number 1. Every other suggestion I've seen is nonsensical. Also look at the statistics in Australia, for example, and every country where there is heavy vaccination. Let's not forget that Sweden and Denmark stopped vaccinating people under 60 or 65 quite quickly.
The current round of vaccinations also seems to result in additional mortality. This is mainly in the older ages. If the excess mortality is in the same age group as the current vaccination round, it will be very difficult to identify a suspect other than the jab. But I don't think I need to tell you that.
Something else that still bothers me: In the past, vaccines have been taken off the market for less. But... not all serious side effects and deaths follow the jab with mRNA vaccines. These spike proteins can also act as a kind of time bomb. After six months, the heart can just give out, and most people no longer make the connection. Is also much more difficult to prove than someone who dies within a day. So... Of all the 'died suddenly' cases, having the vaccination status would be nice. Not necessarily in the Netherlands, right? Get the impression from VK that they have more data there.
So what you are missing is vaccination status of the deceased?
That's what everyone is missing indeed. That is why we have to constantly take detours to indicate that there may be something wrong with it. We can't go any further (except when I sometimes get 😉 out of my way)
It shows your humanity, Anton:-). You have to be super stoic not to get distraught from time to time by the idiocy around us. Slipper shooting can also be functional:-). Recently we met someone at the movie 'Total Trust' (recommended, but also terrifying), who portrayed it beautifully. Once you see it, you can't go back. No 'red piller' suddenly starts to believe in the narrative. So there's only one direction. And once you discover some cracks in the narrative, anyone with enough functioning brain cells will find out that the whole story is bullshit.
But then you have to carry it with you, and you never see the world the same again. At least that's been my experience.
For the time being, more than 3400 deaths in week 44.... There go a few full Boeings.
If you look at the graphs showing the typical trough at 60, you would say that flu vaccination has a beneficial effect on your health around that age. I don't like that thought because I never believed in that jab. But I didn't expect the non-specific positive side effects that Christine Stabel Benn found with some vaccines either. The bump at the age of 50 is also special. I feel that 50 is a dangerous age for heart problems, but when I look up numbers of cardiovascular diseases, death mainly occurs at a later age: 65 to 75 years.
Interesting analysis. Good to see that there is no effect below 40. There has been outrageous pressure on young people in particular (I mean people in their twenties and teenagers) to take a vaccine for a disease that did not affect them.
Statistics Netherlands (CBS) figures showed that in 2020, the number of deaths from lung diseases and dementia fell by a few thousand compared to previous years. For a net effect, you would have to subtract those deaths to arrive at the more accurate number of 'deaths mainly due to corona'. 'More correct' because withholding medication etc makes the net number even lower.
Is it possible to specify for 2022 and later for 2023 which diseases are killing more people than before the corona period and also compared to 2020-2021?
Isn't it well known that – especially in 2020 – everyone who died WITH corona, including people with lung diseases, dementia, etc., was compulsorily written off as the "cause of death corona"? Surely that seems to be the most obvious explanation for this "decline"?
Dear Herman, and the rest,
Thanks for sharing the data. That always shows better how someone has worked.
I'm not going to figure this out in an hour, just like you didn't make this in an hour.
I'll build up slowly I suppose. But here are some initial questions.
1. ik zie in de brondata (“MalCnts”en “FemCnts’), dat leeftijd 0 jaar, van 1994 => 1995 de data halveert, bij zowel de mannen als de vrouwen, en in 2022 => 2023 weer naar verwachte aantallen gaat.
Could you check this? This will hardly affect the other calculations, but I suspect a small data shift.
2. The population grows throughout the year. I usually use the population numbers on January 1st. Which point did you choose?
3. To create a baseline, use the "Linest" function. This gives a value of the trend of 2010-2019, and then you add it to the mortality of 2022, to arrive at a 2023 forecast.
Can you explain why you are using the 2022 data to come up with a 2023 forecast? instead of, for example, using the "Trend" function, and making an estimate / forecast for 2023 based on this trend?
The "Trend" function extends the trend to the desired year, as it were. Then you are not dependent on fluctuations in the previous year, but previously accrued deviations in 2020 and 2021.
I will go through the data further, and if any more questions arise, I will report back.
With fr. greeting
Bonne Clock
The halving will have to do with the average number of inhabitants.
As described in the text, I use the table with average number of inhabitants.
The values for 2023, like those for 2020-2022, are based on the trend line through 2015-2019
Will you also take into account by now that the state and CBS will blame the aging population as much as possible? Hopefully, the independent investigation will be completed financially in early 2024, that still seems to be a challenge, I appreciate this extensive analysis very much, after all, interests are high to continue looking for the cover-up.
Everything is calculated by age year here. This includes the 'ageing ages' and we also know the absolutes per year. Playing hide and seek is no longer possible.
Actually, a CBS answer in response to my WOO request about excess mortality and vaccination.
Obviously very unsatisfactory, but they get follow-up questions by return mail.
See http://disq.us/t/4m77hjq at Maurice's.
If you send me an email, I'll send you the complete docs.
I would really like to see a graph of the average age at death of all those who died that year vertically against the relevant year horizontally.
That is a very easy graph to determine, it cannot be tampered with, and the precise cause of death is not important here.
Calculating it per year averages out normal seasonal influences nicely.
A sharp drop in the average age of death from 2021 would strongly support a planned depopulation argument, especially considering that corona gain-of-function research has been going on for decades, which is undisputed by many patents.
The graph can also be shown per month with a running average over the last 12 months - such as when the monthly inflation rate is determined.
I really don't see how a decline in life expectancy should support a depopulation argument. But you can find such a graph, for example, at the Royal Actuarial Society in the AG forecast table 2024 . That's this graph:
Here are the graphs you are looking for:
https://steig.nl/2025/07/hoe-dodelijk-was-corona/
That graph is correct. not much to “mess with”.
But unfortunately that graph doesn't say much, because it doesn't account for aging and possibly... other effects (such as immigration) have been corrected.
See the detailed discussions and conclusions about this elsewhere on this website.
That is of course nonsense. You see that there are %'s along the axes, SO it has been converted as a % of normal mortality. So this graph says it all. Excess mortality has shifted to lower ages and disappeared at older ages.
In addition, I assume that vaccination damage is a more or less constant value. Take 1:1000 as an example. The risk for the oldest ages to die naturally is in the percentage range. At 90 years even 10%. Then the extra chance of dying from the vaccine is negligible, or the normal risk of death due to the absence of corona. Break-even is around 65 years of age. This includes an increasing risk of death due to vaccination. That's what we see here
I didn't respond to your graphs, because they have those corrections in them.
But to Steven's literal question.