
Virusvaria was too early in August 2021 to draw attention to excess mortality. The first signals, both in figures and in warnings from a few experts, required further investigation, but that did not happen. Even when a strange excess mortality clearly became visible in April. Since then, I have sporadically continued to report on this. I mention it sporadically because the problem should actually have continuous attention. There are still unnecessarily many people dying and there is no thorough investigation into. Institutes that have communicated incomplete and mutually contradictory figures, on the other hand, are given the opportunity to rearrange those figures ('plausibilize').
Side effects with a long incubation period
Until now, in my previous articles, it was unclear where the time difference between the injections and the unexplained death wave came from. After all, that was not possible. In all studies, including the well-intentioned attempt at statistical confirmation by Ronald Meester and Wouter Aukema, deadlines were set of 'within two weeks' or 'within three weeks' after the injection. Because then there are side effects – say the experts. While you could see with your naked eye that that was not what happened in practice.
That short term also appears to be a misconception, as we have seen more often from the government virologists' corner. A bruise on your arm: yes, you get it quickly. Some elevation, I understand too. But systemic conditions can take much longer to manifest. For example, a heart attack sounds like a sudden attack. However, this may have been preceded by months of deteriorating vessels.
The blue bars (number of injections administered) rose quickly, but unexplained excess mortality (non-covid) did not increase until more than 20 weeks later.

Yet that burst of deaths from causes other than covid, shown in the green bars, had to come from somewhere. But from where?

Spike inflammation still detectable 8 weeks after the injection
In the meantime, it has been found that mRNA is certainly eight weeks after the injection can still be demonstrated in the lymphatic system. While the original story of the experts was that it would be demolished within a few hours. That flutters away, I can still hear them say it. "Like a snapchat" – wasn't that Robbert Dijkgraaf? And it "stays locally at the injection site"... yes right.
A conventional vaccine, consisting of an incapacitated virus, our body knows how to deal with it if some of it ends up in the blood – which inevitably happens, even if you aspirate. That 'organic waste' is neatly recognized and disposed of. But artificial construction plans for a protein from a virus, that's something else. These building plans go throughout the body and in the strangest places stimulate the body's own cells to make spike protein, against which your immune system then comes into action and causes inflammation. At the end of 2020, there was already such a plausible warning against this that I dedicated a blog article to it: Oops – am I going to be an anti-vaxxer? But yes, that insight came from a previously canceled scientist who had dared to ask something about vaccines at the time. So that didn't count, at least for virtue lovers.
Detection technique improved: it doesn't come from Covid
Autopsies orphans before on vaccine causes in death due to previously unobserved patterns of spike protein spread and inflammation. At that time, it was not possible to distinguish between spikes of the virus and spikes of the vaccine, so Covid was repeatedly pointed to as the cause. Now that distinction can be made by means of 'staining' – and the suspicions turn out to be well-founded: it is indeed vaccine-induced.

It is quite conceivable that, for example, organ damage, blood vessel disorders or (other) internal inflammations have a fatal outcome, let's say on average within 40 weeks. Assuming a normal distribution, you would then see a bump around 20 weeks. The graphs above could illustrate that hypothesis. Now this is purely hypothetical reasoning towards the data, but the worst thing is: no one knows exactly, not even the people who roll it out worldwide and the health institutes that approve everything.
Pierre Capel tells a bit more about the distribution of the spikes in the body on bitchute.
Data from England: mortality period significantly expanded
So it is no longer two or three weeks after the shot. Also in the latest data from the UK longer periods are no longer excluded. See the Tweet from O.S. With all graphs you have to read the texts carefully because sometimes they look similar while they show something different.
Some graphs show the All-cause mortality: the total mortality, regardless of the cause of death. I would like to give such a graph some attention.
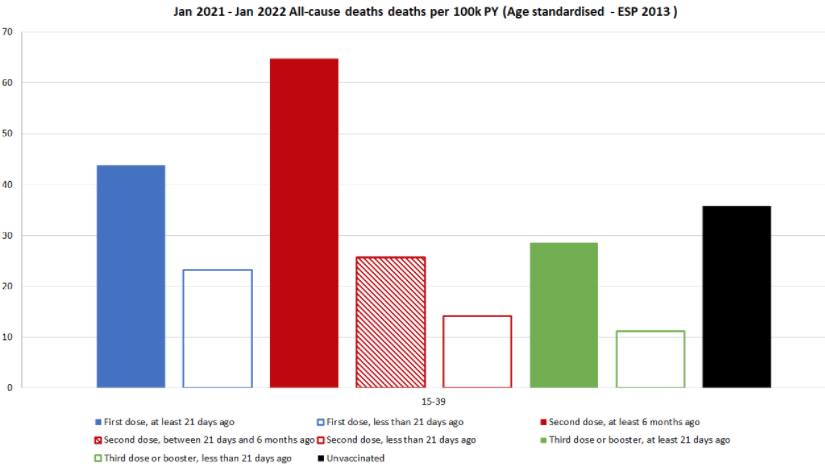
The advantage of 'All-cause mortality' is that there can be no misunderstandings about whether or not Covid is Covid, by/with Covid. In any case, the vaccinated group must ALWAYS show a lower mortality than the unvaccinated group. Otherwise, it's better not to vaccinate, it's as simple as that.
All-cause mortality: the TOTAL mortality among 15-39 year olds
The black bar stands for the number of deaths (proportionally) among the unvaccinated. In this age group 15-39, there is normally little mortality. So a small change immediately stands out.
What strikes me about this:
- The white bars with colored borders represent the number of deaths WITHIN 21 days.
- The solid colored bars (blue, red, green) are the highest. These bars represent the LONGEST term.
- (The red shaded bar: between 21 days and 6 months)
- So most deaths do not occur at all within two or three weeks. On the contrary.
No wonder the vaccine seems safe and effective, if you only look within that time limit.
Towards the older age groups (60+), the balance will be less and less unfavourable for vaccinations.
In the light of all the above, if you look again at the travel advertisement of @MinVWS, you can only conclude that we are being slighted by a body of malicious oligrophens. Look it up, if I word it differently it will look too much like swearing. It is crying to heaven.

[ Below is an edit of a previously used box that I have already used in previous less viewed articles]
Benefits outweigh the risks: wet finger work
The corona crisis has painfully exposed that there is no clear criterion for effectiveness versus side effects of a vaccination campaign. People are just messing around in the healthcare sector, that will be typical of the industry. The usual criteria (such as NNTV, Number needed to vaccinate) are not applied to corona and Covid-19 vaccines for some reason. Epidemic manuals are pushed aside when doctors smell power. Cost considerations don't count either, it may all cost billions with unlimited costs per year of life saved.
FDA and EMA always insist that "the benefits outweigh the risks" and that is also the case with two vaccine deaths for every three covid lives saved – at least if you don't look at something like years of life lost, or if you include the age discrimination of the disease itself. Not to mention the ethical question of whether you can make two random human sacrifices to save three vulnerable people.
To explain QALYs and age stratification, a critic has to do the math. You quickly get that with rational processes that go a little further than responding to moral indignation. So in a talk show you can survive that, watching with an affable smile as someone bends over backwards to calculate the counter-argument. Despairing. One moral argument ('every life counts' or 'the disease is really bad' or 'come and have a look at us in the ICU') and the danger is refuted. After all, the people don't understand it anyway, they just trust the doctor and are afraid that they might otherwise be that one life themselves. Those in power did not make the mistake of coming up with scientific arguments in black and white – then they would not have been left unscathed. No, a talk show is the appropriate medium, after all, you don't get any further than sound bites and that is ideal in this case.

That "outweighing the risks" can be reasonable for a terminal patient where you want to go very far. However, it is a nonsensical requirement for a vaccine, the intention of which is that everyone gets it, including the 98.5% healthy and (at the time) hardly affected people including toddlers, children, teenagers etc. etc.
Normally, mass vaccination campaigns are already stopped when there are a handful of suspicious deaths or serious side effects. If you are going to inject healthy, not particularly vulnerable people (which is the intention of a vaccine), then as far as I'm concerned, there should be no side effects whatsoever. Only with "if it doesn't help, it doesn't hurt" would I accept vaccination of children. And if it seems to go wrong with one in a million, OK, then you can wonder if that person was 'healthy' or that something crazy happened. If something happens at 0.1%, it is a completely different story, especially in relation to the risk of disease. Somewhere in between, it must be possible to draw a line. It is a pity that that limit is now only determined with the wet finger. The same wetted fingers that then also come in handy to count banknotes.
What is an acceptable ratio for vaccine mortality:disease mortality? 1:10 ? 1:1.000? 1: 100.000 ? With the current figures, you hardly come close because almost no one dies within certain well-defined age/population groups. Not to mention the absurd idea that mass vaccination makes sense in the face of a respiratory, rapidly mutating virus. Especially with moderately and very short-term protective vaccines that do not provide immunity anyway.
I remember very well how – for example – Softenon, DES and Prozac were also deemed '100% safe'.
Yes, after two weeks it seemed to be the case. After two years too.
After about ten years, the case turned out to be slightly different.
So it is not only very stupid to think that you can draw the same conclusion – 'nothing happens two weeks after vaccination, so it is safe' – with these vaccines, but actually just criminal.
Nice article, that the vaccine for people with the delta has helped not to get into the hospital could well be.
What I really interesting is of all the hospitalizations or death cases, knowing what percentage was vaccinated and what was not. That way you can rule out (or not) whether vaccines pose an additional health risk. This seems relevant to me especially for the younger age groups.
What I miss a bit in this article is the total number of people who have been vaccinated.
On this link:
https://www.bbc.com/news/health-55274833
for example, I see that about 35% under 18 have NOT had a vaccine.
Of the approximately 153 people who died, 13 were not vaccinated, which is 8 to 9%
So as vaccinated young people you had a 3 to 4 times as chance of dying.
Yes, there is always more that is missing in such an article than what is in it. And I often think they are too long myself.
About your sum: if 65% of young people have been vaccinated and 91% of the deceased from that group have been vaccinated, how do you come up with a chance of 3 to 4 times as high? Shouldn't that be 'almost half higher'?
Hi Anton,
I looked wrong, the number of deaths has already been converted to x per 100,000, so it doesn't matter how big those groups were.
If you then look at the 0-15 group, all vaccinated people together have (14+9+65+20+1+25) / 7 = an average of 20 per 100,000 and the unvaccinated 11, so the vaccine seems disadvantageous there.
At the 20-24 it is more or less equal. In some other groups, unvaccinated people are more likely to die at the moment. e.g. for 40-44(140+50+190+80+50+70+30) 87 per 100,000 for vaccinated people against 100 per 1000 for the unvaccinated.
The problem with these graphs is that as of 1-1-2021, almost no one had been vaccinated, everyone who died then was unvaccinated. Interesting to have these graphs from the last 3 months.
So for the lowest age group this applies even more.
Keep up the good work!
"100 per 1000 in the unvaccinated"....? You mean per 100,000 I think.
Why do you divide the added deaths for the groups of vaccinated people? If it is a proportion per 100,000, these numbers may still be added up to arrive at the total number of vaccinated deaths in relation to the number of unvaccinated people.
Moreover, counting is done from the start of the year where no vaccinations have yet taken place. The deaths in that period should be subtracted from the number of unvaccinated deaths.
As I read it, it is calculated in patient years (PY). Well, I'm not statistically well-versed, so correct me if I am wrong. But it seems that corrections have already been made for the weeks in which someone was not vaccinated?
The article states:
> In any case, the vaccinated group must ALWAYS show a lower mortality rate than the unvaccinated group. Otherwise, it's better not to vaccinate, it's as simple as that.
This seems logical and simple, but you miss an important point, namely that this ONLY applies if the groups are balanced. If the vaccinated group has a bias that there are people with a much higher mortality rate, which is certainly not inconceivable with these low numbers, your reasoning is undermined.
Absolutely... Perhaps I should put it another way: the year with vaccination should have a lower all-cause mortality than the year without – provided that no other strange things occur, of course.
You can't just add up all the deaths of the different groups, I realize now. Suppose you were vaccinated in March. then you are up to 3 weeks after that "vaccinated within 3 weeks" and then for the x months of the year "vaccinated more than 3 weeks". Then you take a second vaccine after 3 months and then you belong to another group again. So the groups are not the same size. From the whole year you are then unvaccinated until March, from March 1 to March 21 within 3 weeks of vaccine 1, from March 21 to July 21 outside 3 weeks of vaccine 1 etc.
And indeed, the time span of this research is unfortunately one year.
And then the fair question, are the groups the same. Very weak people have not been vaccinated anymore because they already had one foot out of it. Have people who have not been vaccinated massively taken vitamin D and Zinc, etc.
Indeed, you can't compare that well. However, the greatest number pollution is caused by the fact that the uninjected in hospitals are often so seriously ill and or take certain medicines that they are not allowed to be vaccinated. Even worse is that the homes are not included in the calculation of the effectiveness. There, the vaccination rate and mortality are much higher and they are admitted to hospitals much less and even less to ICU.