Striking: on the other side of the globe they are with exactly the same question marks as here. How does it exist?
In the Netherlands, in 2021, we saw excess mortality continue in the summer months, which has never happened before. There was no Covid at the time, the tests showed. Covid deaths were hardly there. Mortality is higher in 2021 than in 2020, the year we were unprotected against the more severe Alfa variant.
CBS doet zijn best om de oversterfte als "Hidden Covid" weg te werken en de doodsoorzaken die de grootste sterftestijging veroorzaken zijn statistisch toegedekt in de categorie "overige oorzaken".
Parallels with the Netherlands
In Australië signaleert Jessica Henderson, een 'concerned Australian citizen' te gast bij Dr. John Campbell, een sterfte die niet toe te wijzen is aan Covid. De situatie daar is misschien nog overtuigender dan hier wat betreft "onverklaarde sterfte". Australië heeft namelijk nagenoeg géén Covid-sterfte gekend. Het eenvoudigweg toewijzen aan "Hidden Covid Deaths" is hier al niet acceptabel maar in Australië al helemaal niet, kijkend naar het verloop van de ziekte, positiefpercentages en vergelijkingen met 2020. In een periode waarin 9 bevestigde coviddoden werden geteld, is een onverklaarde oversterfte van 3.000 (haar schatting - naar mijn idee wel te hoog) niet zomaar op het Conto van Covid te schrijven.
Here the video with her presentation, below her graphs with Dutch summary for those who prefer to read.
Where Jessica has a point, in my opinion, is in the comparison between 2020 and 2021. How can 2021 have a substantially higher mortality rate than 2020 under similar circumstances? I find the comparison with the average of previous years less strong. That is not a good way of calculating expected mortality. I will come back to that at the end of this article.
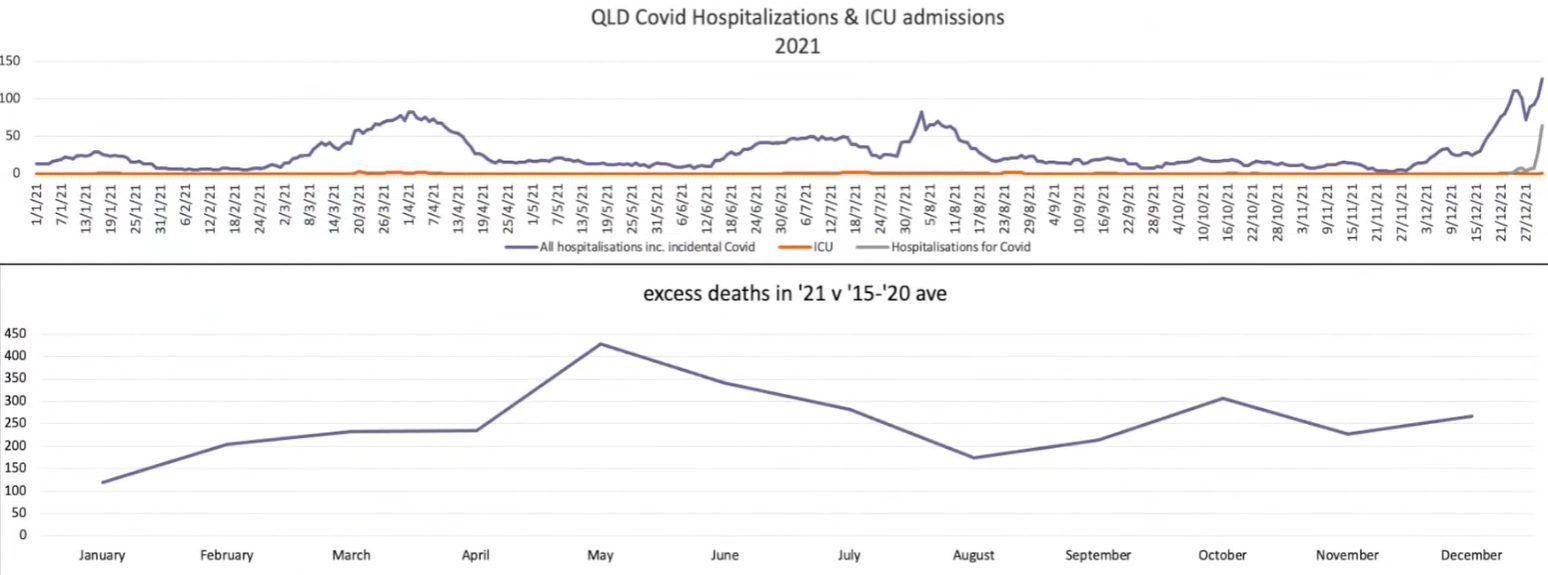
Chart 1
The excess mortality in the summer months of January/February 2021 was 5.3% higher than the average in January/February 2015-2020, which represents an increase of 6,906 deaths, jessica says. All excess mortality was in 65+. The grey bars in Graph 1 represent 2021.
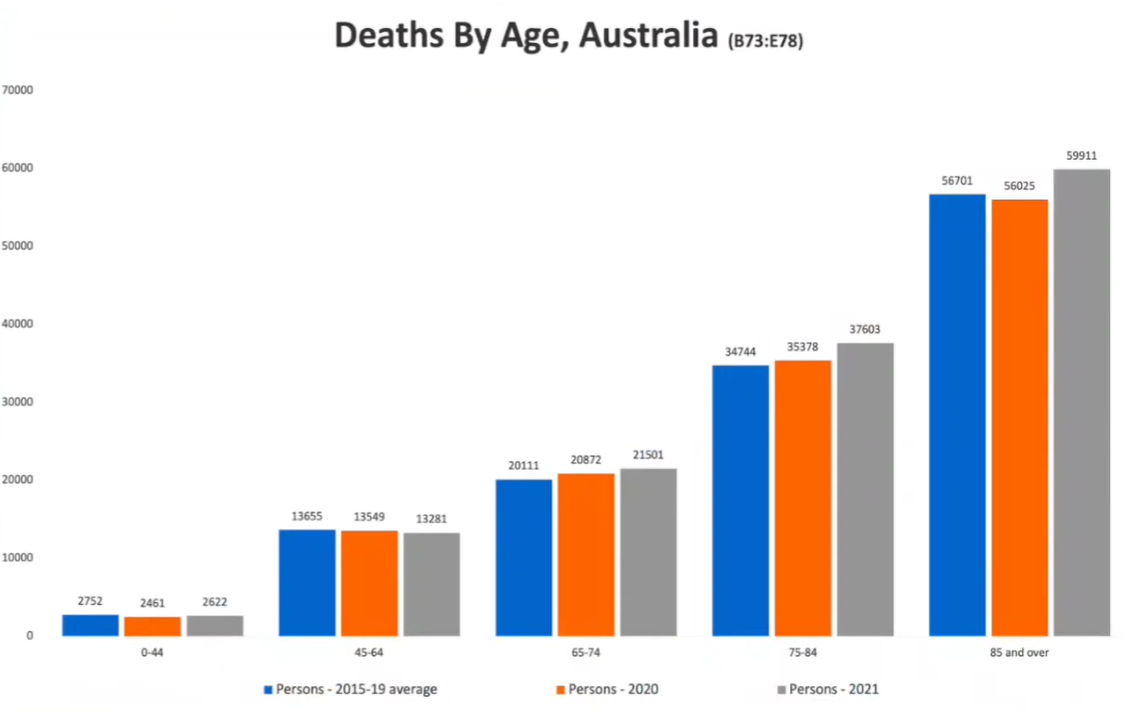
Chart 1
Chart 2
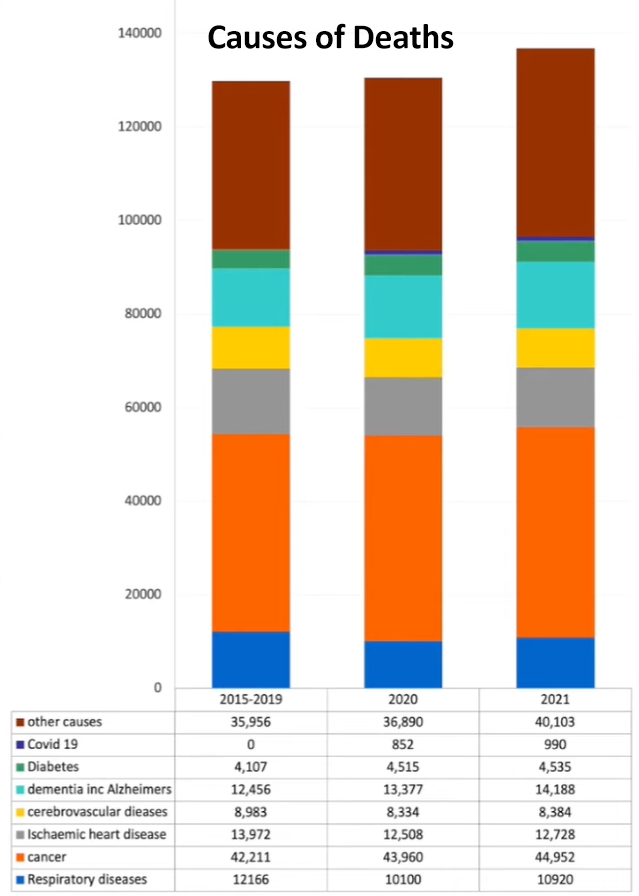
The pattern of causes of death also shows great similarities with that in the Netherlands. Respiratory diseases fell slightly as a cause of death in the Covid 20s and 21s.
Het bovenste bruine gedeelte van de staaf is "overige oorzaken". Met 11% boven het gemiddelde is dat de belangrijkste aanjager van de stijging (net als in de NL statistieken van CBS).
The thin blue line below that is Covid mortality in Australia: a total of 990 people in 2021, which is more than 15% more Covid mortality than in the first unvaccinated Covid year 2020.
Graph 2
Chart 3
Australia had no major waves except omicron in December. A zero-covid policy and strict border security kept the population free of an epidemic.
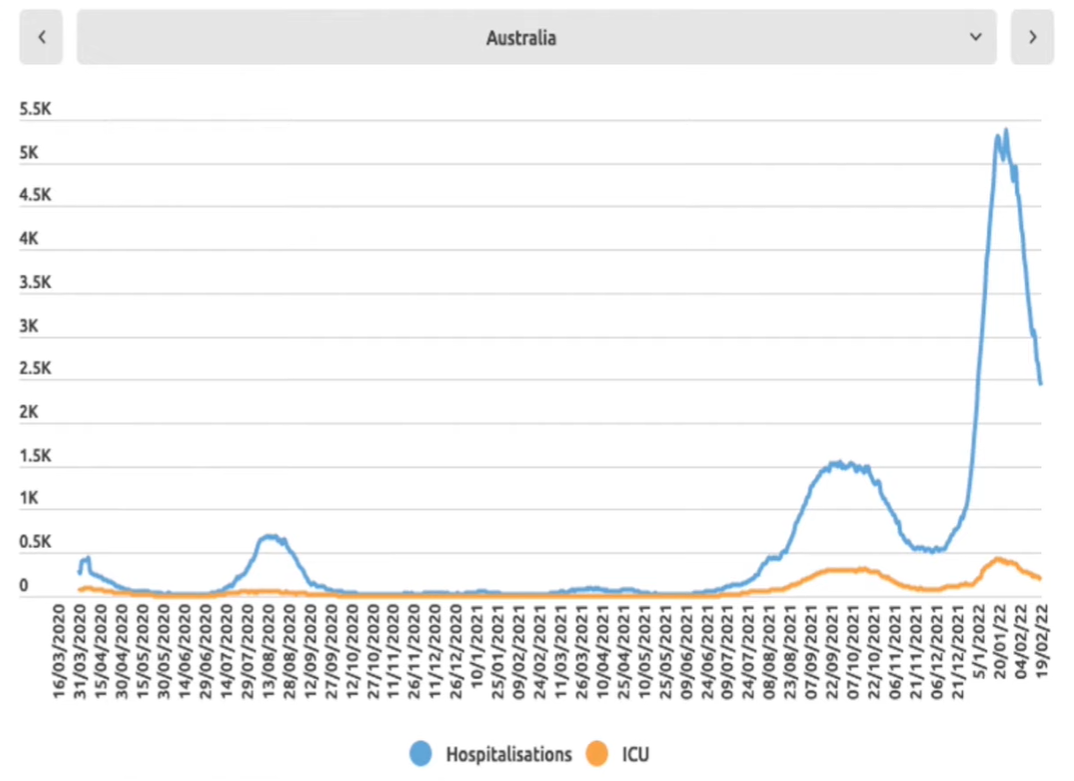
Chart 3
Chart 4
2020, the red line, was a lockdown year for Australia with no vaccinations and with little Covid.
The blue line, 2021, is characterized as the vaccination year, starting with the vaccination of the elderly and vulnerable. There was no flu season. After a year of under-mortality (the red line), a year of higher mortality is not surprising in itself.
But without flu or Covid season, it is still remarkable: the higher mortality is structural from March April, not only in a flu peak.
[The red line shows that mortality was lower than the 2015-2019 average, but again: an average is a poor reference.]
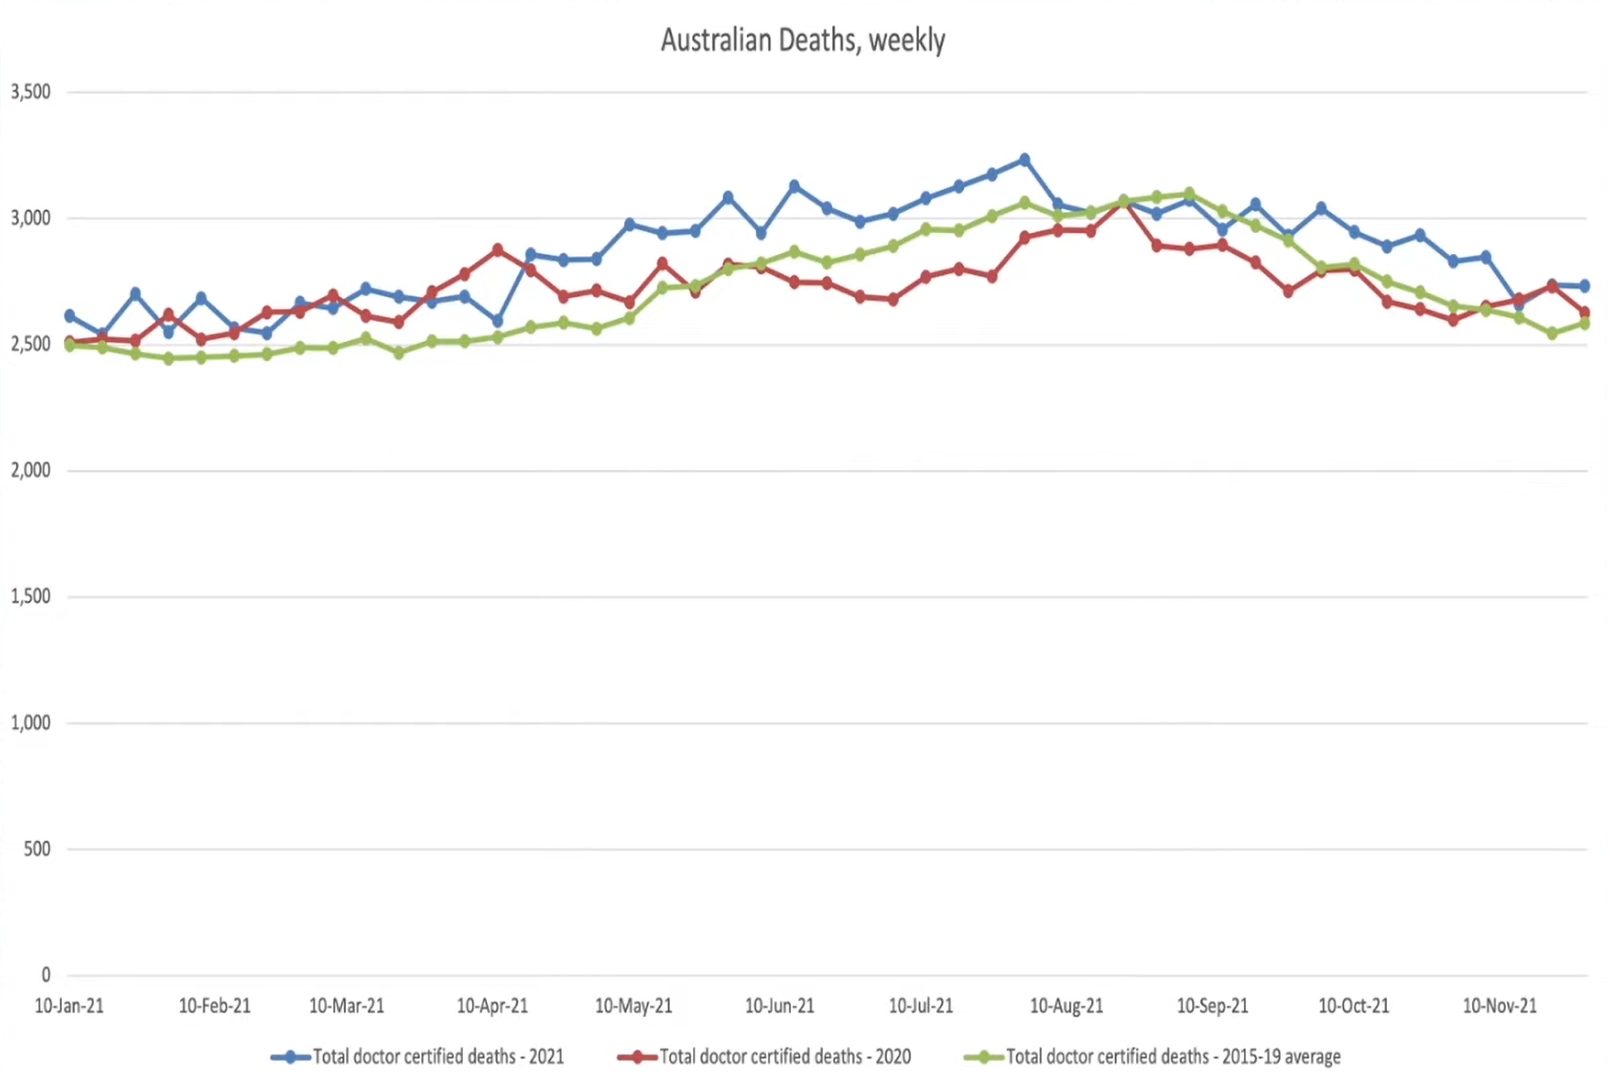
Chart 4
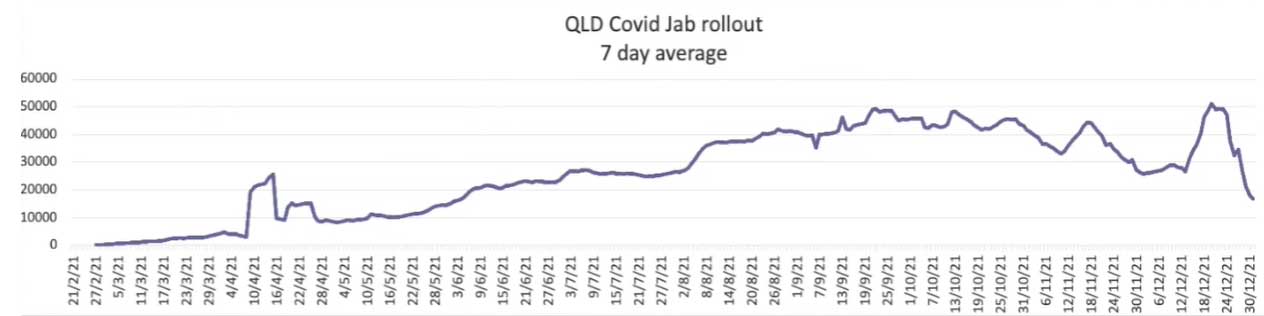
Chart 5
The Vaccination Campaign began in February and reached the maximum number of jabs per day in August. In October, that dropped back again.
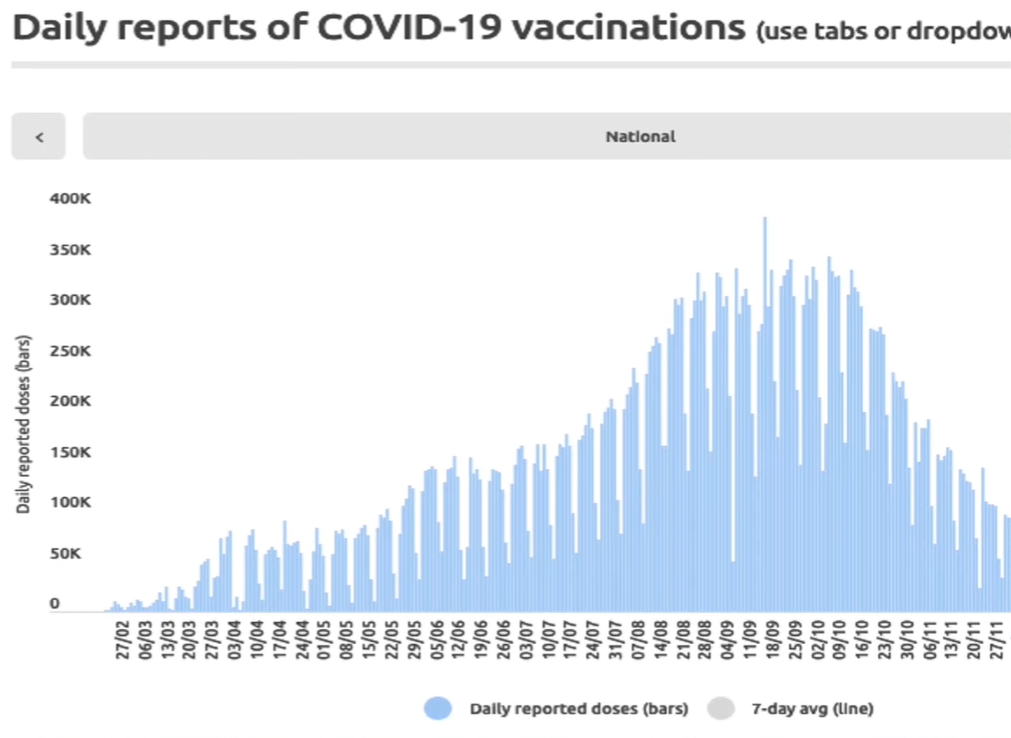
Chart 5
Chart 6
In Queensland, Jessica again compares 2021 with the average of the previous 5 years. It then comes to an excess mortality of 3,000 people. There were a total of 7 (seven) covid deaths in Queensland.
[Now, in previous years, an upward trend can be seen so the difference would have been much smaller if she had calculated the trend instead of the average.]
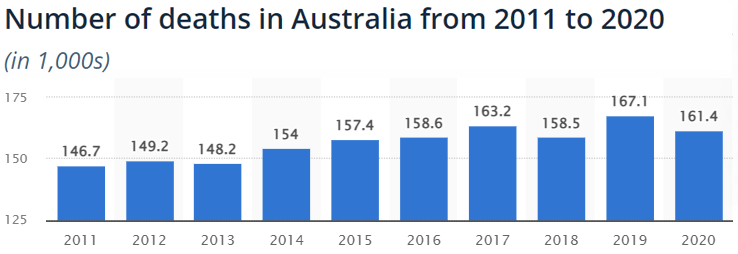
In addition, the years alternate neatly in terms of higher and lower mortality. After a year with a bit more mortality, a year with a little less mortality follows. The odd years go up quite steadily, as do the even years. In this sense, neither 2020 nor 2021 is an exceptional year in terms of excess mortality.
Nevertheless, 2021 continues to show the highest mortality ever, even in the absence of a flu season and above all: significantly higher than 2020, the covid year without vaccination. This raises questions.
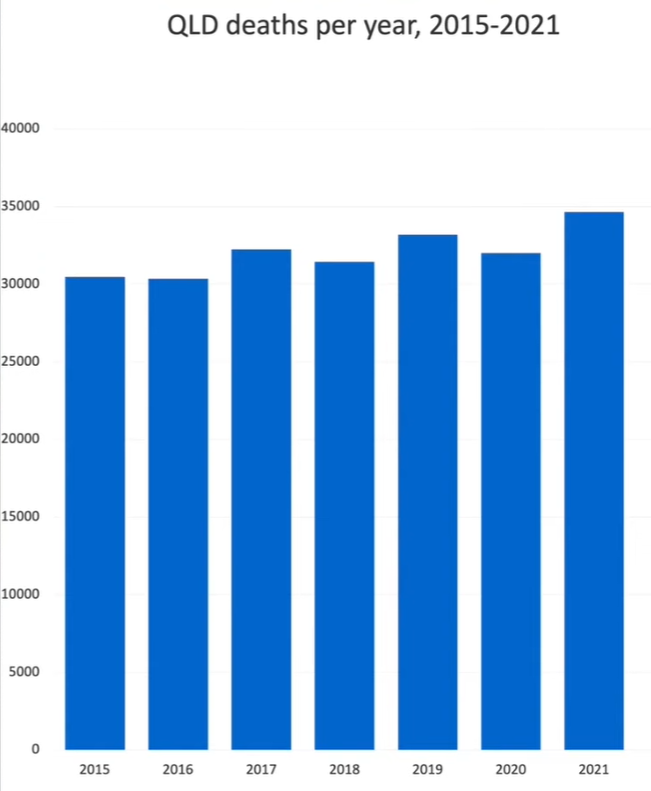
Chart 7
August and September are the months where the regular flu season played out with clear mortality peaks, especially in the odd-numbered years.
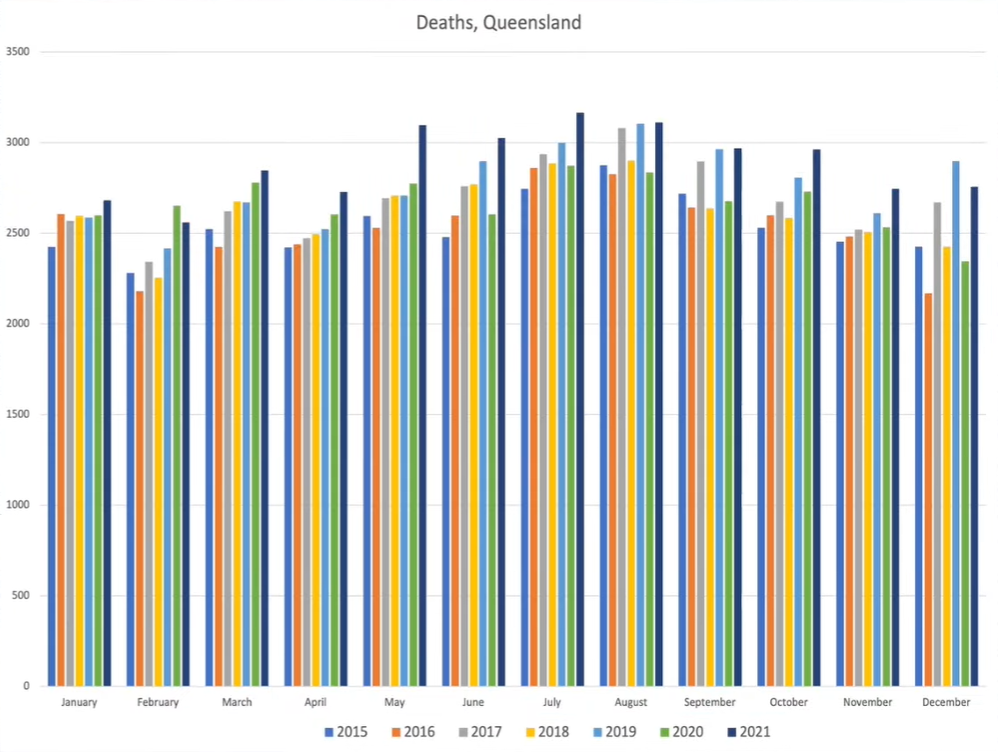
Chart 5
There seems to be no link between the (moderate) Covid waves and the excess mortality.
Tot slot toont Jessica de grafiek van de vaccinatiecampagne en vraagt zich af of er misschien daarmee een verband is te leggen. "The people have the right to know".
What about this?
The confused communication, the inconsistent data handling and the secret health information from the government with many demonstrable inaccuracies worries citizens. The lack of underlying data easily leads to wrong hypotheses.
Dr. John Campbell herkent zijn eigen vraagtekens en vindt alles "very very interesting" terwijl er wel wat meer over te zeggen valt. Hij had Jessica bijvoorbeeld gerust kunnen stellen over het onrustbarende 'gemiddelde' dat zij op verschillende manieren heeft gebruikt.
The 'average' as an incorrect reference
Given the population structure, it is not surprising that the mortality rate is slightly higher every year. You can clearly see the rising trend in these blue bars. An upward trend automatically means that the last year is higher than the average of the previous years. 2020 was remarkably low, probably partly due to the lack of superspread events as a by-product of lockdowns and other measures.
Jessica hoeft zich dus niet zozeer zorgen te maken over de "excessive deaths" in Australië op basis van een gemiddelde. Oversterfte is immers sterk afhankelijk van de berekening van de "verwachte sterfte" en die kan op allerlei manieren plaatsvinden. Wil je daar meer over lezen, zie de links in an older article on this topic. There you also see that the population structure can make an average unsuitable to work with.
But 2021 more mortality than 2020: how is that possible?
Wel blijft het probleem overeind dat 2021 ook in Australië een aanzienlijk hogere sterfte heeft gehad dan vaccinatieloos covidjaar 2020. Met als onderliggend gegeven dat noch de overheid noch de farmaceuten informatie willen vrijgeven waarin die antwoorden mogelijk besloten liggen. De trial-documenten komen stukje bij beetje vrij maar de statistieken zijn er nog steeds niet: leeftijdsgestratificeerde doodsoorzaken en -datums met vaccinatiedatums. Wereldwijd richten steeds meer analisten hun vizier op de vaccinaties in combinatie met de hoge "All-Cause Mortality".
Not only analysts and scientists are crying out for data, as we also read in the editorial of Peter Doshi in the British Medical Journal. ("We need raw data, now").
Russell Brand also covers that BMJ article, in his characteristically refreshing and occasionally hilarious way. He wonders how the Wappie bashers feel now that terms such as 'immoral' and 'unethical' are also used in the respected British Medical Journal when it comes to the dates and trials of the vaccinations.
- Do you wanna buy a car?
- Could I have look at it?
- No
- No? Why not?
- What are you, a conspiracy theorist!?
- I'd just like a look at the car before I buy
- You can't look at that car! What are you, a pervert, a right-wing conspiracy...
- OK, I won't look at the car, just a look around it, see if it works or not...
- No you can't, it's private! You can have a look in 75 years otherwise you're a conspiracy theorist! What are you, an anti-carrer? Where's your tin hat!?
Corona may be done with us, but we are far from finished with how the corona fight has been shaped. How do we bring that to the surface? Motions are ignored or distorted, WOB requests sabotaged or delayed. In a parliamentary inquiry, parliament should expose its own dysfunctions. The composition of a special committee of inquiry will determine how damning or praising the verdict of the course of events is. A tribunal sounds so heavy again, but it seems to be the appropriate instrument for an issue that is international, very large-scale, ad hoc and circles around a specific problem.