
Christmas is a time of reflection. A new year, new perspectives. I took another critical look at my data. This provides a new insight into the correlation between vaccinations and unexplained excess mortality. As an aside: rivm has also been busy because in the rivm data last week more than 100 unexplained deaths of week 50 disappeared. The rod of week 50 has thus become considerably lower. With previous rods, something has been added, we assume that this cancels each other out. See the graphs below. Unfortunately, week 51 has not yet been reported.

rivm-opgave 26 December: 616 unexplained deaths in week 50

rivm-opgave 2 January: 513 unexplained deaths in week 50
Stronger correlation between vaccination and unexplained excess mortality
Very briefly: we identified an optical link between the number of fully vaccinated and unexplained excess mortality (excess mortality excluding covid). This resulted, among other things, in the graphs below. (note: they have two Y-axes).
A cup of coffee with Ronald Meester led to a statistical ('bayesian') confirmation that it was not an optical illusion. I did have some questions about the study but he is busy. We all add corona, of course. In any case, he has made the point of mortality increase within three weeks of vaccination. I'll incorporate my thoughts on the research into a future post.
Criticism and optimization
Click on the small graphs to enlarge them.
What didn't sit well with me before was that the increase in the first graph at the bars is different than in the orange line. The cumulative blue bars increase quite linearly between weeks 21 and 32, in a straight line diagonally upwards. In the cumulative orange line, on the other hand, there is not really a straight line to be discovered.

It becomes clearer in the second graph, the one with the two lines. There is a blue plateau that is missing in the orange line. The weekly increase in the number of vaccinated is at a higher level for a number of weeks (from week 21 to week 32). You should see something of that. Unfortunately, there is a clear peak in the deaths, which fortunately seems to be over – unless the last few weeks are added in an unlikely way. I don't assume that.

Not vaccinated but number of jabs!
Thinking about what the boosters could mean, it became clear that we have to look at the effect per injection. So not to the number of vaccinated! There was a first jab, at least three weeks later a second jab – maybe that caused the plateau which later became a peak? After consultation with the Eucalyptic Society they immediately enthusiastically faxed the new data to their Working Group graphic interpretations and we received the new graphs back immediately.
Based on the number of per day, so regardless of whether it was prick 1 or 2, the graphs do indeed look different (move the mouse over the line graph for an impression of the similarity):

The sloping curves are more comparable

The course with a peak is more similar (hover over the graph)
Only autopsies (autopsies, pathological examinations) can show that the vaccinations are not causally related to the excess mortality – or rather they are. Also, release of age-stratified causes of death with vaccination status may most likely demonstrate this. However, VWS, CBS and rivm behave like the little boy who jealously puts an arm around his test for fear that someone will cheat on him. The data remains protected and not publicly accessible, not even for scientific research.
This is an unacceptable, unscientific, reprehensible and suspicious state of affairs, I cannot stress that enough.
It is also a democratic thing: the data are collected with our tax money, but we are not allowed to see it and the House of Representatives is not allowed to check it.
A booster effect – but how?
With the boosters it can go in three directions in terms of mortality. Of course all reasoning within the hypothesis that the vaccinations are a dominant explanation for the unexplained excess mortality. (It really is a hypothesis!)
- We see proportional mortality
- There is a cumulative effect
- There is an under-mortality effect
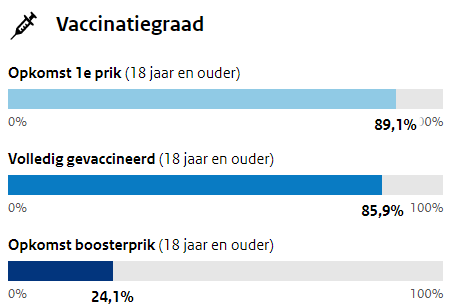
First of all, remember that (dd 2 Jan) 65% percent of the fully vaccinated still kindly thanked for the booster shot. (24.1 out of 85.9 is approx. 35%) The booster campaign is still running, but the most important groups have already had their turn. The remaining 35%, although boosted, will be much less visible in vaccination effects on total mortality. This also applies to the impending significant reduction in covid mortality: that is more due to omikron than to the boosters. There are simply too few of them.
- An effect of 35% compared to a previous injection round is plausible. The first two injection rounds fell more or less simultaneously, so it would only be 17.5% of the unexplained excess mortality we observed, assuming a 1:1 relationship per injection. Think of a total of 1,500 people over a period of many weeks. This becomes difficult to distinguish in total mortality and is easy to attribute - mistakenly - to other causes.
- If, on the other hand, there is a cumulative effect, each subsequent jab becomes more effective. This could also apply to mortality: after all, there are even more lymphocytes in places where they do not belong. Higher thresholds are exceeded. The mortality could then even be higher than that 17.5%. This is apart from the real long-term effects that we do not yet know.
- Under-mortality effect: people who were sensitive to these have already largely died after the first two injections. Then the third injection will cause few deaths anymore. However, there is still no aspiration when vaccinating. It seems that at the do not aspire with this vaccine about 1 in 3,000 (estimated) injections is a possible lethal poison syringe. In that case, however, it is about short-term effects. In the graphs we see that it really takes a lot longer. There seems to be something else going on – or the non-aspiration also has a long-term effect. Despite the fact that there are also many cases of almost immediate side effects.
With regard to debunking various alternative hypotheses for excess mortality, I refer to previous posts in which it is substantiated that the mortality peak is either inconsistent with long-term effects of chaos, disruption or delayed care, or that statements cannot numerically substantiate that they could result in such a mortality in such a relatively short period of time.
Note on excess mortality
In response to a number of letters sent in: I am aware that the wave movement in the expected CBS mortality already takes seasonal effects into account. Presumably, this is where even the rivm statement comes from: "the seasonal effect is about 30%".

Exploratory: That 30% might go somewhat for endemic viruses, although we still have a flu excess mortality of 6,500 people every year – despite the 'pricing'. In the case of a dormant virus to which a large part of the population has no resistance yet, that 30% is an amazing simplification and underestimation of reality. Under the right weather conditions, such a virus can in a comprehensible population exploding towards winter.
In any case: flu mortality is therefore already 'priced in' in the expected mortality, given the wave movement. The observed unexplained excess mortality is therefore on top of that (while there is no flu). This could be a reason for recalculation, but then there must first be discussions about what is a real excess mortality calculation. It would also mean that the calculation of unexplained excess mortality increases considerably. After all, the part that was reserved for flu has not been explained either, for the simple reason that the mortality was also there without flu.
There is still much to discover. Similar analyses per age group are now also being looked at, again handicapped by the fact that we have to work with derived data. These are exciting times. Perhaps things will improve if scientist Robbert Dijkgraaf can address his cabinet members. It remains to be seen how this beta man holds up in The Hague's alpha hell. Anyway:
For heaven's sake, don't get your kids vaccinated. Not even 'for someone else'. No one gains anything and they can only lose themselves.
= = = B R E A K I N G ( F A K E ? ) N E W S = = =
Life insurer in Indiana: +40% mortality – Fake or...?
On December 30, 2020, Indiana's executives begged the unvaccinated to get pricked because of rising hospitalizations: https://finance.yahoo.com/news/covid-cases-spike-hospitals-businesses-180247578.html So there is apparently something going on in the hospitals there. But then what? Covid...?
Two days later, on January 1, the message below seems to go viral. I say "seems" because it is striking that the websites with rather tendentious names all use exactly the same text with an almost identical heading. A fake news spreader would do it exactly like that with fast copy/paste scripts. Common sense says that it is almost impossible that a 40% increase has gone unnoticed so far...? Moreover, it would not be Covid mortality. As much as this may seem to be in the virus variant excess mortality stall – there are not even any references in the article. First the numbers!
For the curious, this is the link: Indiana life insurance CEO says deaths are up 40% among people ages 18-64 | Indiana | thecentersquare.com (archive.is)
“At the same press conference where Davison spoke, Brian Tabor, the president of the Indiana Hospital Association, said hospitals across the state are flooded with patients "with many different conditions," saying, "Unfortunately, Hoosiers' average health has deteriorated during the pandemic."
In a follow-up conversation, he said he didn't have a breakdown showing why so many people in the state are hospitalized — for what conditions or ailments. But he said the extraordinarily high death rate cited by Davison was consistent with what hospitals in the state are seeing."
On Yahoo News, however, that same Tabor says this, on January 1st:
"We are struggling with capacity because of the high number of cases, and only the impact of COVID, and the general health care needs of Hoosiers," Tabor said at a virtual statewide press conference. Now that the omicron variant is spreading, hospital and business leaders are urgently pleading with unvaccinated Hoosiers to get vaccinated.
https://news.yahoo.com/come-count-them-indiana-hospital-213652917.html
Omicron spreading...? Doesn't that mean fewer admissions and deaths? These are indeed turbulent times. I feel from my water that this news is not true – but yes, I have to wait and see. Don't be too quick to believe what you're reading. Robert Malone goes along with this a bit faster than me, although he keeps a stroke on the arm. “IF this is true..."
[edit: now a video of the CEO confirming the story.: https://twitter.com/Mr_Mackei/status/1478008259474862081 ]