
Half of the Netherlands is triggered when people talk about excess mortality. One person cites Covid as the main cause, while another claims that the corona mortality has been overestimated and that there must be other causes. No one doubts the 'hard' CBS figures on excess mortality. Both proponents and opponents of the corona policy attach great importance to these figures. The CBS expectation is accepted as an established fact. Wanting to start a discussion about this is a hopeless operation and in order to communicate with each other you simply have to accept the same definitions. At a minimum, we must be able to address CBS on the implications of its own figures, regardless of whether there is anything to criticize about those figures themselves.
Recalibration
But still, how hard is this data? Two years ago, we pointed out virus varia to analyses of, among other things,Bo van der Rhee on LinkedInand aarticle by Els Ooms. So many people, so many tastes. Exactly how CBS does it is described, but it is not easy to recalculate. With different approaches, you can go in all directions. But now that the figures show a certain development, we will have to scratch our heads. Is it all still true? Now that we see that scientists abroad also calculate their own baselines Prof. Kuhbandner in Germany we make a contribution to the Dutch bag.
On Twitter, Bonne Clock Already in March 2023 working on an idea that is as obvious as it is plausible. These are often the ideas that are overlooked. Virusvaria invited Bonne to make a longer story. Eventually, a few versions later, this is the result.
Excess mortality or excess mortality results from the expectations from CBS. Which years these are and how that number will be corrected is not entirely clear. From 2 October 2020, CBS will use a long-term average as a basis for the expected number of deaths, but also writes that it will assume 2015-2019 (1).
Is the expected mortality well estimated?
A mortality expectation that is too low will result in higher excess mortality and vice versa: if you estimate the mortality high for the same year, the excess mortality may disappear and even turn into under-mortality. An estimate based on the 5 previous years always gave a fairly accurate direction in relation to the actual mortality. CBS therefore applied this rule. For an estimate of the year 2023, you should take the dates of 2018-2022.
Now the years 2020-2022 have the unprecedented increase in mortality and therefore the 5-year trend is no longer a good benchmark, if only on the basis of common sense. That is why we are looking back to the years 2015-2019. We are now in the year 2023! And yet we still base ourselves on data from the year 2015, which is already 8 years ago. How representative are these figures from 2015, and do we not miss other trends if we just skip years?
Normally, a year with significant excess or under-mortality will be averaged out by the years that follow. Suppose that 2019 had under-mortality, this would be corrected by the year 2020 (under-mortality years are usually followed by excess-mortality years). Suppose the 2015-2019 trend generates an incorrect prediction for 2020, resulting in 2% too few deaths being predicted. If one then continues to stick to the 2015-2019 trend and does not correct for 2016-2020, this trend will give a margin of error of 4% in 2021, for 2022 this will give a 6% error and in 2023 this will increase to 8% error. With this incorrect estimate, there will be standard (significant) excess mortality in 2023 without anything actually happening, because the trend was not properly estimated/calculated.
If we take the cbs data into account, we see that the period 2015-2019 started with (substantial) more mortality, and ended with a year of lower mortality.(2) This is the basis for the expected mortality of 2023.

In pandemic-free years, the trend of the past 5 years offers good guidance for the coming year. But by sticking to this rule as we enter the 4th year after the pandemic, we are missing out on current events. Does what is happening also fit into a longer trend or is the deviation from it easier to explain? As mentioned, the direction and steepness of the trend is completely dependent on what happened in those previous years. Excess mortality in the initial year and under-mortality in the last year will give a lower estimate for the following year. With the ultimate result: more mortality or excess mortality.
If we look at mortality from the 2010s to the present, we see a pattern: slow Rising mortality rates. Every year, slightly more people die than the year before. But the population is also growing. The picture remains if we calculate the mortality back to 100,000 people.
Theorem: The reference period for expected mortality starts with one year with excess mortality (2015) and ends with one year with lower mortality (2019). This creates an unjustified stable trend that results in higher mortality for 2020 and beyond.
In 2010, 819 out of every 100,000 Dutch people died. This number increased as the years progressed, reaching 890 per 100k in 2018, as seen in Table 1.
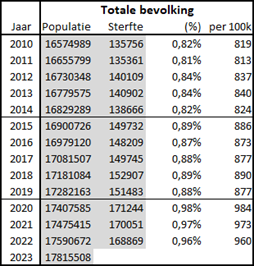
The last column from Table 1 (per 100K) is shown as cubes in Graph 2, together with the trend line of the pre-corona years 2010-2019.
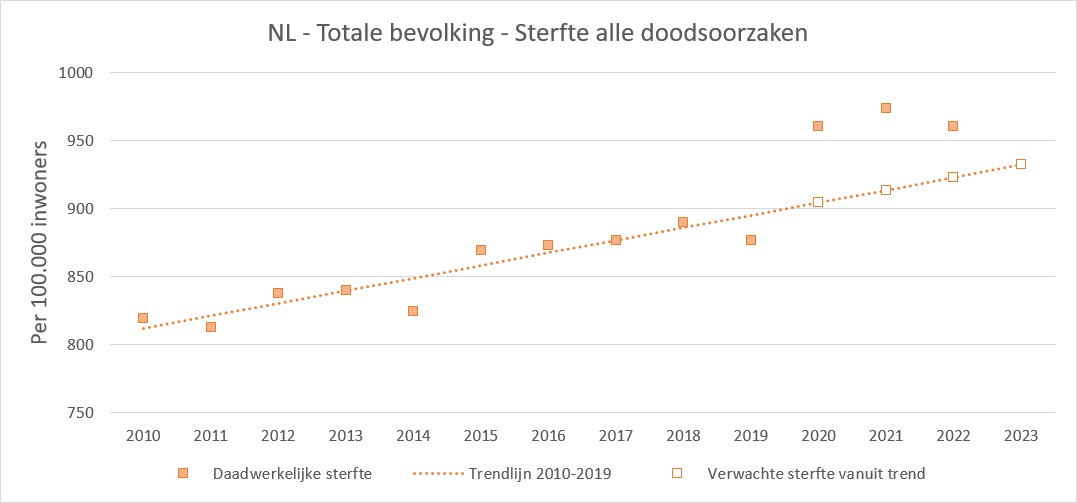
Clear outliers are the years 2014 (low) and 2019 (low). And of course the pandemic years 2020-2022 (high).
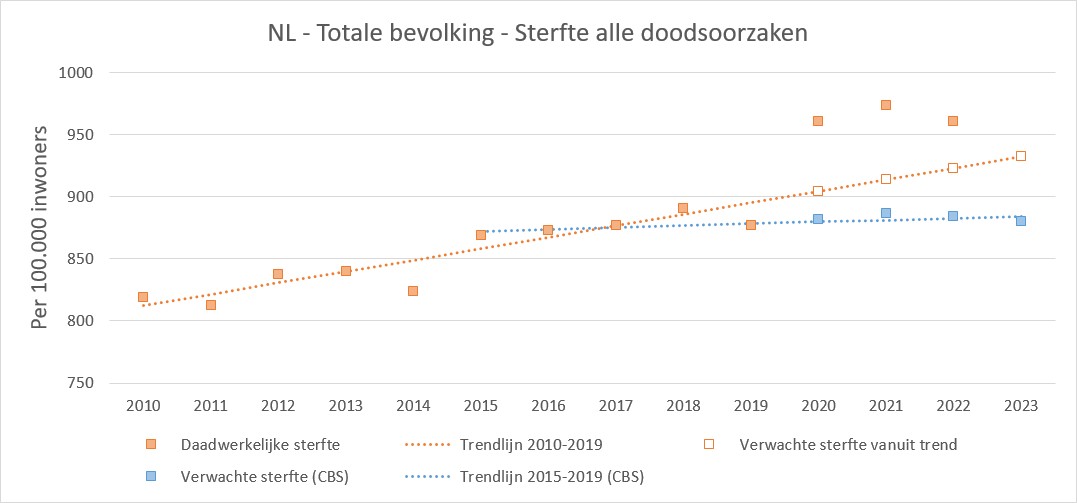
If we take the expected mortality(3) from Table 6 of CBS, the following picture emerges. Here it is clear that CBS bases its expectations entirely on the 2015-2019 trend, and does not look at the 10-year trend. And if we look at the expectations from 2021 to 2023, even a slightly declining trend. Based on this expectation methodology, the CBS excess mortality of '20, '21, and '22 can be explained well. The space between the blue cubes and orange cubes remains about the same, resulting in an excess mortality of about 14.5k per year. But I hear you say: constant mortality...? Surely it is corrected for ageing?
The difference in excess mortality is shown in the table below. Only on the basis of the chosen trend will there be a difference in excess mortality of almost 7400 deaths in 2022.
| Increased mortality based on | |||
| 5-year trend (CBS) | 10-year trend | difference | |
| 2020 | 14.577 | 13.410 | – 1.167 |
| 2021 | 15.161 | 9.928 | – 5.233 |
| 2022 | 13.373 | 5.980 | – 7.393 |
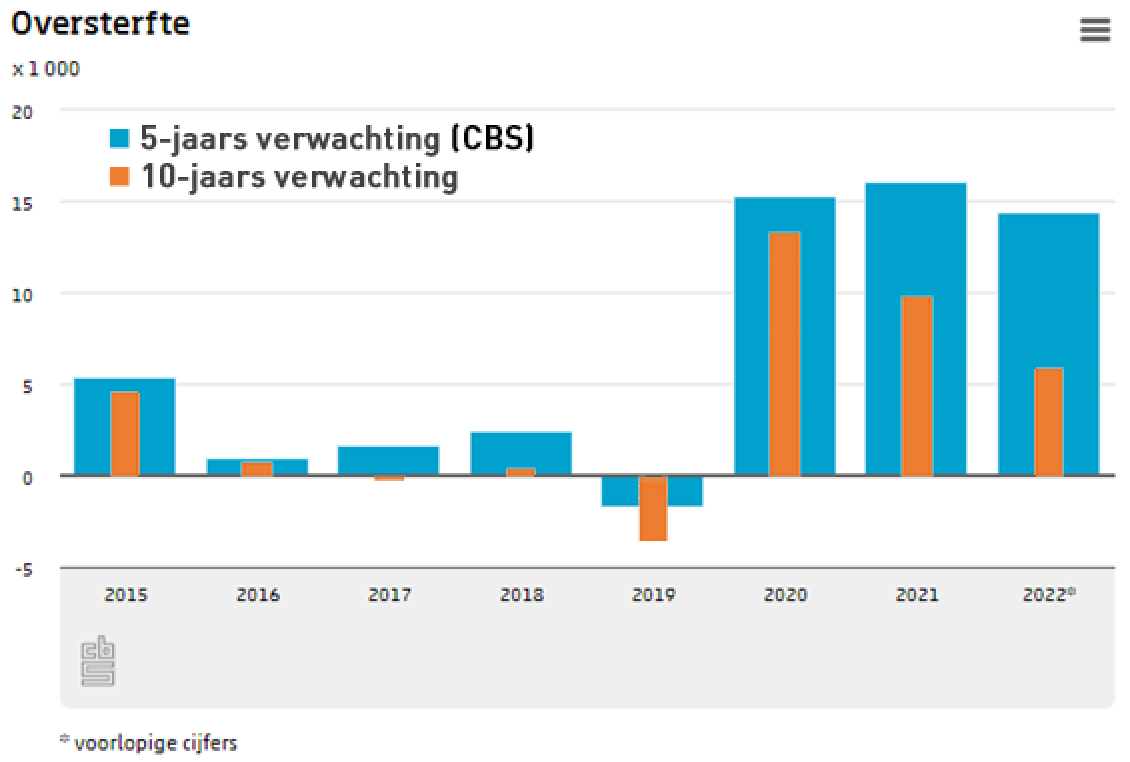
The 10-year forecast, projected in the well-known CBS chart (2010-2014 not shown):
What about by age group?
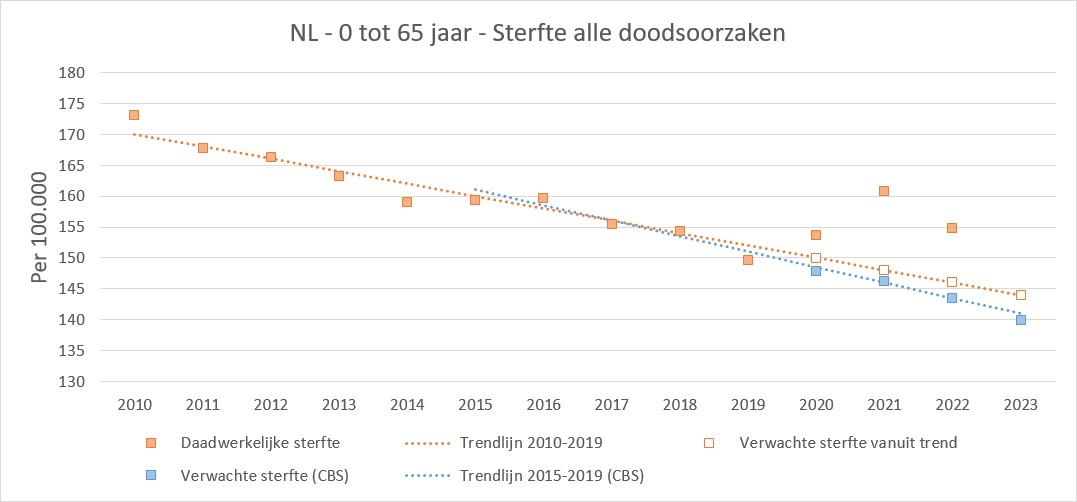
If we look at 0-65 year olds and 65-80 year olds, we see that CBS' expectation is reasonably in line with the 10-year trend. The blue and orange lines are almost the same. The expected mortality (orange squares) is close to both lines. Here too, it is clearly visible that the 5-year trend 2015-2019 is the most important parameter for the expected mortality.

But among the over-80s, we see a big deviation between the 5- and 10-year trend. Whereas mortality between 2010 and 2019 is around 11,000 per 100k or slightly rising, CBS expects a downward trend based on 2015-2019.
Statistics Netherlands claims that they are correcting for ageing. From this graph, this seems to be a negative correction: fewer deaths while the number of people in their eighties is growing.
This divergent expectation is precisely in the group with the greatest impact on absolute mortality rates.
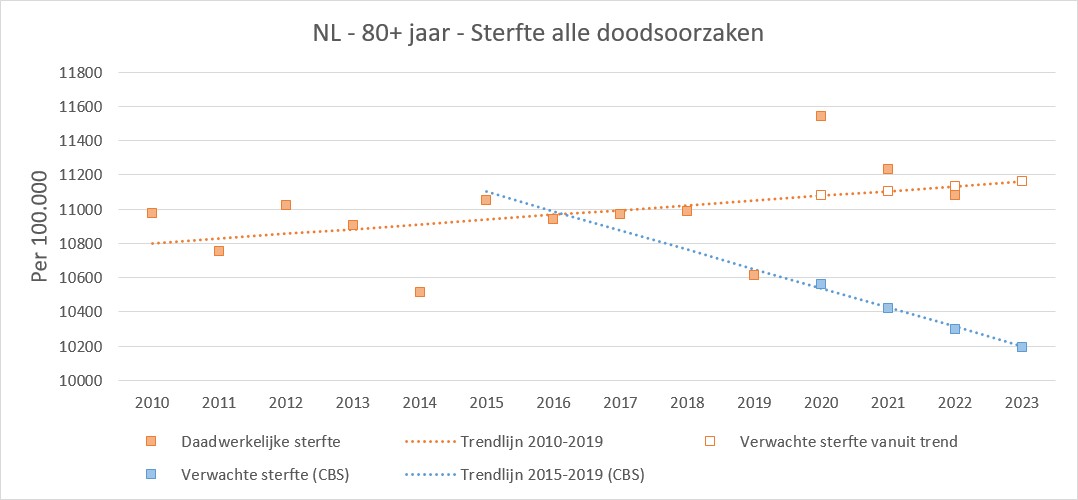
The difference has now risen to +/- 1000 deaths per 100k. While the Netherlands currently has about 875,000 over-80s. This wrong expectation will generate an increase in mortality of 8750 people by 2023.
Based on the CBS forecast, the increase in mortality is enormous. Based on the 10-year forecast (orange trend line), the over-80s actually only show an outlier in 2020, while 2021 and 2022 are already in the normal range.
Forecast 2023
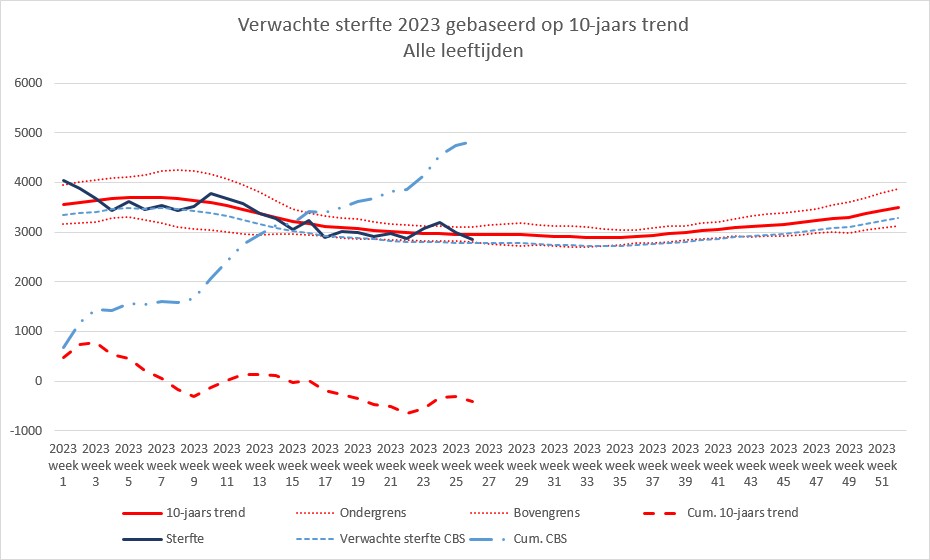
If we apply a correction factor of 6.4% to cbs' expected weekly mortality, based on the 10-year trend 2010-2019, the following graph emerges (updated to week 26).
Cbs expects more mortality up to +4800. The CBS cumulative excess mortality rate is a "continuous" upward trend, which indicates a miscalculation. Based on this trend, the increase in mortality this year will be +/- 10,000.
More mortality from the 10-year trend is about to rise -400 Right now. The 10-year trend hovers a bit around the 0-line, which was common in the years before the pandemic. There was more mortality in the winter months, dropping to less mortality in the summer, and probably rising again towards the end of the year.
Has the excess mortality issue been solved? No, we still see a (strongly) increased mortality in groups 0-65 and 65-80, which does not fit well with the 10-year trend.
For both groups, the excess mortality in the vaccination year 2021 was higher than the excess mortality in 2020. Precisely in the age groups, where you would expect that vaccination would reduce the excess mortality to normal proportions.
In the year 2023, we will also see an increase in mortality in both groups.
Conclusion
It is defensible that CBS' expectations have been underestimated. In particular, the crucial expectation of mortality of 80-year-olds is very low.
The difference between the 10-year trend and the CBS forecast is 57 deaths per 100k in 2023.
Based on these figures (57*178), this results in a standard excess mortality of +/- 10.000 on an annual basis and approximately 200 per week. This can almost entirely be explained by the very low expected mortality of the over-80s.
It's probably a diabolical dilemma for CBS. By adjusting the expected mortality, you implicitly admit that the excess mortality is much lower than you would expect due to corona: corona has actually caused little extra mortality. My prediction is therefore that the expected mortality for 2024 will be considerably increased.
Footnotes
- https://www.cbs.nl/nl-nl/nieuws/2023/05/eind-januari-geen-oversterfte-meer/oversterfte-en-verwachte-sterfte
- https://www.cbs.nl/nl-nl/nieuws/2023/04/2022-derde-jaar-op-rij-met-oversterfte
- https://www.cbs.nl/nl-nl/reeksen/sterfte-per-week
- https://www.cbs.nl/nl-nl/nieuws/2023/05/eind-januari-geen-oversterfte-meer
- https://www.cbs.nl/nl-nl/nieuws/2023/09/geen-oversterfte-in-februari
Encore
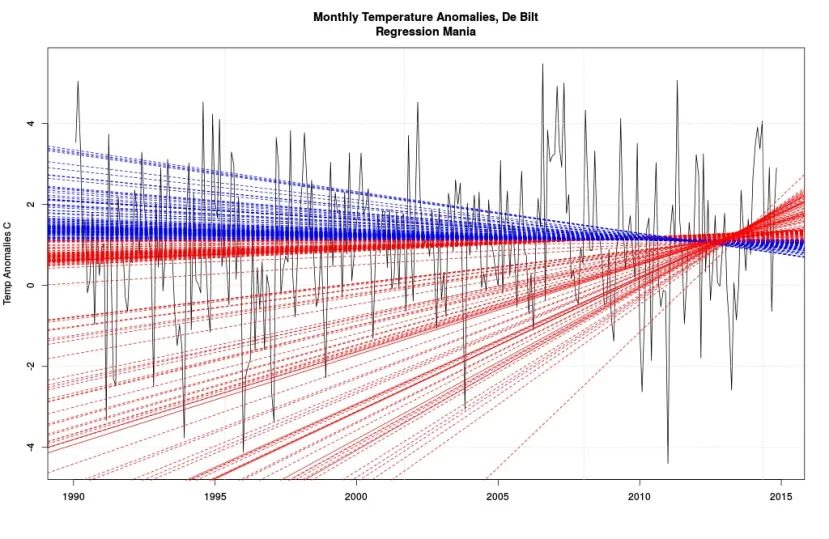
William Briggs re-posted an old article (from 2019) yesterday that fits seamlessly with this: how to steer trends by choosing different periods and time blocks. See the graph on the right: all trend lines can be justified, the only difference is in the choice of model: from which blocks do you take averages and how far back do you look. Incidentally, this graph does not show mortality but temperature trends, measured in De Bilt.
It's probably a diabolical dilemma for CBS. By adjusting the expected mortality, you implicitly admit that the mortality from corona is many times higher than the excess mortality: corona has then caused little extra mortality. My prediction is therefore that the expected mortality for 2024 will be considerably increased.
Think the second sentence should be vcn instead of corona?
No, right? It's not about vaccination. But it is true that the excess mortality from vaccination is also becoming less dramatic. If CBS were to raise its mortality expectation, they would give the impression that they wanted to cover up that mortality. At the earliest, in 5 or 10 years, we will only be able to assess to what extent such an increase was justified. Unless the much-requested death dates are released, then we'll know much sooner.
Very good analysis, thank you!
A request, you write: "In the year 2023, we will also see an increase in mortality in both groups." Is that correct?
The excess mortality in these groups decreased again in 2022, if I see it correctly. And with the 10-year trend line, the total excess mortality is about zero this year. If it's not right, please correct it. And if it's true, you've probably already made those graphs, would you like to post them?
I am referring to the increase in mortality on the basis of cbs expectations.
0-65 are at +600, and 65-80 are at +2000.
These are hefty numbers relative to 10-year trend. At 80+ you saw fluctuations, mainly due to the severity of the flu. You hardly see these fluctuations at 0-65 and 65-80. But since corona/vaccination/measures, you can see that 0-65 and 65-80 have abandoned this trend and score quite moderately. Still is.
https://twitter.com/BonneKlok/status/1679794166300114944?t=GTeSSJ_j-MzK2ntKmFqM9Q&s=19
A startling piece of work. Congratulations. The excess mortality mystery is now being looked at from a completely different angle. Doesn't the conclusions mean that "the mortality from corona is many times lower than the excess mortality" instead of higher? Isn't this the 'more mortality' compared to the too low CBS expectations? If I have understood correctly, more realistic mortality expectations lead to a reduction in the number of corona victims, but also a reduction in the reported excess mortality in recent years.
If you look at the actual mortality rates (80+), there are sometimes years in between with little mortality (2014, 2019); much lower than the trend. Presumably these are years with little flu. In the following years (e.g. 2015), slightly more mortality than the trend makes perfect sense. From this point of view, you expect more mortality in 2020 anyway, more than the trend. That does not change the actual number of corona victims, but it does partly explain why there were many. The impact of corona was therefore also less significant according to this additional consideration.
I don't know how the mortality projections are made in other (Western) countries, but there is a chance that 2019 has been a mild mortality year for the elderly in several countries. Then it could be that corona figures AND excess mortality rates are also exaggerated elsewhere.
The point is indeed more that corona mortality does not go down in this way (after all, it is not dependent on more mortality) but that corona does not cause exorbitant excess mortality either. So the new diagnosis/cause of death is different, but those people would have died differently. It might not even have been noticed that much ("a nasty flu this year, especially for the elderly"). See also the graphs by Herman Steigstra.
You can then ask yourself what the big problem is with corona and why, for example, vaccinations are still being carried out. Quite apart from the question of where the panic actually came from. As you may know, I suspect the Chinese and the virologists of that, who thought they could keep their problem under a bell jar. After that, pharma was eager to participate because in their business model, every pandemic is an opportunity. Public servants were also frightened and at the same time saw opportunities to strengthen their grip on society. They liked to act as strict protectors.
It is good that cbs' predictions are also being looked at. I don't think you took into account the size of that group when calculating the different age categories and divided the number of deaths in the group by the total population. Is that correct?
In the case of shifts between the different groups, this can have consequences with the expectation.
If you try to filter out the annual flu waves from your data by only looking at the summer weeks, you can see that CBS has not done so badly yet.
However, for those summer weeks you do see a very clear excess mortality that deviates from the trend.
It is good that cbs' predictions are also being looked at. I don't think you took into account the size of that group when calculating the size of the different age categories and divided the number of deaths in the group by the total population. Is that correct?
In the case of shifts between the different groups, this can have consequences with the expectation.
If you try to filter out the annual flu waves from your data by only looking at the summer weeks, you can see that CBS has not done so badly yet.
However, for those summer weeks you do see a very clear excess mortality that deviates from the trend.
Bonne has done it carefully, I think with the age cohorts as well. He's best off answering it himself.
I certainly took into account the different group sizes. Every 5 years cohorts are quite transparent (download in excel) at eurostat, and after that it was a matter of adding up.
"My prediction is therefore that the expected mortality for 2024 will be significantly increased."
And indeed, RIVM has done so in any case approx. 2 weeks ago.
I am still curious about the 80- and certainly 65- excess mortality.