
Good afternoon at the PEC Drs. Steigstra. Do you swear…?
Of course
You are known in the media as an Attic Room Statistician and Armchair Epidemiologist, which is why we have invited you to answer a number of questions.
Excellent
- Have the vaccines ended the pandemic?
- It is claimed that vaccination prevented deaths during the Delta Wave. Is that correct?
- Were the vaccines indeed 95% effective and safe?
- Studies have shown that the risk of death after vaccination is 30% lower. Is that correct?
- Critics claim that the excess mortality is among vaccinated people. Are there any indications for this?
- Critics are able to predict excess mortality based on the vaccination figures. Do you have examples of this?
- The government claims that vaccination prevents serious illness and ICU admissions. The NICE figures show something completely different. Is that known to you?
Herman Steigstra's imaginary interrogation could look like this. If only that happened; the answers are ready. And this is only about the vaccines.
Safe and effective? A review of seven claims about the corona vaccines
When the mRNA vaccines were introduced, we were told that they were “Safe and Effective”. It was also claimed that corona stopped “thanks to the vaccines”. New studies are constantly appearing that purport to confirm this, but is that true? To test which statements are true or not, we formulate seven hypotheses, which we will test for falsifiability.
- Vaccination ended the pandemic.
- Vaccination has limited mortality during Delta Wave.
- The vaccine was 95% effective, no serious harm.
- Vaccination resulted in a 30% reduction in mortality.
- Excess mortality occurred among unvaccinated people.
- Vaccination prevented serious illness.
- The vaccine caused vaccination damage.
Almost every study that examines the link between (excess) mortality and vaccination does so by examining the population afterwards can be divided into two groups: vaccinated and not vaccinated. This division assumes that two identical representative groups have been obtained. By comparing the mortality (probability) in both groups, the suggestion is made to obtain a measure of the difference in mortality probability between those who have been vaccinated and those who have not.
However, many disturbing influences lurk: differences in health situation, accuracy of registration of vaccinations and many other factors that seriously distort the results and therefore the conclusions. With a high vaccination rate of 90%, a deviation of 1% among the vaccinated, which is wrongly transferred to the unvaccinated, can increase the mortality among the unvaccinated by 10%.
In this analysis we do not base ourselves on individual mortality probabilities, but on the population as a whole. We thus shift the problem of putting together a good reference group to the mortality risk for the entire population.
Hypothesis: Vaccination ended the pandemic
This seems to be the most widely spread disinformation. It seems to be caused by the almost coincidence between the disappearance of corona and the start of the vaccinations. A striking example is the letter to parliament dated March 23, 2021 which Minister De Jonge sent to parliament, in which he outlined the success of the vaccination. We find this graph as substantiation for the success of vaccination at healthcare institutions.
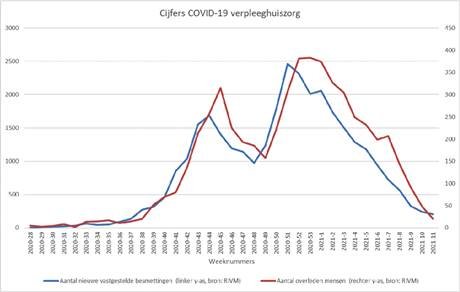
However, we see here that the established number of infections had been declining since the end of December 2020. Vaccinating residents of healthcare institutions only started in mid-January and full protection would not be achieved until February.
The decline in December 2020 cannot therefore have been the result of vaccination in 2021. We could possibly have seen a faster decline, but that also did not occur. Read more in End of corona thanks to vaccinations?
Other age groups give the same picture: no acceleration of the decline after the start of vaccination. This claim is therefore completely unproven. Moreover, we saw that a new corona wave came a few months later, which claimed as many victims as the first wave: the Delta wave.
Hypothesis: Vaccination ended the pandemic |
Hypothesis: Vaccination has limited mortality during Delta Wave
Despite the vaccine's claimed protection of 95%, a wave of deaths attributed to corona appeared at the end of October 2021. During that period, 8,743 more people died than expected. The number of additional deaths during the first wave was even slightly less, at 8,605. But what did we see here?
In order to be able to make a statement about the vaccinated mortality during the Delta Wave compared to the unvaccinated, we need good figures. It is often thought that there are none, but on February 23, 2024, CBS unexpectedly published it: Covid Vaccination Status and Mortality. The first article we published based on these figures was Vaccine no longer provides protection against corona and more specifically about the Delta Wave this article: The great secret of the Delta Golf.
The February 23 figures provide weekly mortality for the years 2021 and 2022, broken down by vaccination status, for both Covid-19 and all causes, exactly what we need! For a more detailed description, read the articles above. Here we will suffice with the figures specifically for the Delta Wave (October 2021 to December 2021).
During the corona pandemic, there were two conflicting sources for Covid-19 mortality: that of Statistics Netherlands itself and the RIVM. These were synchronous at the beginning of the pandemic but became increasingly divergent. During the Delta Wave this difference increased to a factor of 3.
We first assume the mortality from Covid-19 according to CBS figures. After all, almost all the necessary figures can be found in the February 23 figures from Statistics Netherlands. CBS uses a different criterion for Covid-19 as a cause of death than the RIVM.
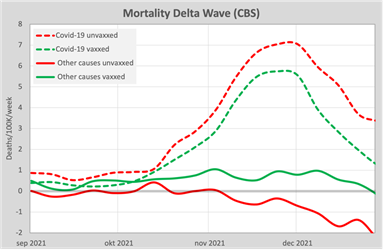
In this graph we see the weekly mortality from Covid-19, converted per 100,000 inhabitants, as dashed lines. Red is vaccinated and green unvaccinated. We see in this graph that vaccinated people have an advantage of approximately 1 Covid death per 100,000 per week. So vaccination helps somewhat, but certainly not 95%.
If Covid mortality falls from December 2021, we will still see the benefit of vaccinated people growing, while this should be greatest at the Covid peak.
However, there remains part of this wave of deaths that cannot be attributed to Covid-19. These are the solid lines, i.e. the mortality from causes other than Covid-19. We see the opposite effect here: vaccinated people have a higher risk of dying from other causes than unvaccinated people. The difference is almost equal to the difference in mortality from Covid-19. Since November, the chance of dying from a cause other than Covid-19 as an unvaccinated person has become even smaller than expected. You could translate that as: corona reduces the chance of dying from a cause other than Covid-19.
We can also use the 70% lower RIVM figures for the figures for Covid-19 as a cause of death. Covid-19 as a cause of death will therefore decrease by 70%, giving us a completely different picture. This is the graph that goes with it.
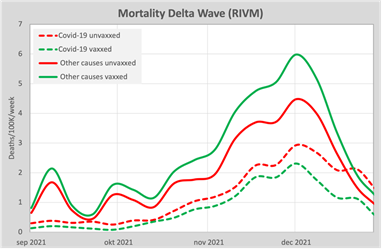
In this graph we see even more clearly that after vaccination the cause of death shifts from covid-19 to “something else”. That “something else” appears to have been a respiratory condition other than Covid-19.
Here we now see that the difference in non-covid mortality becomes smaller as the disease decreases. But that does not apply to Covid mortality - that difference continues to grow. .
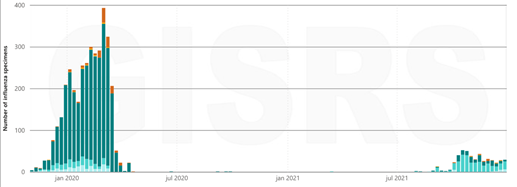
We see in this one graph positive influenza samples. After Influenza stayed away during the time there was corona. Whether that was really the case is doubtful.
But positive influenza samples are found again in October 2021. At the same time as the start of the Delta Wave. We emphasize that this concerns numbers of tests and not cases of illness. But there was influenza at the same time as Covid-19.
It is abundantly clear that Covid-19 is a replacement disease, just like influenza and flu. Vaccination may be able to partly prevent Covid-19 as a cause of death, but another cause will take its place.
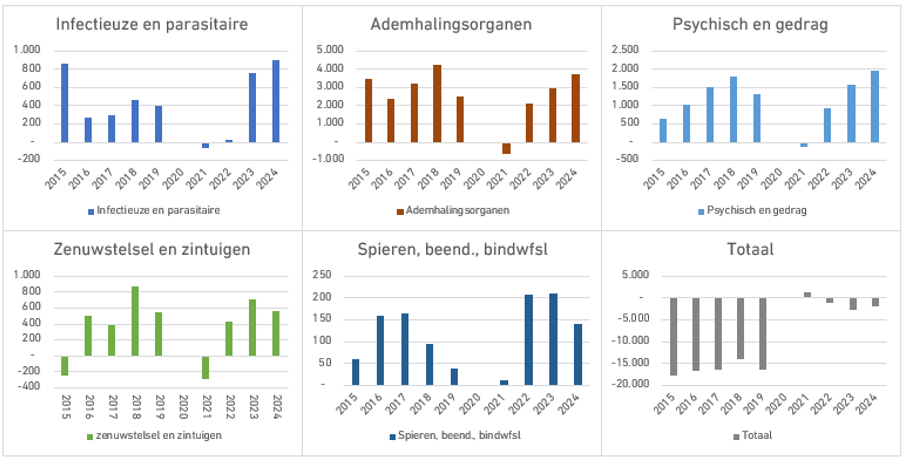
In short, there are no indications that vaccination against corona has prevented excess mortality: the total excess mortality was higher than in the first wave.
Other diseases declined when Covid was added as a cause of death.
Other causes of death shown as more/less than in 2020
Hypothesis: Vaccination has limited mortality during Delta Wave |
Hypothesis: Vaccine is 95% effective
All studies that find an advantage in vaccinated people compared to unvaccinated people use the subsequent division of the group into a vaccinated and unvaccinated part. The rules drawn up for this strongly determine the result of the study, which always favors the vaccine: the unvaccinated group is the reference. Known causes are the HVE and incomplete registration.
If we do not want to compare with an unvaccinated group as a reference, but want to consider mortality in the population as a whole, we will have to estimate what the mortality from Covid-19 would have been without vaccination. We will never know, but we can assume as an example that this mortality would have been the same as the mortality in the first half of the second wave. [AT5][AT6]Figures from Bulgaria, for example, which has a very low vaccination rate, seem to make this assumption plausible.
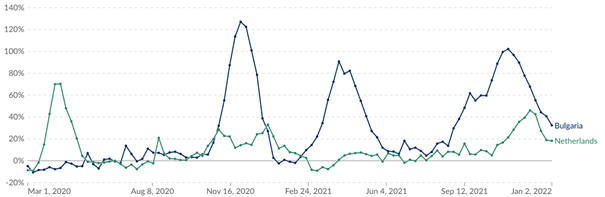
Due to the poorer health situation in Bulgaria, there are more Covid deaths there than in the Netherlands. But in Bulgaria there is a similar wave in October 2021 as in November 2020. The assumption that without vaccination there would have been as high a mortality from Covid-19 in the Netherlands in 2021 as in 2020 seems a reasonable starting point. Using this scenario as a starting point, we duplicate the Covid-19 mortality of the first half of the second wave (also referred to as the “second wave”).
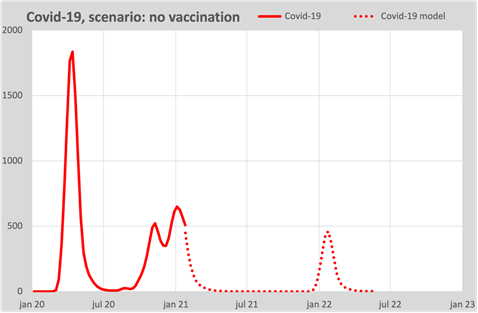
Without vaccination, there would be a comparable excess mortality in the winter of 2021/22 as in the autumn of 2020.
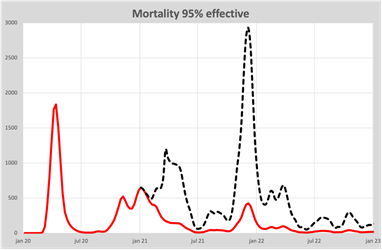
If we use this scenario, and assume the claimed 95% protection and a vaccination rate of 90% for the vulnerable groups, we can calculate a forecast. We see this in this graph, shown by the black dashed line.
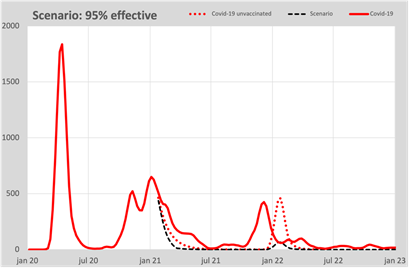
If the vaccine had also prevented the spread, mortality would have been much lower, because mortality only decreases because the spread ensures a much lower reproduction number. But we now know that this is not the case. There remains only protection against serious illness and death.
The actual mortality is the solid red line. The fact that the peaks do not coincide is a choice of the scenario: the Covid-19 wave at the end of 2021 came earlier than expected, no more than that.
But the height of the wave has not decreased compared to what was expected under the chosen scenario, which would mean that vaccination would not have provided any protection. Not an absolute conclusion, but the 95% claim is extremely unlikely.
Let's also test the hypothesis from the other side. What if the vaccine had indeed provided 95% protection? Then the mortality among unvaccinated people would have followed the black dashed line in 2021.
This would mean that mortality among unvaccinated people would have followed the black dashed line and that 56,000 people would have died from Covid-19: four times as many as in the first corona year. An extremely unlikely scenario.
There is therefore no indication that vaccination would have resulted in an observable decrease in the risk of death from Covid-19.
Hypothesis: Vaccine is 95% effective |
Hypothesis: Vaccine reduces mortality by 30%
There are studies that claim that vaccination would significantly reduce the risk of death for vaccinated people. Examples are the French study COVID-19 mRNA Vaccination and 4-Year All-Cause Mortality Among Adults Aged 18 to 59 Years in France or Nivel's research: Under-mortality among COVID-19 vaccinated and excess mortality among unvaccinated people.
Let's assume that in 2021 we had access to a vaccine that would indeed have those properties. We should therefore see a sharp decline in mortality from January 2021. What would the mortality expectancy be as a result of this vaccination? For example, it should look like this
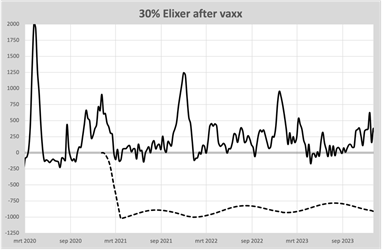
The vaccine should then behave like an elixir of life from 2021 and should show a 27% decrease in mortality with a 90% vaccination rate. In the actual mortality observed, we only see excess mortality.
If that 30% reduced mortality risk is true, then this is only possible if the mortality among unvaccinated people increases simultaneously by up to a factor of 5 at the rate of vaccination. A bizarre assumption. Yet that is what NIVEL sticks to.
The French have now decimated the outcome of their study to “mortality in the vaccinated group was 30% lower”. The big question is what characterizes that group. Also read, for example: French study: less mortality and more suicide among vaccinated people.
The hypothesis that vaccination causes under-mortality after vaccination must be considered unlikely.
Hypothesis: Vaccine reduces mortality by 30% |
Hypothesis: Excess mortality in unvaccinated people
As far as is known, all studies that conclude that there is excess mortality among the unvaccinated and that there is undermortality among the vaccinated use the same principle. When someone is vaccinated, a person who is as similar as possible is matched who is and will remain unvaccinated. Both groups are monitored for how long they survive. Statistical analysis always shows that vaccinated people die later (live longer) than unvaccinated people.
Professor Meester et al have also analyzed and published this using the microdata at CBS: Final report of the study into a possible relationship between Covid-19 vaccinations and excess mortality in the Netherlands 2021 - 2023. Their analysis also shows that the unvaccinated group has a lower chance of survival than the vaccinated group.
The graphical presentation of the data was done via a Caplan-mox curve, showing the survival rate for both groups. This is an example from their article:
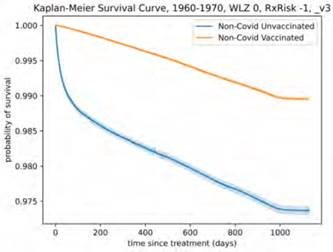
Because the probability of survival is somewhat difficult to interpret (why is that blue line so steep?), we have converted it (based on the same figures) into a graph in which the mortality rate is displayed. This is easier to understand intuitively. As an example, this is the daily mortality rate for people born between 1940 and 1950 (i.e. 70-80 years old).
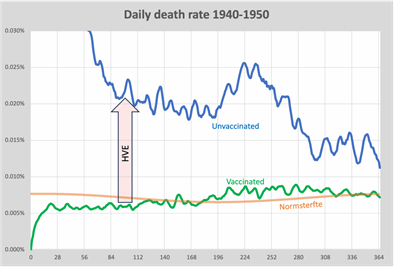
The blue line is the mortality rate for the unvaccinated, green for the vaccinated. For comparison, here is also the Norm mortality depicted. That is the (season-dependent) expected mortality for this age group. The x-axis shows the number of days since vaccination. We see in this graph that the mortality risk for vaccinated people on the day of their vaccination has suddenly dropped to zero and that is strange. Taking a vaccine that should only protect against Covid-19 also prevents death from other causes. In the days that follow, the chance of returning to the expected value after six months increases. After that, excess mortality occurs, so even despite vaccination: excess mortality.
The picture among unvaccinated people is exactly the opposite. A person who is administratively linked to a vaccinated person in the study has a 1,000 times higher risk of dying on that first day, which is even stranger. So only administrative linking causes an explosive increase in mortality risk. After six months, the risk of death is still double. So that is the chance of dying from any cause. Falling down kitchen steps is a hilarious example of this.
Obviously we are dealing with an artefact here and that is that the two groups are incomparable. It is the biggest culprit HVE (Healthy Vaccinee Effect), which means that the group to be vaccinated has a better health situation than the unvaccinated group. Someone who is in the final phase of life or even in a hospice will no longer be vaccinated and will die unvaccinated. Read more about this in the article Out mortality is with vaccinates!
The authors of these types of reports and studies often acknowledge this effect, but claim that this effect has been corrected for. But even more often, no correction is made. The Nivel report: Under-mortality among COVID-19 vaccinated and excess mortality among unvaccinated people that was published on the basis of this modeling has been withdrawn twice after criticism of the calculation method, but the conclusions based on the incorrect calculations still stand. Also read: Nivel for dummies.
Hypothesis: Under-mortality among vaccinated people; excess mortality in unvaccinated people |
Hypothesis: Vaccination prevents serious illness
Pfizer studies claim that vaccination with BNT162b2 would provide up to 96.7% protection against severe Covid. If those claims are true, we should see that effect immediately from February 2021. We already saw that mortality from Covid-19 was decreasing from December 2020, so vaccination should at least provide a boost to the ICUs. These are the figures for ICU admissions due to Covid-19 since 2020.
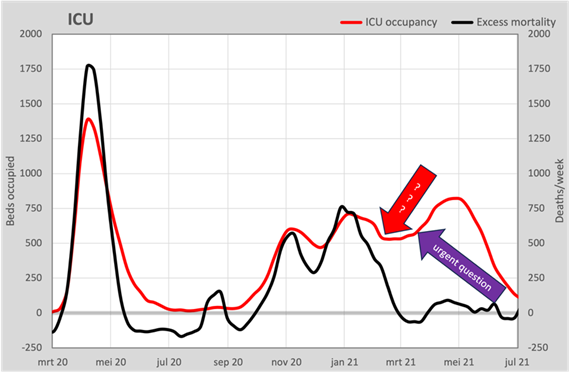
We see that from 2020 onwards the number of bed days will increase almost in parallel with the weekly excess mortality. The number of bed days also decreased in January 2021. However, in March these figures started to increase again, while the excess mortality (the black line in this graph) had disappeared. In May, the number of bed days itself was higher than we saw at the top of the second wave.
The vaccine has apparently not done its preventive work against serious illness, despite the virtual disappearance of excess mortality. The number of people in ICU due to Covid-19 actually increased. It cannot be ruled out that we are looking at patients with a positive PCR and were therefore admitted to the ICU as a preventive measure. But we only look at the numbers that the LCPS has made available to us.
This was known to the ministry, because an urgent question was asked to the OMT on March 8, 2021 (Source: Leon1969):

It has not led to a revision of the vaccination policy.
At the same time we can also look at hospital admissions, which are available per age group. Here we see approximately the same picture, with the exception of the elderly over 80 years of age.
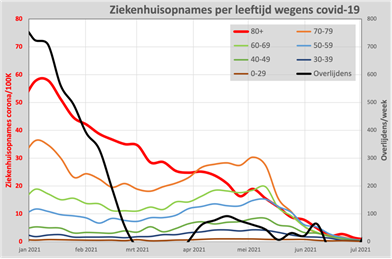
The number of hospital admissions there is declining more or less in line with expectations Ioannidis published: mortality rates are strongly age-dependent. At lower ages, we have actually seen an increase in hospital admissions due to Covid-19 complaints from March 2021 and that is strange. It paints the picture that since vaccination there was a mechanism that now caused additional health problems, especially in the age group of 70-79 years, that vaccination could not prevent. Vaccination has not prevented serious illness.
Hypothesis: Vaccination prevents serious illness |
Hypothesis: Vaccine causes vaccination damage
It is certain that people have died as a result of vaccination. Professor Arne Burkhardt (professor of pathology) has performed 75 autopsies in suspicious deaths. In 58 of the 75 autopsies, vaccination made an important, if not most important, contribution to death.
So it is certain that vaccination can cause health damage, the only question is to what extent. Without going into the medical aspect, we can actually distinguish 3 situations when mortality occurs as a result of the vaccination:
- Very short term (within a week)
- Medium term (approximately 3 months)
- Long term (longest period observed by Burkhardt is 580 days)
It is now possible to draw up a model in which these 3 moments are included as parameters. The outcome of that model remains an approximation and is only intended to demonstrate that it is possible to draw up a model that describes the observed excess mortality.
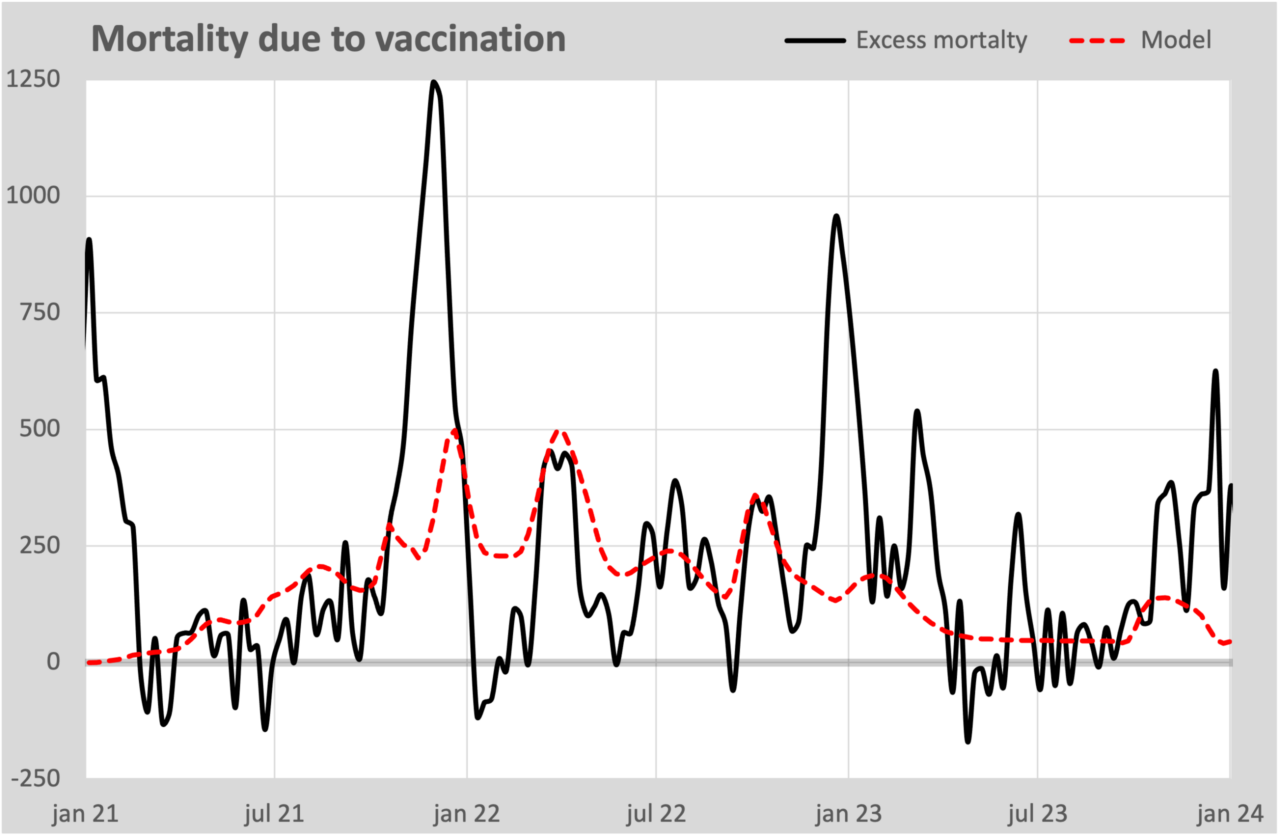
The dashed line shows the estimated excess mortality according to our own calculation model. Although the quantitative meaning has a lot of uncertainty, it still gives an impression of the vaccination damage. With this model, this will amount to approximately 31,000 additional deaths by the end of 2025.
We limit ourselves to the observation that it is possible to describe excess mortality with a model based on the number of vaccinations administered.
Hypothesis: Vaccine causes vaccination damage |
Conclusions
This article examined seven frequently heard statements about the corona vaccines. Not by comparing individual studies, but by testing the claims against the available population data and whether the claimed effects should actually be visible.
Based on this analysis, we find no convincing evidence for the following statements:
- Vaccination ended the pandemic.
- Vaccination has limited mortality during Delta Wave.
- The vaccine was 95% effective, no serious harm.
- Vaccination resulted in a 30% reduction in mortality.
- Excess mortality occurred among unvaccinated people.
- Vaccination prevented serious illness.
- The vaccine caused vaccination damage.
On the other hand, it appears possible to describe the observed excess mortality with a model in which the number of vaccinations administered is an explanatory variable. This in itself does not prove a causal relationship, but it does show that this hypothesis cannot be dismissed without further investigation.
The central conclusion of this article is therefore not that all answers have been definitively established, but that a number of frequently quoted claims are insufficiently supported by the observed population data. That is precisely why these questions deserve open, transparent and independent scientific follow-up research.

Hi Herman, it is a good overview of how such a discussion could go, thanks for that.
Unfortunately, I immediately choked on one of your analyses.
Under the title “Hypothesis: Vaccination has limited mortality during Delta Wave”, you think you can refute that hypothesis as follows:
"Red is vaccinated and green is unvaccinated. We see in this graph that vaccinated people have an advantage of approximately 1 Covid death per 100,000 per week. So vaccination helps somewhat, but certainly not 95%."
But it looks like all ages have been lumped together in that graph. And in the Netherlands, as in most other countries, proportionately more older, vulnerable people had been vaccinated.
The comparison is therefore completely flawed – unless it turns out that the HVE would coincidentally compensate for that skewed comparison. But you don't talk about that, even though it is known - and I have brought it to your attention before.
Even easier: no people have died from Covid. Any effectiveness found cannot therefore be effectiveness and must therefore be explained by distortion.
It's really not difficult: when you talk about dying from Covid, first show that the causative agent is a virus.
But this is a detail or.. even less than a detail (really the whole belief in virology means NOTHING).
I think Herman's excess mortality pictures over time and recurrence of diseases (who were on sabbatical in 2020) are telling or at least telling enough to say: This is not right!
But the latter cannot be said, which is also paradoxical: that the entire Covid era is ultimately smothered/suffocated by mass silence, not to have to say that the truth (brought out by the media, confirmed by the academy and implemented by politicians) about the years 20-22/23/24 is not correct!
Then explain where those death waves come from. Climate is very hip these days.
That's a shame, in Switzerland where I live, such figures were immediately published neatly in age groups.
It was therefore verifiable for everyone that during Delta the VE for Covid intensive care was around 90% - of course without correction for any remaining HVE and the like. Although most people in intensive care had been vaccinated, this was due to the high vaccination rate.
Better numbers mean better analysis, no doubt. But “more elderly people vaccinated” is far too simplistic. The oldest group, over 90 years old, is much less vaccinated (80% from memory) and 20% of them also die annually. Not vaccinating the most vulnerable elderly people will therefore strongly influence the figures in favor of the vaccine. But there are no better figures, at least not publicly….
I am already looking forward to the week when the vaccination campaign is the theme at the PEC. I fear that excess mortality will not have a theme week.
And I fear that I will become very annoyed again.
Until now, we still had a few people who were quite critical of the lockdown policy (Halsema, Kalverboer, Luijckx, Slob), most of them have already said implicitly or explicitly that they have a lot of confidence in mRNA.
What is so strange (or has it always been that way?) is that people all hear and see something different in the interrogations. Marianne and Maurice even have heated discussions about it. “Quite critical of the lockdown policy” I hear and see no one who says “Lockdowns should never have been allowed” there is always an explanation. Being threatened by teachers and then saying "those teachers felt unheard and scared..." Family dead by MRI and then "they didn't know so it's less bad... many, especially those in the PEC, knew and DO know! Why are there so many people who did know and know and tried to warn others and why are and are they being silenced?
It's not that strange at all. It's the Rule of Rescue, stupid.
Read my reflection on Halsema's interrogation (and Grapperhaus, which will be released soon).
I would like to shout it from the rooftops. But the message is not getting through.
Certainly Marianne Z. doesn't realize it. She showed the empathy of an earworm in her comment about Grapperhaus. From her own, completely justified (!) anger! As a result, she did not see what was really there to see.
Maurice saw it well, but in my opinion he did not interpret it completely.