
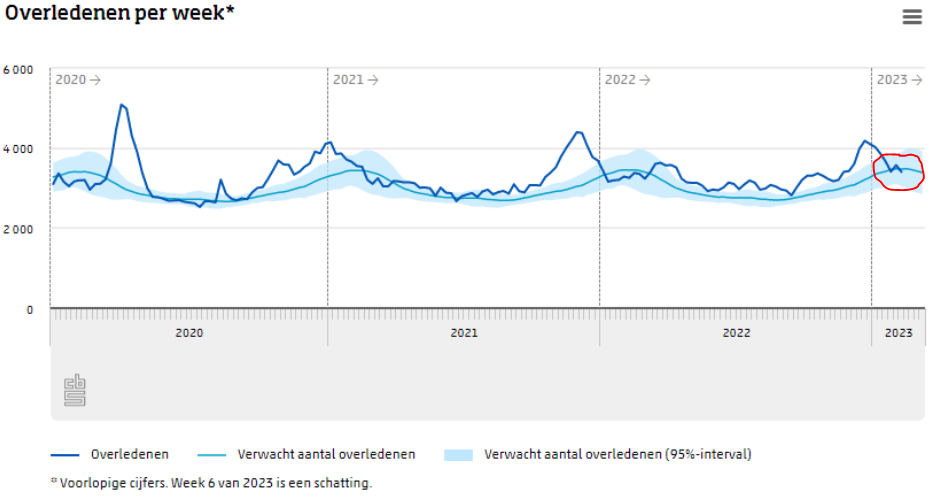
CBS gassed us with the new figures. The lower mortality of two weeks ago appears to have increased somewhat, then we were a negligible bit above expectations and this week we are just below it again. At least for the time being, because there may be additional additions later. The values are around the expectation for this period in a normal year. Three short explanations: find out. At the bottom of the post is a link to Herman's Twitter poll.
It is the following graph, circled in red in recent weeks.
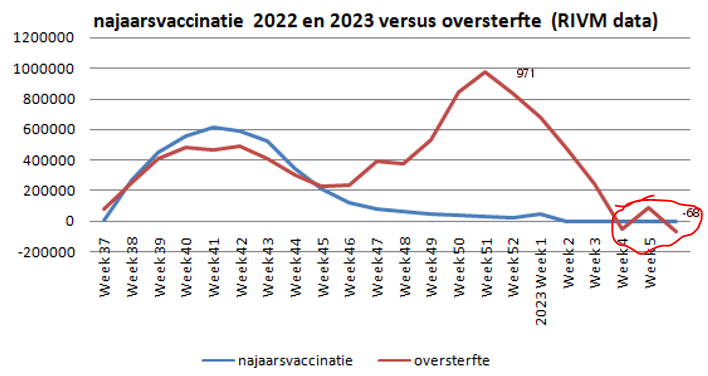
A reader's submission zooms in on the last few months in red and plots the vaccination dates per day in blue. Don't pay attention to the axis, just shows the vaccination levels. A second axis with also the numbers of deaths is considered fraudulent by some science journalists, which may be why it has been omitted.
The mortality level of the last few weeks is in line with the original expectation of an average year. You can explain this in different ways. Below are three options, which one is the most plausible? Choose your own statement!
Interpretation A: Too many flu deaths among young people
A regular flu mortality peak particularly affects the elderly, who would otherwise have died a few weeks or months later, or else at the latest with the next flu wave. The risk factor in flu increases exponentially with increasing age. This means that normally after a flu death peak, a dip, a pit in the graph of the most vulnerable, arises. Their deaths have been brought forward a few weeks. From the further away it is brought forward, the more widespread the missed mortality becomes, so that it is quickly no longer noticeable as a deviation in the figures. Clearly less mortality can be seen after the strong flu wave of 2017-2018, with approximately 9,500 flu deaths:

Now, at the beginning of February, there is no reduction in mortality in this order of magnitude. This could therefore mean that relatively many fewer vulnerable people (for example people over 60 or 80) have died. So relatively many 'young people' are affected. That's not really the flu, why are young people suddenly so vulnerable to the flu?
One answer could be: there is simply no under-mortality because the vulnerable group has been greatly thinned by previous waves.
The question then remains: why is there such a mortality peak, if the vulnerable have been so depleted? Are these all people who normally do not suffer from the flu?
Interpretation B: The hidden dip
It seems as if there is no reduction in mortality, but there is. Not in relation to the CBS expectation (the 'baseline'), but in accordance with the model formulated by Herman Steigstra. Before the flu wave came, that baseline had been raised for quite some time. It has risen systematically since mid-2021. First 20 deaths per day more, later 30, 40, to 50 deaths per day, just before the flu wave. See the green dashed line that shows the trend (sketchy).
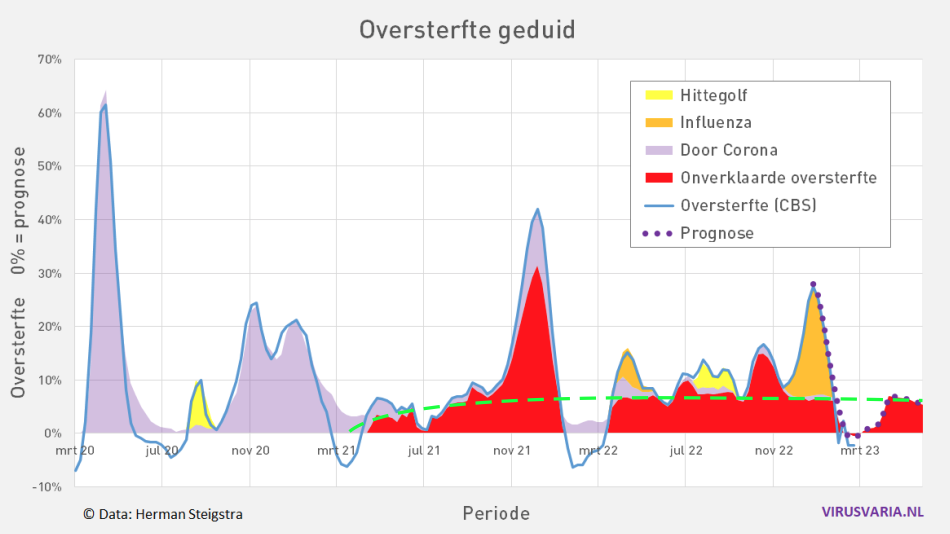
A sudden decline in that trend of continued unexplained excess mortality is unlikely.
A plausible explanation is therefore that the excess mortality trend has been approximately equal to the under-mortality dip in recent weeks - and then you arrive at the CBS baseline.
Interpretation C: Nothing wrong, excess mortality has disappeared
The government data expert and the PR officer of VWS explain:

De publiciteitsafdeling brengt het -in de eerste week(!)- zelfs als een "plottwist"! Spektakel dus!
If there is a tip of less mortality after a year and a half of excess mortality, then we read and hear that the excess mortality has suddenly disappeared, the mortality fluctuates around the expectation.
Als het om het klimaat gaat, wordt de redenering omgedraaid: "Nee, een paar koude winterdagen zeggen niets over de opwarming van de aarde. Ik leg het even uit..."
Vote now:

0 Reactions