
There is a clear excess mortality that is not discussed anywhere. Especially in times when new viruses are circulating and innovative medication is being rolled out, this should be absolutely impossible, under the care of health institutes and ministries. I find it more than worrying that silent excess mortality is still possible.
The only 'hard' figures that are properly kept up to date in the corona crisis are mortality figures. Unfortunately, this applies to a lesser extent for causes of death. These arrive at CBS on paper and before that data is received and processed, it will take at least weeks. Neither with Covid nor with vaccinations does the medical registration inspire much confidence. Now it also applies to mortality figures that you can keep track of them, but that does not mean that you can interpret them. Marcel Levi already talked about how difficult Corona math is – well, reading Corona comprehension is not for everyone either.
RIVM sticks to "no excess mortality"
One rivm report for July headlines: "In July, slightly more 65 to 80-year-olds died weekly than expected". A little more, yes, but because this mortality falls within the weekly fluctuation margins, there is no excess mortality according to RIVM:
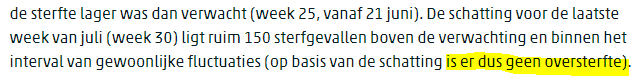
They must looking back a month to find a moment of undermortality. That moment is therefore highlighted, we see in a similar story About August: there is actually only a very occasional week of excess mortality, that is when the weekly deaths exceed the fluctuation margins, but immediately they repeat the good news from July: then there was no excess mortality.

In this way, you can maintain that there is no excess mortality in the event of an unexpected increase in annual mortality of 7800 deaths. The condition is that the weekly mortality has remained within the expected fluctuation – with one exception.
In June it was the same. According to RIVM, there is sometimes a week with excess mortality, but that only occurs if the line rises above the "fluctuation margin".
In a interview with Prof van der Valk, pathologist at VUMC, in overnu.nl (magazine with Dick Bijl, among others), we see that not only RIVM thinks so. These phrases stand out:
'At the same time, we also tell Van der Valk, there seems to be no excess mortality since the vaccination phase.
"There is no excess mortality," Van der Valk emphasizes. ‘
The journalist and the pathologist agree: there is no excess mortality. Are they missing something?
Only looking at weekly mortality is ostrich view
Compare it to throwing a dice. If you throw ten times and a six falls on another roll, you can say every time that that six is normal; after all, it falls within the expected range of 1 to 6. If you throw twenty-five times and it remains a six for half of all throws, then a red flag must go up. Take a closer look at that die or try another one, for example. Or you shrug your shoulders and wait until a thousand throws have been made or ten thousand. If sixes are still 50% of the total, then you will see that again. Then you may not be such an inquisitive mind or you just don't need to know that there is something about that die, for example because you picked it out yourself.
There are statistical tests to see if you are within a margin of chance. This works better with dice than with people in constantly changing circumstances. This is about human lives, so you can be alert and use your common sense and not just look at your weekly interval margin. If anyone wants to verify this statistically, please do!
"Fluctuation interval"
Mortality fluctuates from week to week, sometimes a little less, sometimes a little more. In this way, the moving average eventually returns to approximately the expected line in normal developments. Some uncertainty intervals are at the rivm retrofitted So we shouldn't attach too much importance to the actual course. But it is a guideline.
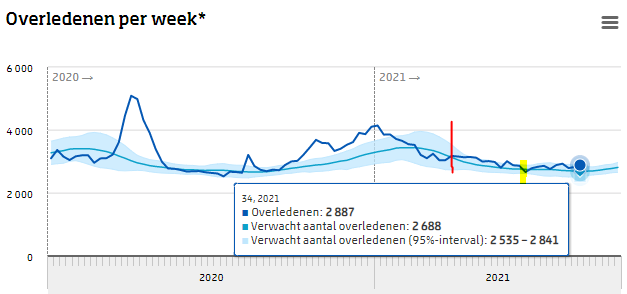
The RIVM graph below shows that since week 12 (the red line) we have not had any fluctuations around expected mortality, as I pointed out in the previous post. Week 25 (the yellow marker line) showed one dip, just below expectations. Week 13 is the week of April 1, Week 34 is the last full week of August. This means that mortality was well above expectations during the months of April-May-June-July-August. Per week usually just within the 'fluctuation margins', but there was hardly any fluctuation anymore. At the monthly or quarterly level, this really has to run out of the 'fluctuation margins'. This is a period of five months(!), week after week with a single exception in week 25, when there were 89 fewer deaths than expected. In last week 34 (August, summer!), for example, there are 199 more, as in many other weeks, so above 100.
"No excess mortality": now in absolute numbers and graphs
Excess mortality is mainly visible in the age group of 65-80. In the group of 0-65 I find it more difficult to prove it and it is about smaller numbers anyway. This also applies to the over-80s, where you would expect undermortality given the clear-cutting in the previous Covid waves. That undermortality is not there, it continues to look 'normal', which could also be a sign that there is increased mortality. So I focused on the group of 65-80 years old to take a closer look.
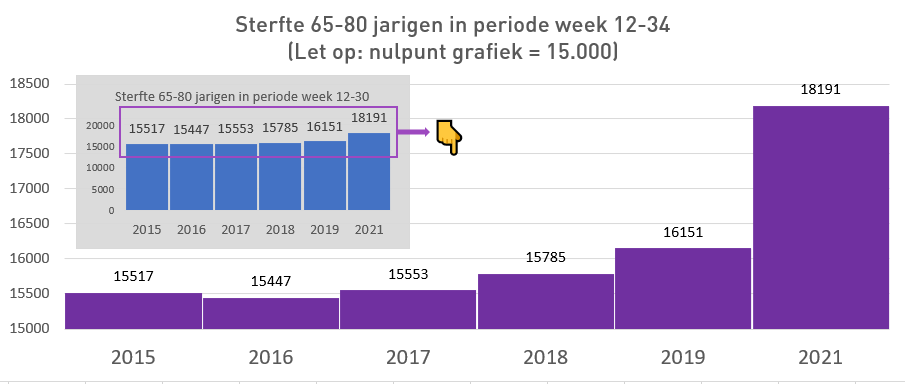
The weekly mortality rates of recent years can be compared with each other. I downloaded the table from CBS and compared the periods of weeks 12-34. To make the point clearer, I have applied some graphic amplifications (as the RIVM also likes to do):
- The purple graph is a detail enlargement to make the differ in the blue graph. Basic Y-axis: 15,000.)
- The year 2020 has been omitted from this graph due to Covid mortality in April-May 2020. Because almost all 65-80 year olds were vaccinated in 2021, we are looking for comparisons with other non-Covid periods (April in 2020 distorts the picture due to Covid mortality).
- The blue bars show the full mortality in weeks 12 to 34, in the years 2015-2021 (excluding 2020).
We can also take a shorter period, from June. According to the RIVM, there was no longer any significant Corona mortality then. That was also the case in 2020, so 2020 is also included here in this graph:
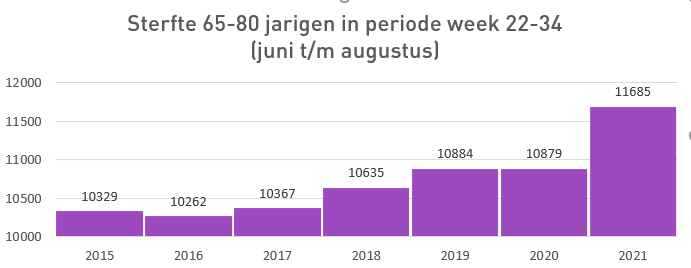
Over the past 6 years, an average of 10,559 people between the ages of 65 and 80 have died in the summer months. In 2021, there are 11,685. That is 10% more mortality than average – not a coincidental daily peak but seen over an entire quarter. How is that possible?
Everyone has their own statement
Kerkraad GP: 'Death due to no vaccination'

Nieuwsuur ("MSM" who is sometimes surprisingly critical and at the same time spreads astonishing errors) reports on a general practitioner from Kerkrade who just happened to report a Covid death to the GGD in the presence of the journalist. Telephonic. See the message from Geenstijl, including the RIVM graphs.
A bit too coincidental? Yes, because the last death in Kerkrade was April 17. [edit: a death dated September 3 has now surfaced from the archives of the RIVM.]
Kerkrade has a vaccination rate of "only" 70%, which not so long ago, according to the experts of the RIVM, was more than enough to "get a mutating respiratory and seasonal virus under control". That is apparently disappointing. So the fear has to be put back in for a while. That is why the propaganda machine sets out and Nieuwsuur, which may still have had a glimmer of credibility, visits a Dutch GP in Kerkrade. So who just has the GGD on the phone with a report of Covid death, in the presence of the journalist.
The doctor is of course happy to participate because doctors believe in pricking, in acting, intervening, the last thing they want is to stand idly by. They are not allowed to prescribe medication. They eat from the collective rack of insurers and governments, so you are not going to rub them the wrong way and besides, you are fused with that system; If you start doubting that, you turn your entire right to exist and identity as a doctor upside down. You follow the guidelines, the specialists, trust the policy, the science that is handed to you by the government because you cannot stay informed of everything yourself. All very understandable.
German pathologist: 'Death by vaccination'
A German pathologist examined people who died after vaccination and found that in 30 to 40 percent of the deceased a causal relationship with the vaccination was plausible, as can be read in major German magazines such as Die ZeitandDie Welt.
"Mehr als 40 Menschen habe man bereits obduziert, die binnen zwei Wochen nach einer Impfung gestorben sind. Schirmacher geht davon aus, dass 30 bis 40 Prozent davon an der Impfung gestorben sind. Die Häufigkeit tödlicher Impffolgen …unterschätzt".https://t.co/2JzuDlzfXV
— Arthur Lauper (@Suizaya) August 18, 2021
Now "plausible" is something different from "probable" and very different from "proven" so let's try to understand it carefully. Let it be 20% instead of the maximum 40%, what would that mean for the Netherlands? That brings you to 500 vaccine-related deaths per week, or about two thousand per month (estimate about 2,500 elderly people/vaccinated people). Those deaths should perhaps also be partly subtracted from the Covid deaths, but yes, there are very few of them in the summer period when the vaccines were able to do their job.
Such numbers should be reflected in the excess mortality figures. We have seen above that there is a maximum of 300 per month, as far as June-July-August is concerned. Numbers of "500 vaccine deaths per week" do not fit in with this.
The question remains what caused the death of that 39-year-old woman. It could unexpectedly be Covid, but then that would indicate that the RIVM report has dropped a stitch – which is unthinkable. [edit: now solved by a find from the RIVM]
[edit 15 Sept: Annelies Strikkers at Blckbx has delved into it further: "She could still have lived," claims GP at Nieuwsuur about unvaccinated people... — blckbx.tv ]
Double feeling
The messing around with the death toll feels like virtual grave desecration. The deceased are made instruments of a communication target while their causes of death should be the subject of investigation.
Other age groups are now underexposed. If we look at the group 0-65 years, you see the same thing happening with lower figures. At the over-65s, there is no expected undermortality after the serious excess mortality, which you could also call: 'higher than expected'. Unfortunately, the models are not able to predict or evaluate so exactly.
So once again: where does that mortality come from?