
All data indicate: the more often pricked, the more hospital admissions. Really a lot more. Then, of course, age plays a role: the older, the more jabs. Hospital admissions correlate with age, so it makes sense that vaccination status does. But to what extent is that correct: is there vaccine damage or are these hospital admissions mainly age-driven?
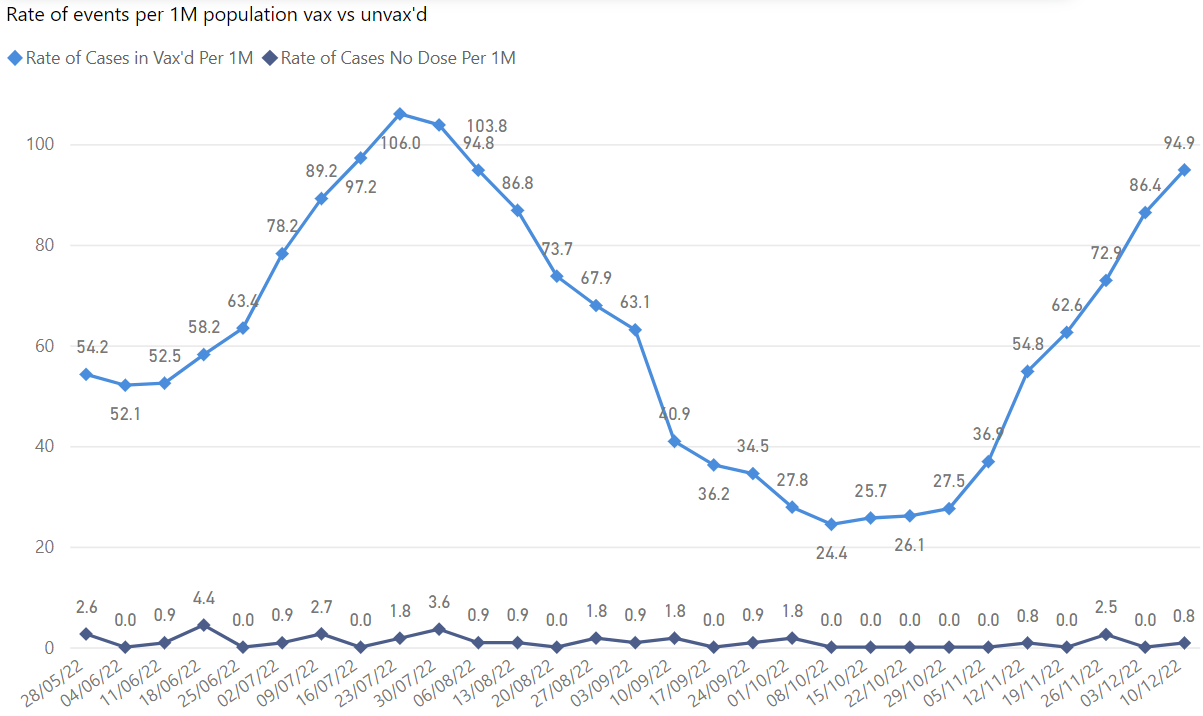
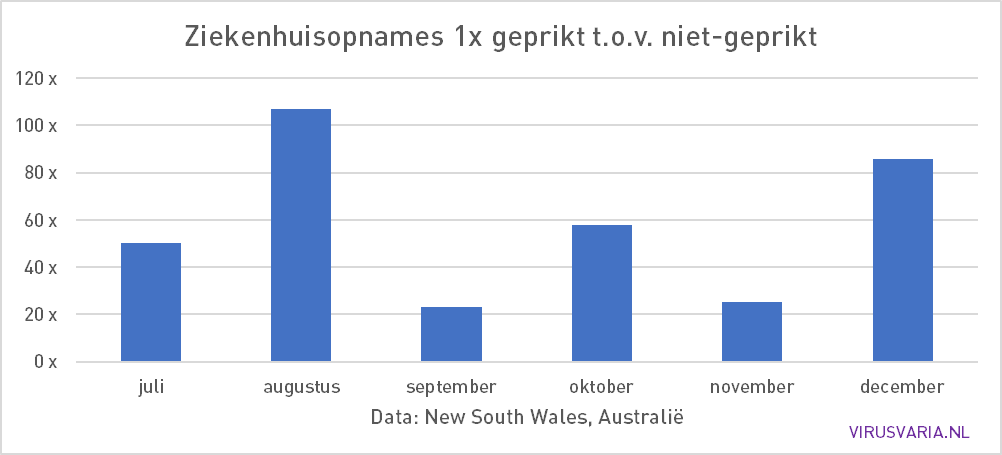
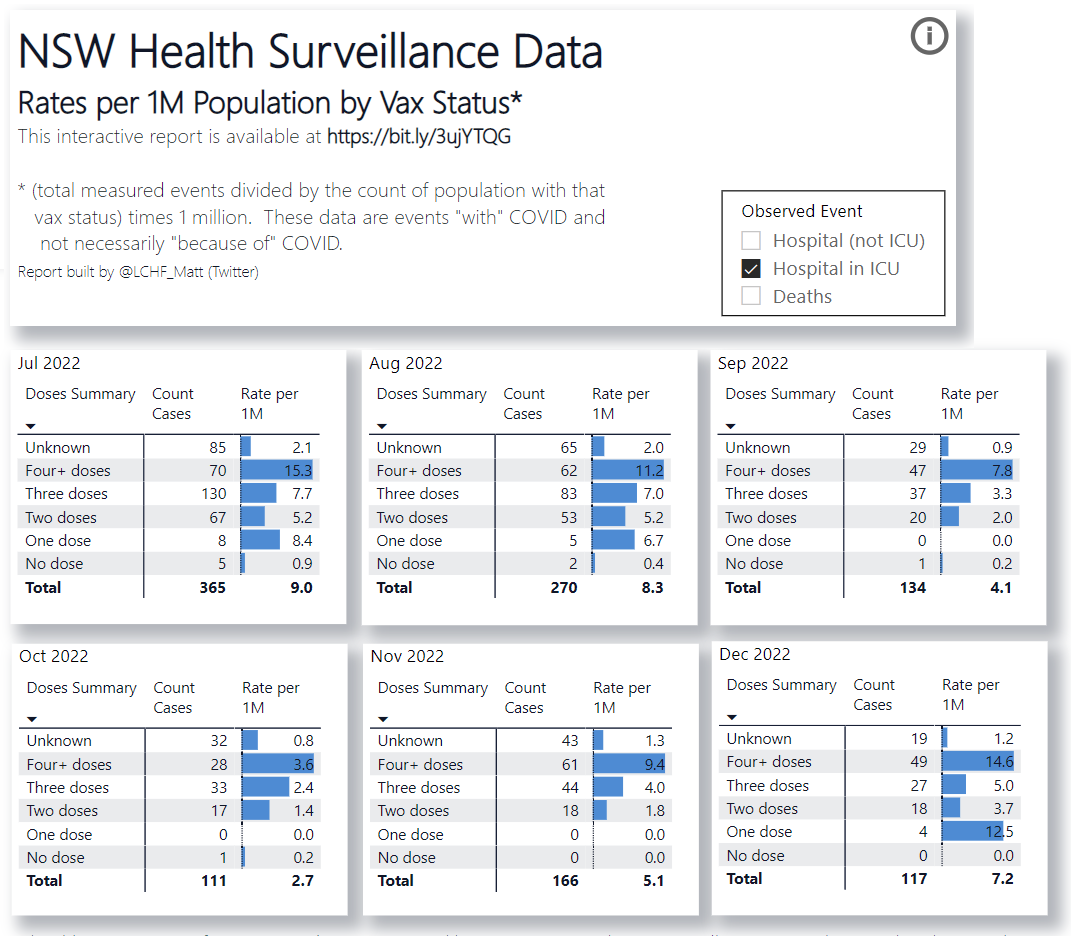
The reason to take a closer look at this was a dashboard of data analyst. @LCHF_Matt with the dates of New South Wales. For example, this graph of hospitalizations with/due to Covid.
- Light blue: admissions per 1 million vaccinated people.
- Dark blue: admissions per 1 million unvaccinated.
Is this really just due to age difference...?
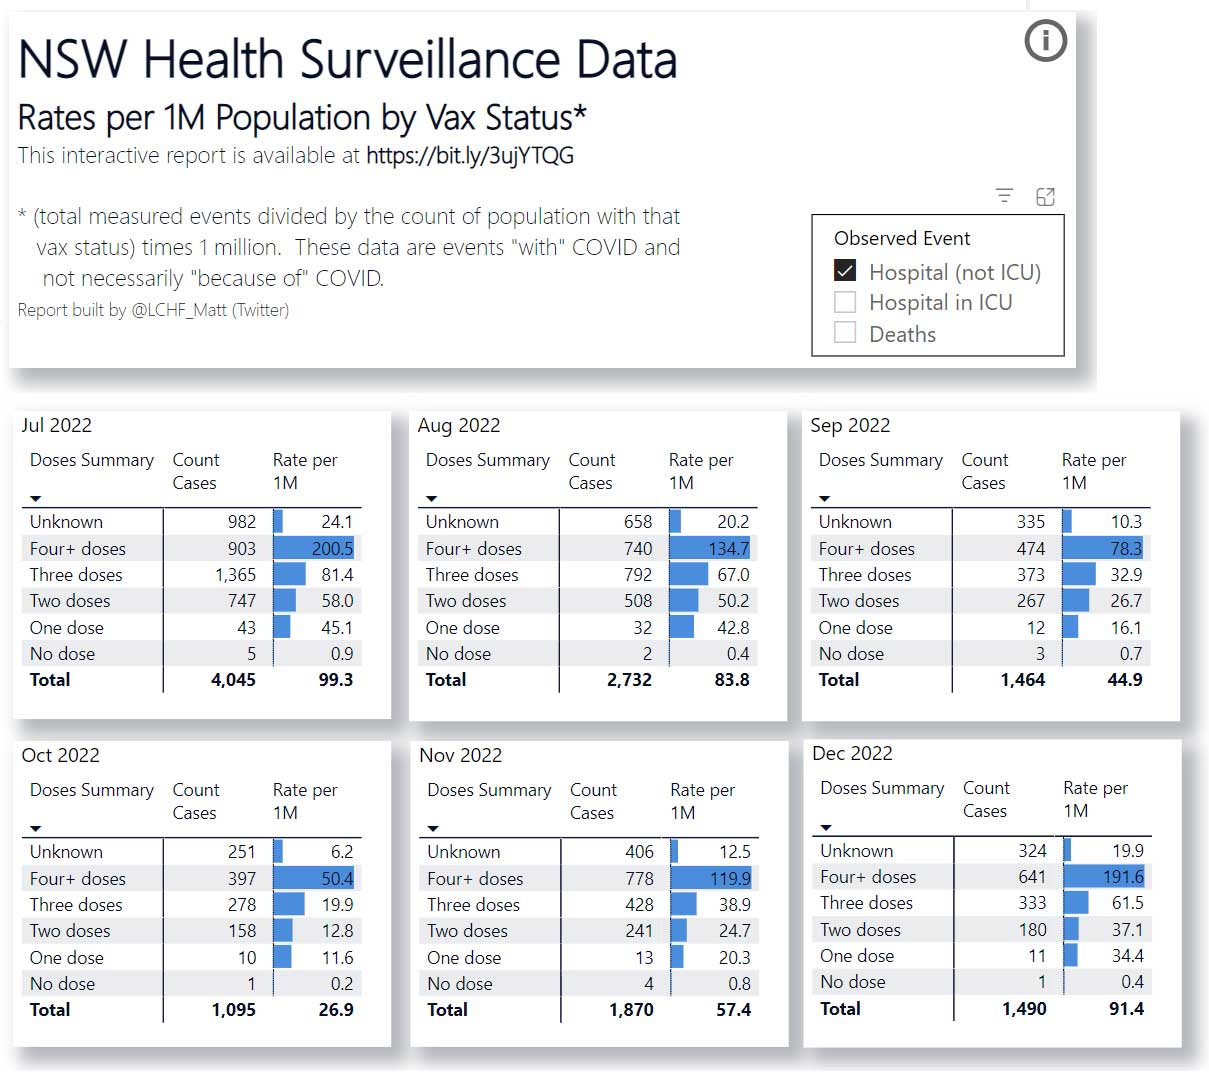
The last six months of 2022 sprouted:
All graphs indicate: the more often pricked, the more shots. Really a lot more.
New South Wales is firmly in it

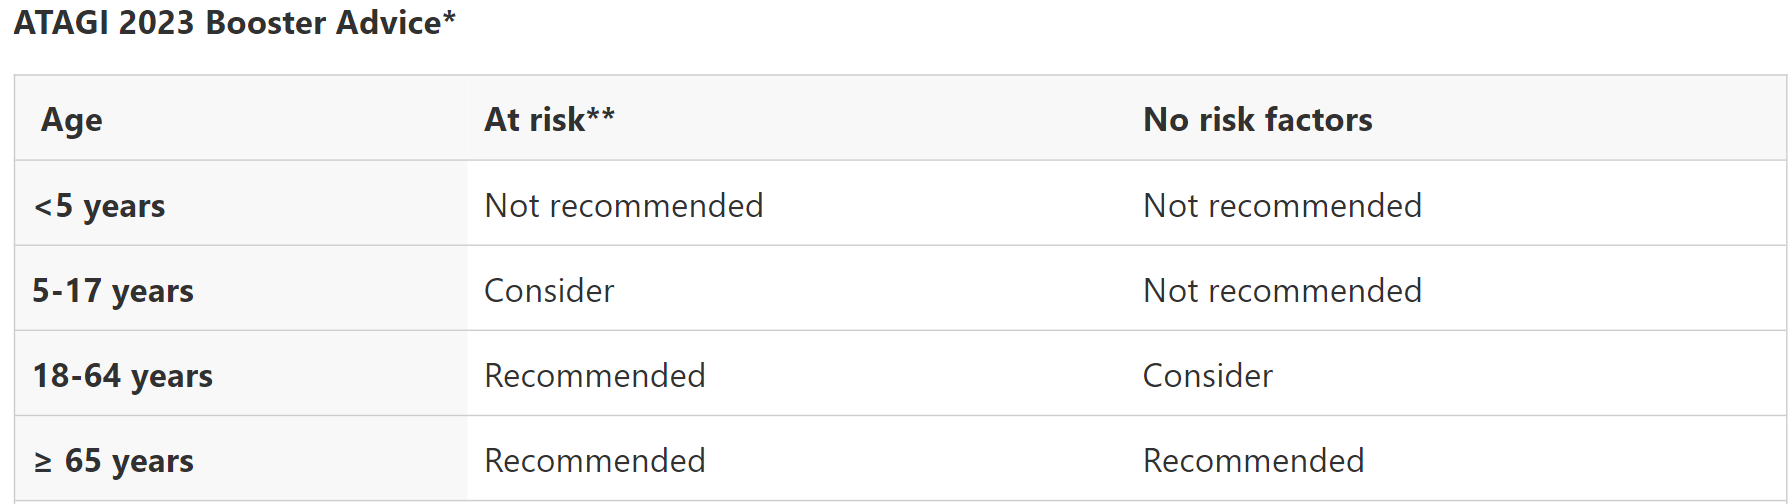
...terwijl ATAGI (Australian Technical Advisory Group on Immunisation) iets says otherwise.
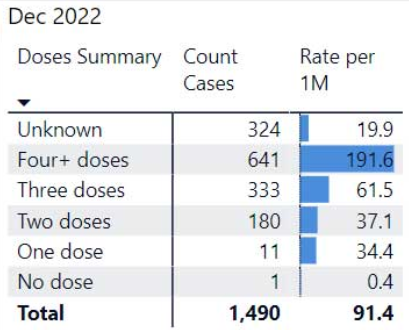
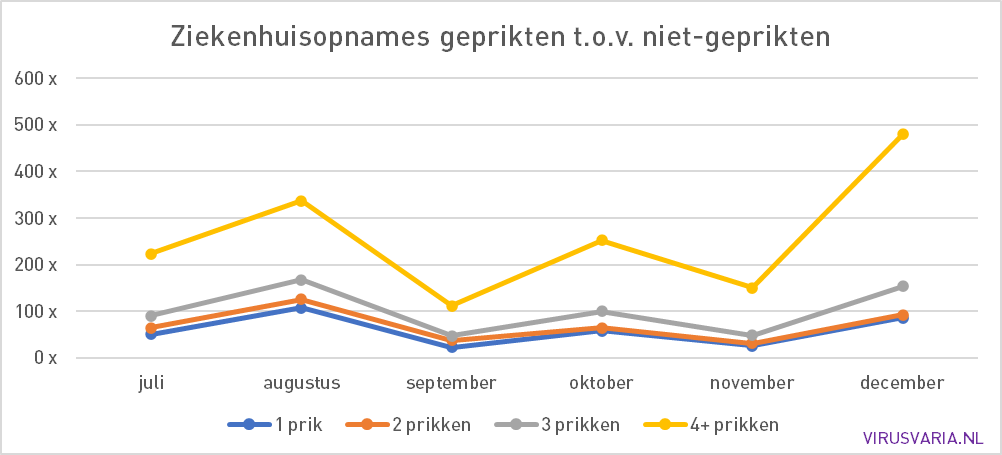
Look at the last reported month, December 2022: that's shocking. Of the people who have had 4 or more vaccinations, 191.6 per million were hospitalized. Of the unvaccinated: 0.4 per million. Is that age?
The 4x recipients will probably be mainly elderly, but then vaccination does not seem to help very much...? Then look at the boosted (3 injections): 166 times as likely to be hospitalized as those who have not been vaccinated.
In NSW, one third of children between the ages of 5-11 are double-vaccinated
Perhaps we can assume that the age difference between 0 and 1 dose is not that great. That first dose was also more than a year ago. From July to December 2022, those with that one old injection in their body were on average 58 times more likely to be in hospital with Covid than unvaccinated people... with the winter month of August as an outlier: 107 times more likely to be in hospital with Covid. That difference is much smaller between the other successive vaccinations (see graph below). I don't really see how this can be explained by age. But that is intuitive, so time for a grade check.
Reference: CBS
At CBS 'flu' falls under the diseases of the respiratory system. In the CBS archives here and here (more recent figures are welcome, I don't expect them to have changed much all of a sudden) the usual ratio in hospital admissions between people in their twenties and eighties was between 1:4 and 1:6. On average, about five times as many people in their eighties as people in their twenties.
Back to down under. Even in the hypothetical case that zero and ankle pickers would only be in their twenties and the quartet + skewers would only be in their eighties, there would still have to be at most 6x as many polypunctures in the hospital (with a vaccine without any effect). But for those with 1 jab, that is on average ten times as high: 58x. And it's only getting worse.
The graph below shows the ratios of 1, 2, 3 and 4+ jabs compared to 0 jabs. Here we even end up in the hundreds at 3x and 4x pricked.
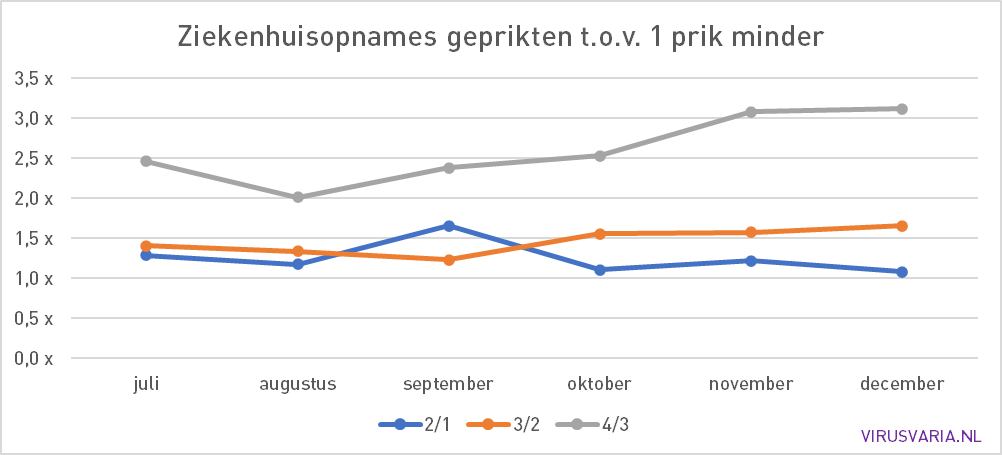
If you compare each injection with the previous injection, all values are still above 1. The first injection was 58 times more likely to result in hospitalization and each subsequent injection increases that risk by a factor of 1.2 to 1.5. Even increase 4 by a factor of 3 - but there may still be some confounding lurking there. In any case: if a shot would improve the situation compared to the previous shot, all the dots should be below 1.
Other explanations
Age discrimination to the max?
Covid is mogelijk leeftijdsdiscriminerender dan de griep. Dan zou de leeftijd veel zwaarder wegen. Of dat dan werkelijk in staat is om een factor 6 op te hogen naar een factor van in de honderden, dat waag ik te betwijfelen. Daar komt bij dat men die extreme leeftijdsdiscriminatie dan al in 2020 na een paar weken (vooruit: maanden) had gezien - of zeker had moeten zien. Zoiets mis je niet. Dan is het des te erger dat jongeren en kinderen klem zijn gezet om een spuit in hun arm te laten jassen, ik kan het niet anders noemen, met alle dreigpraat vanuit de overheid en medische hoogwaardigheidsbekleders. Want dat vrijwel alle risico bij de ouderen lag, betekent dat kinderen niets hadden te vrezen. En het "dan doe je het voor een ander" smoesje was een kinderdokterleugentje voor bestwil met fatale gevolgen.
Wrong denominator? Also not...
In NSW, the age group 16+ is more than 95% vaccinated. From 12-15 years it is 85%. From 5-11 years: 50% (source). That says nothing about the unvaccinated.
From the UK we know the problem of the wrong denominator: if the number of unvaccinated people is misjudged, you quickly get strange figures. In this case, that group in NSW would have to have been estimated far too large to explain the low incidence. But then really dozens, hundreds of times too big. That's unlikely.
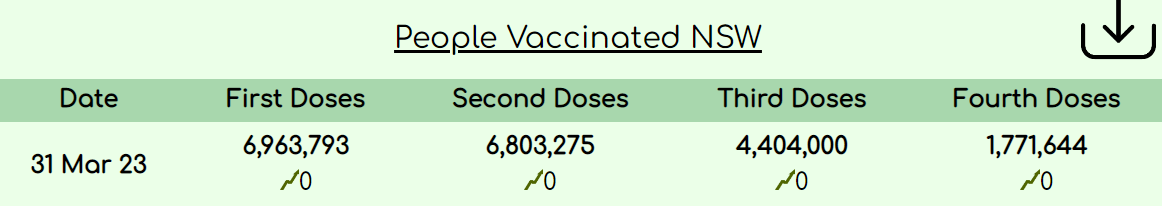
NSW has a population of 8.2 million. 7 million has had jab 1. So 1.2 million is NOT vaccinated. The dashboard calculates with 1.1 million, which makes no significant difference in the calculations. So that seems to be true.
Conclusion
It is actually the same as with the TGA report on the Pfizer research. Everything gives rise to the image of a rubbish vaccine with unknown risks. See the Campbell video below. If you don't understand Australian, turn on the subtitles. His interlocutor, Prof. Clancy, was a vaccine evaluator for TGA during his working life. He also finds it incomprehensible that the vaccines have been approved with such an assessment.
In short: junk, approved by FDA, EMA, CBG, rivm etc. and then rammed down our throats and the rest of the world's population.
Kwakzalverij, with the Skepsis Foundation as one of the communications agencies.
And the media still doesn't run amok about it.
In Germany, it seems to be coming loose. See the heated discussion in the Bild video. Gunter Frank is a doctor who developed problems of conscience after taking eight jabs. He speaks harshly, believes that crimes have been committed and that the guilty should be brought to justice.
An investigation into the state of affairs surrounding corona should not be carried out by the perpetrators but by those who have been systematically ignored and ridiculed.
Gunter Frank
Sounds familiar, right?
Question marks
Dat was de ziekenhuisbezetting. Kijken we naar de IC, dan scoren ook daar de niet-geprikten het laagst. (Wat er in December met de "One dose" groep gebeurt kan ik niet uitleggen. Datafout?)
In mortality, the 0-dose group scores worse than those who have had 1 or 2 jabs. Those are nowhere near the differences we saw earlier, but still, it does make a difference. Do they take a PCR test for everyone who dies, does anyone know? How else do they know? Are most people perhaps positive, they also do not notice the infection and does Covid have nothing to do with the cause of death? The numbers are so small that those differences and outliers may not even be significant.
ICU occupancy (with Covid)
Mortality (with Covid)

Error in the labels
If anyone delves into the figures: the bars per graph correctly represent the proportions. But the monthly graphs are not correct. Compare November and December on the mortality graph: both 9 cases with 'No dose', which is 1.9 per million in November and 3.8 per million a month later. That would mean that the population has halved in December. I contacted the author about this and there is indeed an error in the text labels, at least from December. They all seem divided by 5... He adjusts it.
[He now indicates that he has fixed it, but I don't see the visualization discussed anymore. However, line graphs with the same data.]

Good piece again. Robert Clancy is a breath of fresh air. You have to use very bizarre twists of thought to maintain that the 'vaccines' have had a positive effect, The discussion with Gunter Frank is nice to see. Now something like this in the Netherlands.
I assume you know this one too:
https://www.conservativewoman.co.uk/hospital-admissions-double-and-its-got-to-be-down-to-the-vaccines/
Doubling of hospital admissions in New Zealand in 2021 with reasons. Zero Covid in 2021, but completely packed. Same story in West Australia. If you add all those signals together, it's not a discussion anymore, is it? It looks legitimate.
But I'm still seen as a village idiot at work. Most people have no idea, they don't want to hear it. I don't keep my mouth shut anymore, even if they say they don't want to talk about it. Rather the village madman than a mak sheep.
Fine, Cees! I am also still amazed at how this scandal is still being kept quiet in the Netherlands. From the origin of the virus to the nonsense of the measures and ignoring the lethality of the vaccines. Not to mention the uselessness of that terrible corona admission ticket. Do Marion and Hugo have such a huge influence that 'people' just don't see it? Are our media so corrupt and bribed that NONE of this comes to light? Yes, continuing to talk about it is the best we can do. Every Dutchman who sees the truth is a gain, in my view! I myself have seen a sporty 20-year-old boy succumb in my area 1 day after vaccination, and know how much that hurts... And, at the same time, the pain caused by people who don't want to see it.
Not wanting to know the majority of the Dutch reminds me suspiciously of the cowardly attitude that was also taken in 40-45 by the vast majority of the population (given the threat somewhat understandable).
Just as most Dutch people supported the resistance after the war, it will now be the same again in this COVID slaughter. There was and has hardly been any courage when it came to it. A sad conclusion that unfortunately I cannot see otherwise.
In the Netherlands, the figures are even more manipulated because relatively many very weak people, almost all of whom have been vaccinated from the 2,400 care and nursing homes, are less likely to be admitted. RIVM only assumes the corona hospital admissions when calculating the effectiveness of the shots.
Not only are infected people in homes less admitted to hospitals; the chance that they will be admitted to ICU is even smaller because we have above-average strict criteria for this in the Netherlands. So especially younger, less weak people end up in ICU, who are less vaccinated in percentage terms. Vulnerable people are relatively much more vaccinated, more than 90 percent. Those will therefore die faster if they are and shorter in ICU.
lie. So when you say: Of the ICU occupancy today, 60 percent have not been vaccinated, that says little.
Furthermore, ICU occupancy rates and hospital figures are polluted, because many people who are very weak do not get a shot because they die quickly or because they take certain medications or have chemo. Together with the youth who were almost always hospitalized with corona and the thousands of heavily pregnant women who are relatively less vaccinated, they pollute the ratio of grafted versus non-grafted enormously.
Moreover, in hospitals in 2021, the percentage who were not admitted by corona, but only rightly or wrongly tested positive in the hospital, had risen to an average of 50-55 percent and in 2022 to above 90 percent.
This analysis is dubious. Not only are the numbers of admissions of unvaccinated people particularly low, but the numbers of admissions in the "Unkown" group are also particularly high (percentages above 20%). Anyone with any practical experience with statistical analyses should immediately start ringing alarm bells.
What is going on there?
My suggestion: the administrative system of hospitals classifies unvaccinated people as unknown in many cases.
We see the same picture in ICU occupancy, but in deaths there is a mirrored picture: little in the group unknown and a lot more in the group
unvaccinated.
This confirms my suggestion: ICU occupancy is of course also hospital, deaths of course often outside of it.
In short: nothing can be concluded from these figures.
"Nothing can be concluded at all from these figures." It rattles, but a solid dataset is not at our disposal. These are the figures that are communicated to us, so we are expected to take them in. This means that we must try to understand them, try to give them meaning. I do that here.