
Tomorrow, Thursday 20 February 2025, a debate will take place in the House of Representatives on excess mortality, a subject that we have been studying and writing about on virus varia since the summer of 2021. Let's see on Thursday whether the MPs will fall back into politicized yes/no bickering and "yes, but you said something completely different in 2020, while our party..." People really do not realize what is going on in the world and certainly in our country. They hardly know who Fauci is, how the EUA works, why RFK should have come much earlier and how vaccines are also approved in our country: preventive interventions, also intended for perfectly healthy people who are therefore . The recent CBS figures are a drama that is mitigated by the increased baseline of the RIVM. But analyses cannot be smoothed over.
Hans Verwaart shows that women under the age of 80 had higher excess mortality in 2024, 3 years after corona, than in corona year 2020. And really terrible: in the age group between 40 and 50 years old, one third more women have died than we expected... Hans explains it clearly, from start to finish.
In principle, excess mortality can occur every year. Until 2020, this could be due to a strong seasonal flu or a heat wave in the summer. The period in which this took place was always fairly limited. In the case of a heat wave, no more than one or two weeks and in the case of flu usually between four and eight weeks. And especially after a flu epidemic with excess mortality, you saw undermortality afterwards.
Excess mortality occurs if in a certain period of at least one week the actual mortality is clearly higher than the expected mortality. We also call this expectation the Baseline. Counting the number of deaths is carried out by Statistics Netherlands (CBS), takes some time but it is not a difficult job. It is a lot more difficult to calculate a reliable baseline. A good method is to look at mortality by age group and gender in a period where no strange things have happened that have had a major impact on mortality. This means that the end date of the period under consideration must be before the start of corona.
We have chosen, following for example Herman Steigstra et al and Ronald Master et al, to start the period in 2010. The width of the age group has been chosen as small as possible, namely one year. To exclude the influence of ageing and migration, we do not look at absolute mortality per age group, but at mortality per 100,000 individuals within that age group. Based on a linear extrapolation (trend) of the mortality rates per group per 100,000 in the period 2010-2019, we estimate those for subsequent years. We do not correct for undermortality (less mortality than expected) that should occur after an excess mortality wave.
The figures of 2024
CBS published on 11 February published an overview of mortality in 2024 by age. These numbers are totaled in the following table by age group of 10 years (except for the first group, which has a width of 30 years, and the last group, which includes all deceased people aged 90 years or older). The baseline (obtained using the method described above) is also included in the table for these groups. The actual mortality minus the baseline is then the excess mortality.
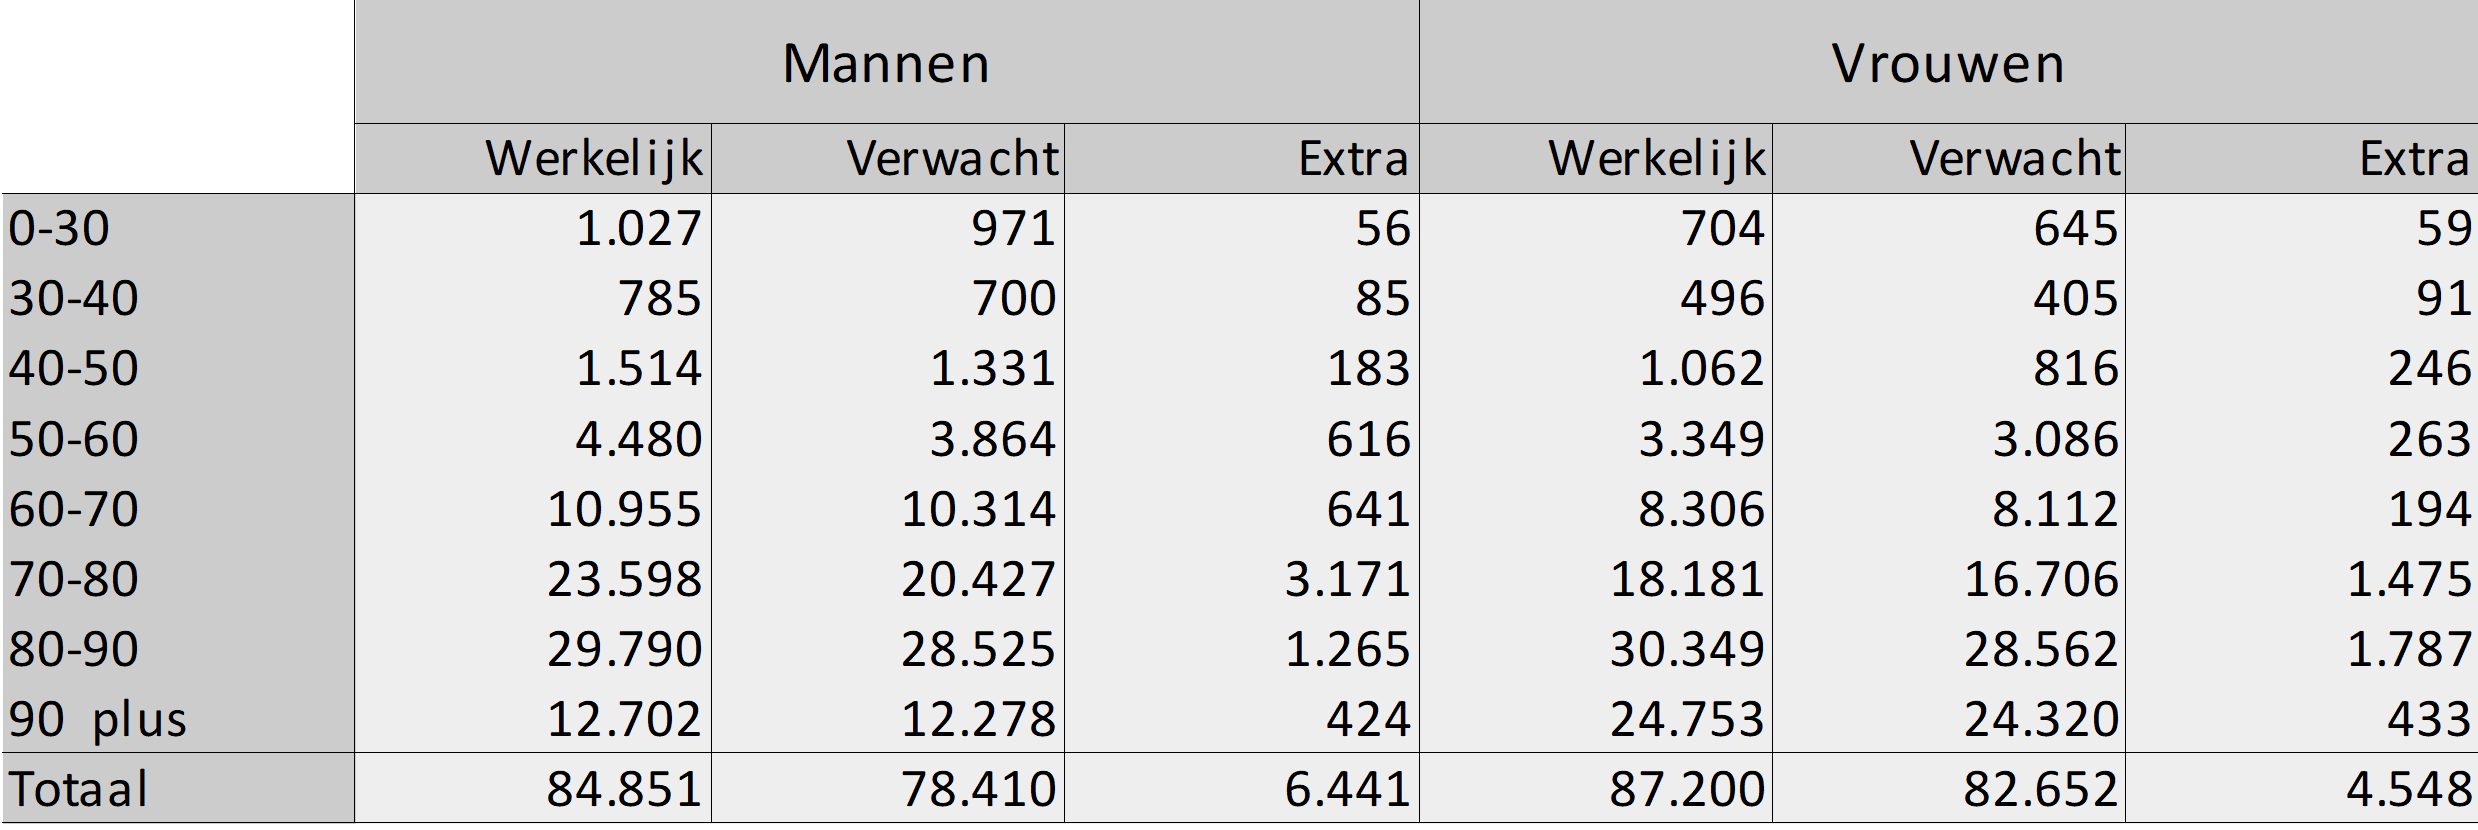
The total excess mortality is around 11,000, with most excess mortality occurring in men.
If we look at the groups, the picture does not seem to be different, because the largest excess mortality is found in men in the 70 – 80 group. Yet these absolute numbers do not say much. After all, we know that the risk of mortality increases as one gets older. That is why we are going to look at excess mortality in a different way, namely by dividing excess mortality by expected mortality.
For the group 70 – 80 for men, that calculation comes out to 3,171 / 20,427 = 15.52%. If you do the same for the 50 – 60 group, you will see the result on your calculator: 15.94%. In other words, in percentage terms, excess mortality is greater in the latter group, although the absolute number of deaths there is 5 times smaller.
In percentage terms, we find the largest excess mortality in the group 40 – 50 namely 30.15%, the second largest is the group 30 – 40 with 22.47%. Both are bizarrely high figures. In absolute terms, this concerns excess mortality of 246 and 91 cases respectively.
Looking at these figures, the conclusion is that in absolute terms, excess mortality among men is greater overall than among women, and this also applies to three groups. However, among women we find a maximum percentage excess mortality in one group that is almost twice as high as the maximum for men in one group.
Excess mortality over the years
We know that the corona waves in 2020 and 2021 caused excess mortality. Until mid-2021, this excess mortality could be easily explained by mortality due to or with Covid-19. From that moment on, the so-called "unexplained" excess mortality grew. In a normal situation, after a strong flu wave, mortality should return to normal (with even a tendency to under-mortality), but that is not what we see: excess mortality remains high. So let's compare the excess mortality of 2024 with that in the other years. We do that first for men:
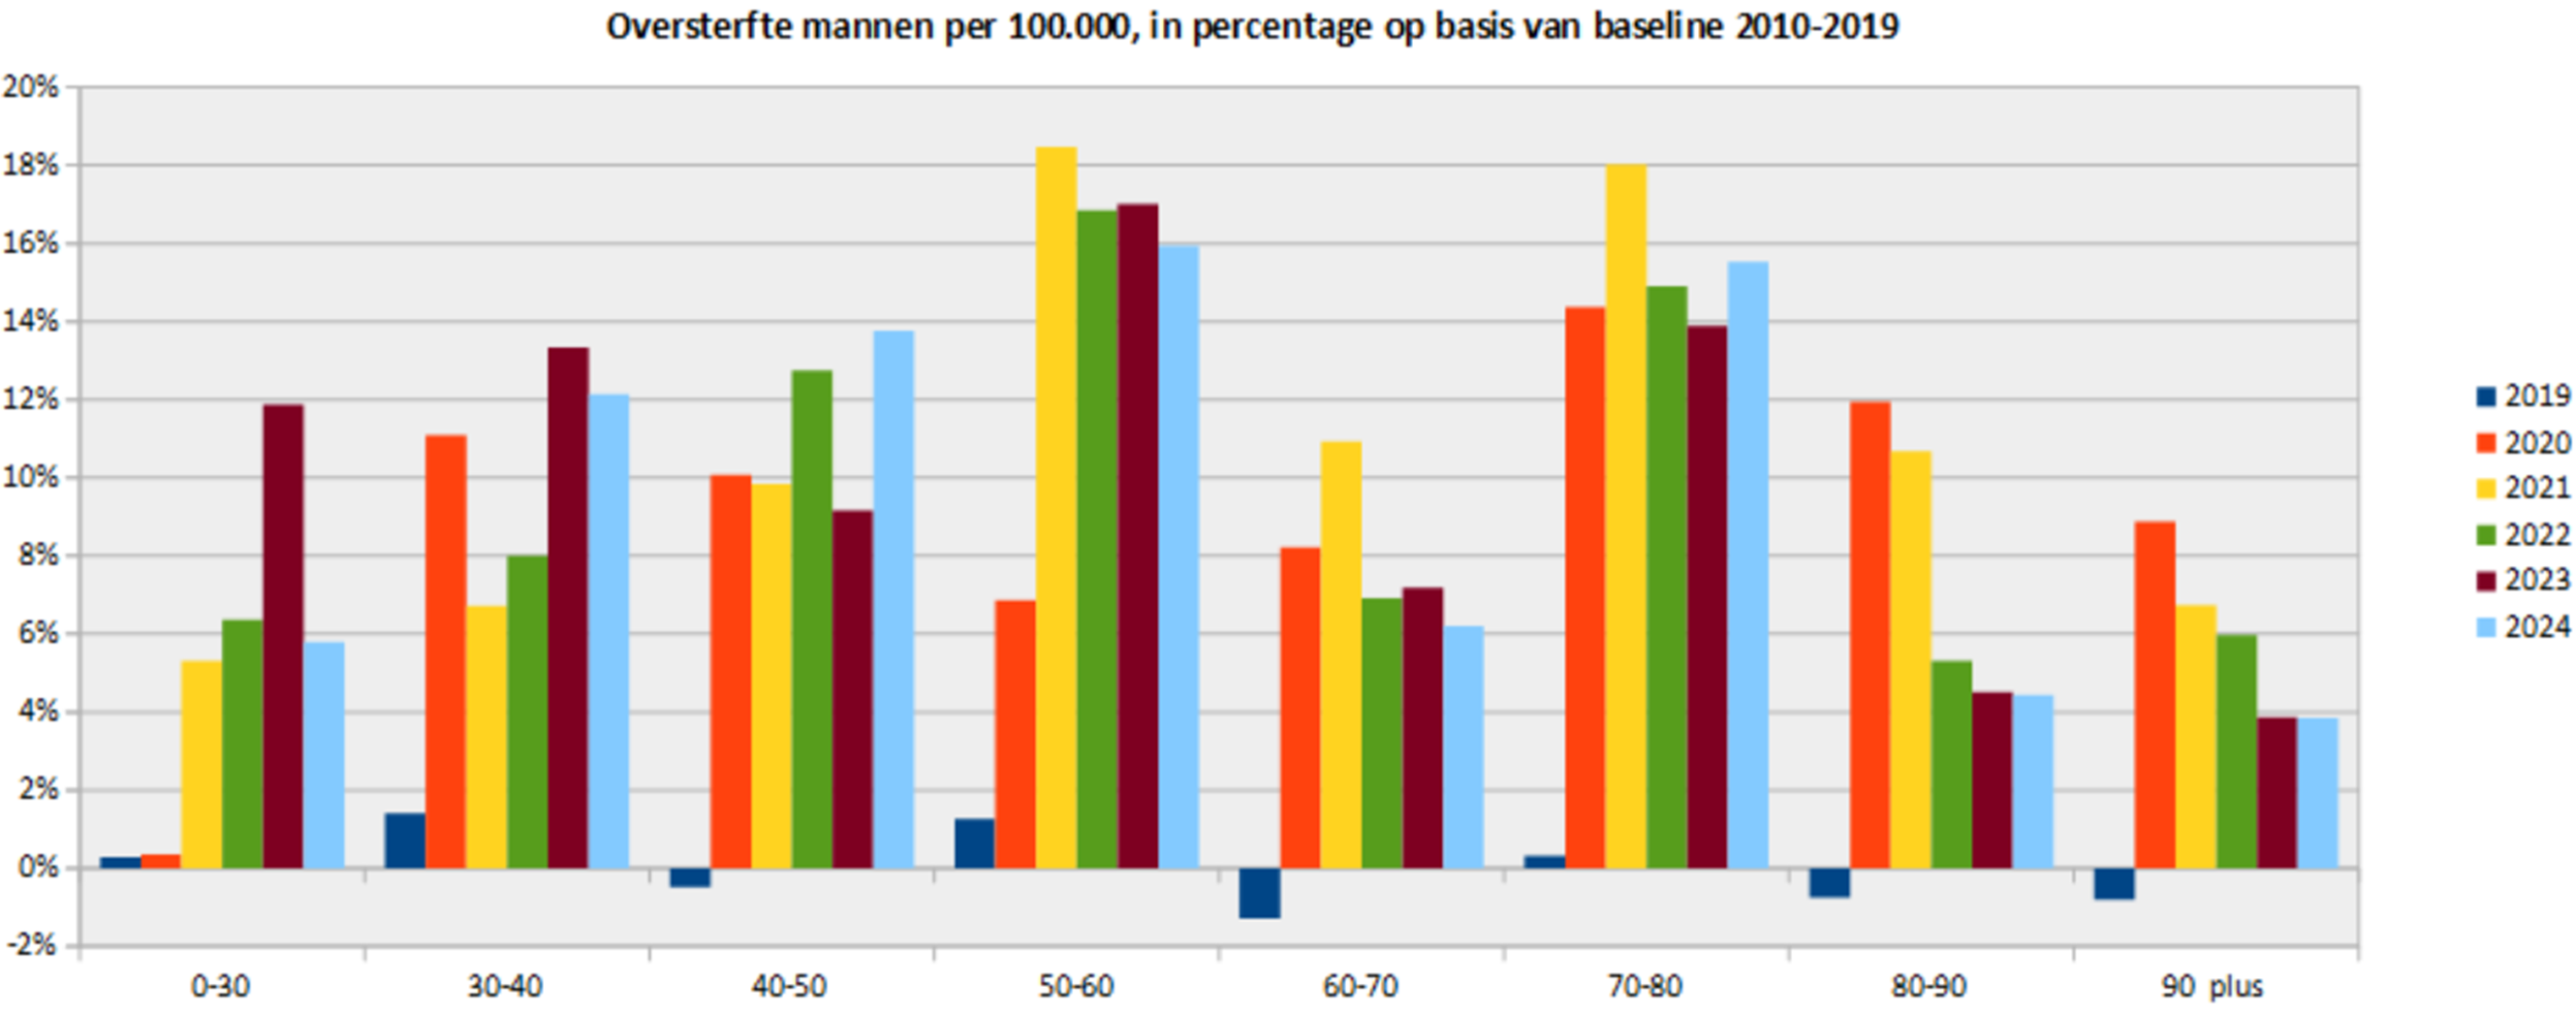
This picture shows the excess mortality among men since the arrival of corona, the measures and the vaccinations. So those are the years 2020 to 2024. We call these the corona years. For the comparison, we have also included 2019, in total there was no excess mortality, but per group we do see small pluses or minuses in the vicinity of a maximum of +/- 1.5%.
The absolute peaks in terms of excess mortality will be reached in the second corona year for the groups 50 – 60 and 70 – 80. In any case, these groups score high in several years: group 50 – 60 in four of the five corona years, group 70 – 80 even in all corona years.
In the groups under 50, however, the peaks will not be reached until or after the third corona year (2022). This indicates that Covid-19 was not the main cause of excess mortality in those years.
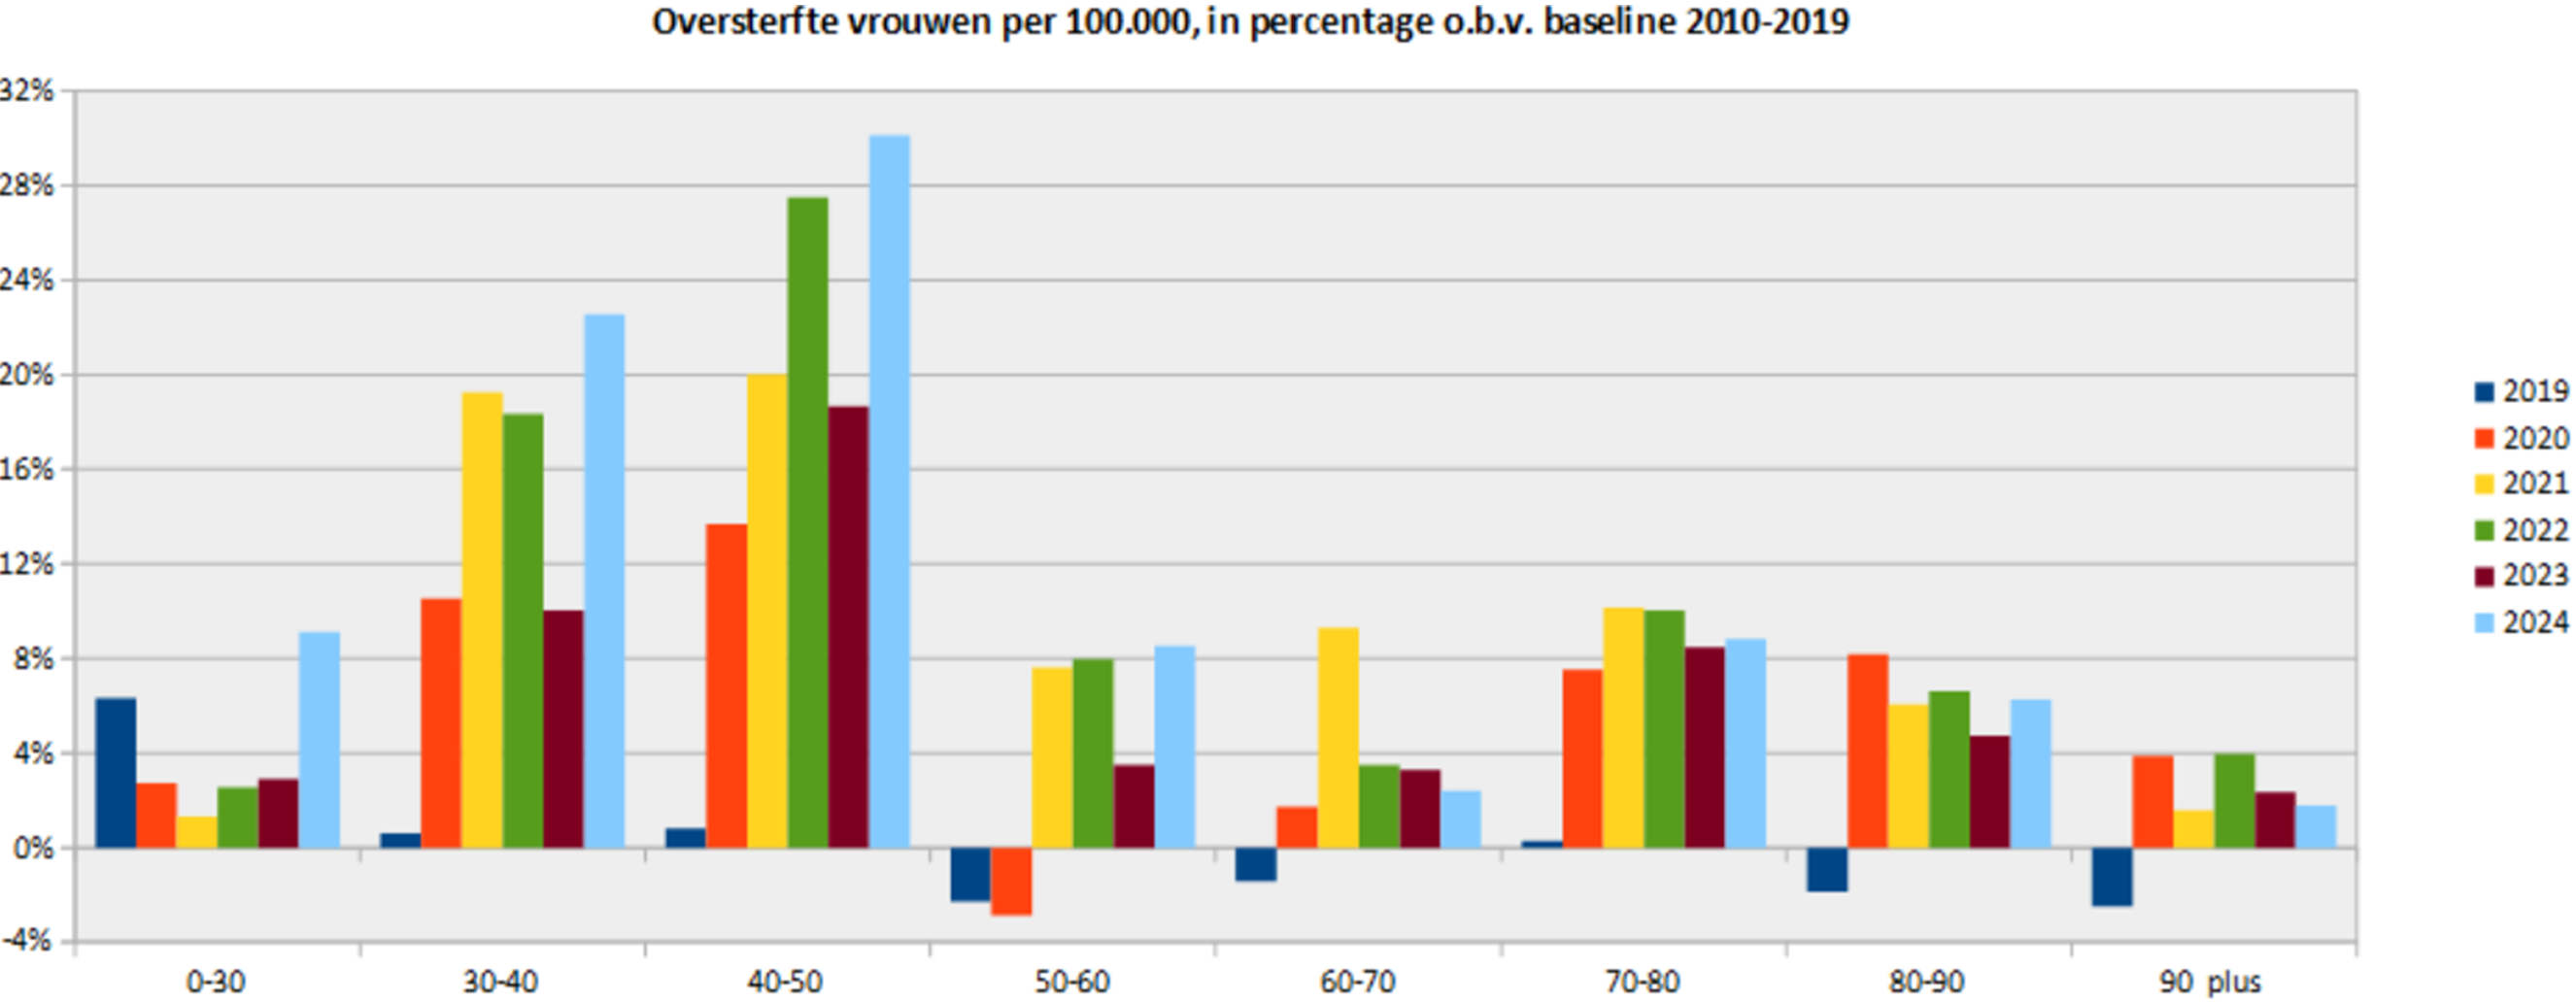
The picture for the women looks completely different. From the age of 50, excess mortality will never exceed 9% on an annual basis. And that also applies to the group under 30, but there 2024 scores relatively high compared to the other corona years. However, the peaks are concentrated in groups 30 – 40 and 40 – 50. In the 30 – 40 group, three of the five corona years score close to 20% excess mortality. That is substantial. The other two about 10%. But the 40 – 50 group takes the cake. In four of the five corona years, the percentage excess mortality is close to 20%, with peaks in 2022 to almost 28% and 2024 to over 30%, as also indicated in the previous paragraph.
In six of the eight age groups, the percentage excess mortality in 2024 is greater than that in 2023, in four of the eight groups it is even greater than that in any year.
For both men and women, the percentage excess mortality over the years has been smallest in the group 60 – 70 and 90 plus.
Is the baseline 40 – 50 correct for women well?
Now the question arises, how good is the baseline for the 40 – 50 group for women, where there is 30% excess mortality? We will investigate that in this section. For an article elsewhere we had already made the following pictures up to 2022, now we add the years 2023 and 2024. It concerns mortality per five-year group 40 – 45 and 45 – 50. The pictures look like this:
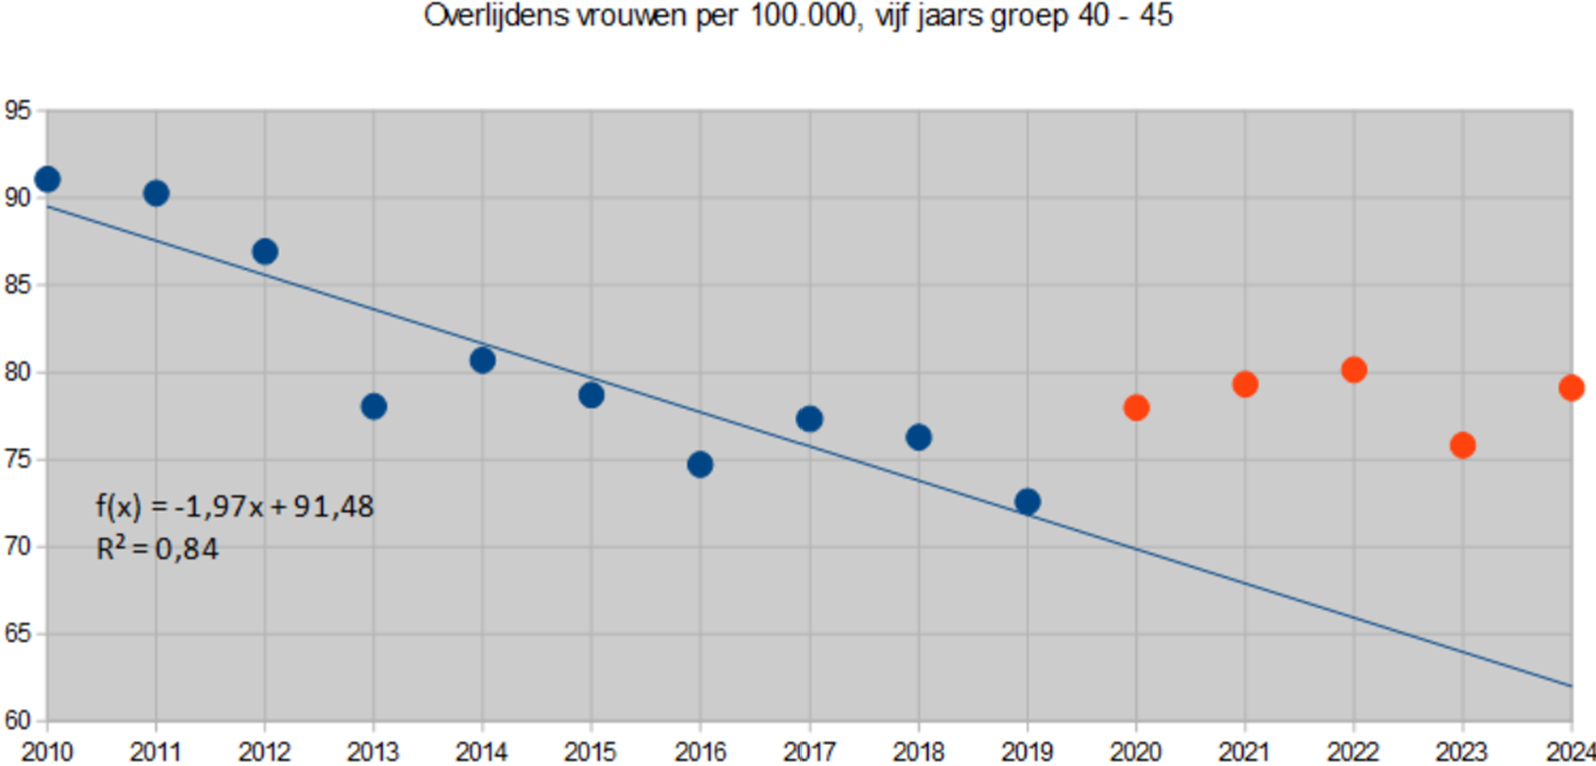
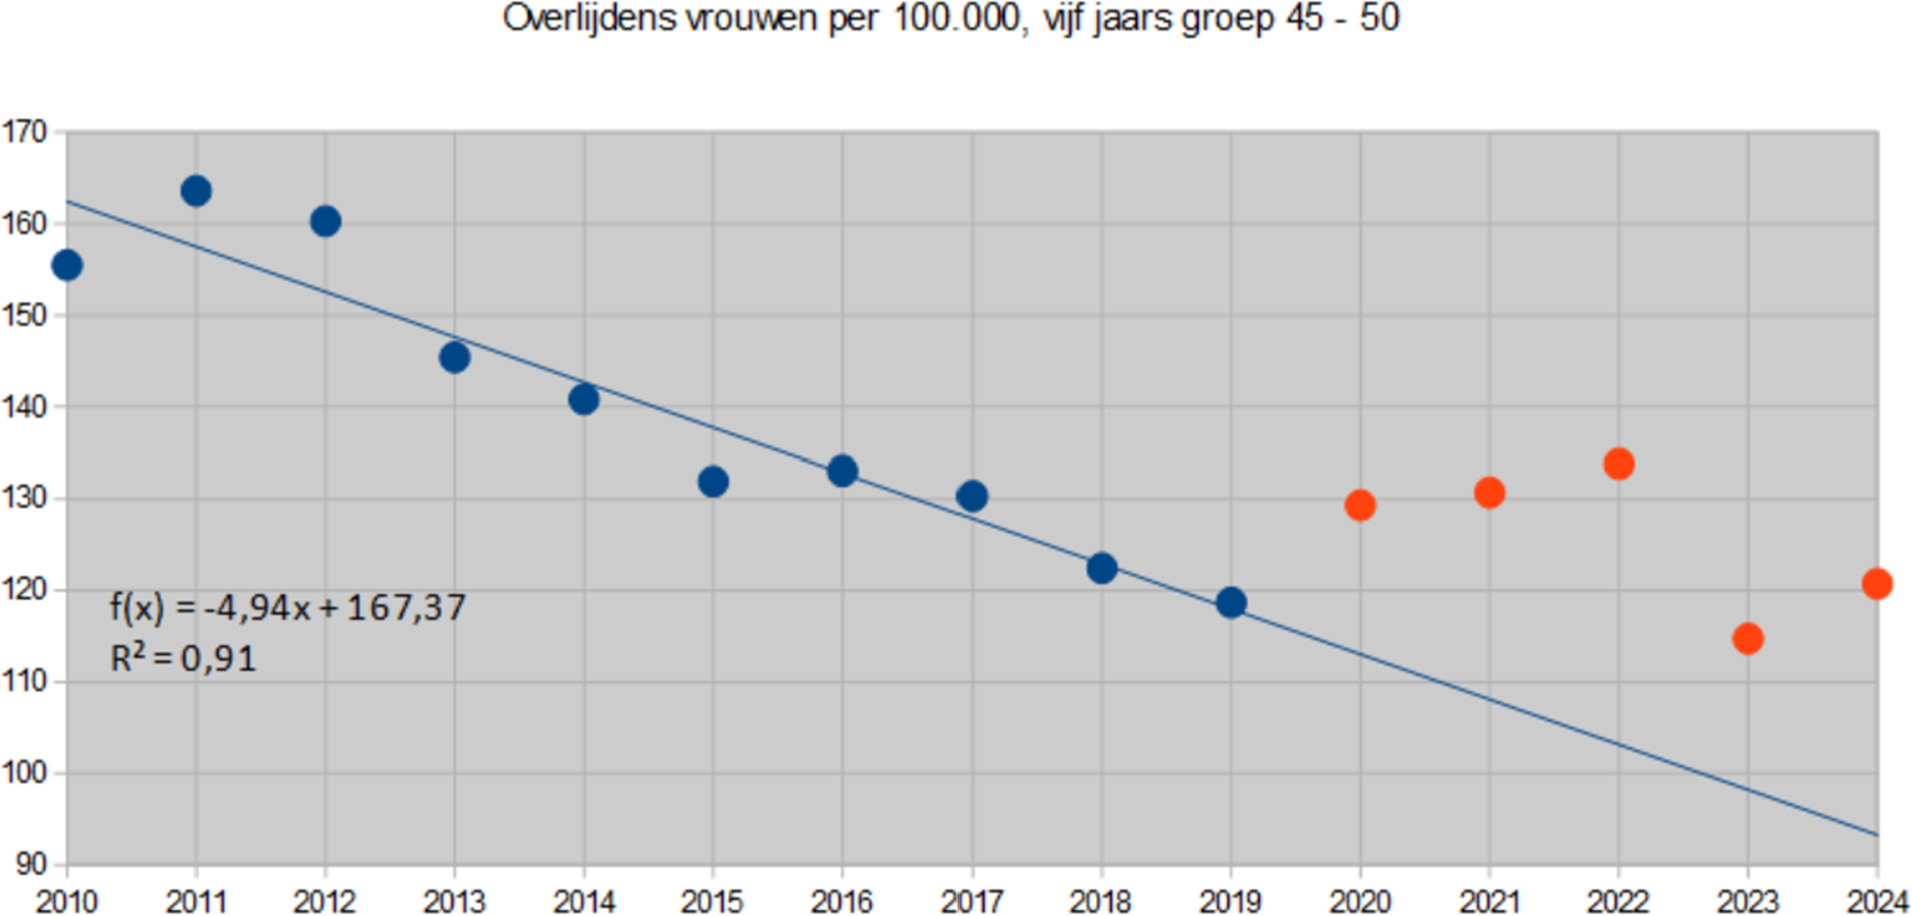
Both graphs show that there were clear health gains in the period 2010 – 2019. R² is a measure of the reliability of the linear regression line, which is the thin blue line. R² can vary between 0 and 1. The lower, the less correlation and the higher the more. An R² of 0.84 and 0.91 respectively indicates that the reliability of the regression line is high. This means that there is a good chance that in a normal situation mortality in 2020 to 2024 will be close to the blue line. The blue line thus forms a good and reliable baseline for determining excess mortality.
Both graphs show that the actual mortality in the years 2020 to 2024 (the red dots) will be clearly above the baseline. The distance between the red dots and the baseline is greatest for the years 2022 and 2024. This is also reflected in the percentage excess mortality as discussed in the previous section.
It is possible that the application of a non-linear extrapolation could lead to a baseline that is slightly higher in the period 2020-2024, with the largest increase occurring in 2024. Perhaps the percentage excess mortality will not be 30% but 25 or even 20%. But even that is still far too much. We therefore recognize that non-linear extrapolation could potentially lead to lower percentage excess mortality (edit 24-02-2025: we calculate that here through). However, we see no reason to revise our baseline.
Our goal is to draw public attention to excess mortality, in order to identify and eliminate the causes through continued research. The excess mortality of 30% in women aged 40 – 50 is another signal that something is really going on.
Conclusions
Although the number of deaths from Covid-19 has shown a sharp downward trend since 2022, there is still excess mortality in the Netherlands for the fifth consecutive year, which has not happened before in history. The part "unexplained" continues to increase.
Overall, excess mortality among men will be greater than among women in 2024. However, this is different for each age group:
- For men, the percentage is highest in group 50 – 60, almost 16%;
- For women, this is more than 30% in the 40-50 group.
The conclusions mentioned above make clear the need to continue and expand the research on the "unexplained" excess mortality to include ALL possible causes and not just post-covid, delayed care or lockdown stress.
Once read as an assignment motto in the front of a textbook:
" A book is like a mirror: if an ass looks in, no apostle will look out"
( after : Georg Cristoph Lichtenberg)
Mutatis mutandis, this also applies to the above article and the possible reaction of Members of Parliament
Last Sunday I heard during the broadcast of Marianne and Maurice that Pieter Omtzigt has a solid list of questions for the excess mortality debate on Thursday. 🤞 Here and there a few in politics who want to change something, it was said hopefully and substantiated with some examples. Once, someone close to me wanted to move one of the largest ships in the world a meter and was thwarted considerably. They wanted to change everything, the quay, the moorings, etc., so as not to admit that the ship could move a meter. The ship has moved up. There was no thank you, but the procedure was recorded. Persistence wins! So thank you again for this article. Has anyone noticed how mortality is normalized in the msm? And also diseases such as young women with cancer. (These women do not (yet) count in the figures above...). Or a headline above an article "my boyfriend has a brain tumor: if only I had arranged a safety net sooner" "Duo euthanasia is romantic..." . Cringe-worthy when people are peddling all kinds of pathetic anecdotes in politics that suit them. Mrs. Tielen has managed to call a mother of a child who died from a vaccine 'an incident' to her face, but supports, among others, Mrs. Tielen. Paulusma her anecdotes for the cameras in the House of Representatives. I may watch tomorrow's debate later...
Zie refenties
Death
• Lee B, Song H, Apio C, et al. An analysis of the waning effect of
COVID-19 vaccinations. Genomics Inform. 2023; 21(4):e50.
doi:10.5808/gi.23088
• COVID Jabbed Face 37% Reduced Life Expectancy and Higher All-
Cause Death Risk Compared to Unjabbed: Journal ‘Microorganisms’
• Alessandria M, Malatesta GM, Berrino F, Donzelli A. A Critical
Analysis of All-Cause Deaths during COVID-19 Vaccination in an
Italian Province. Microorganisms. 2024; 12(7):1343. Published
2024 Jun 30. doi:10.3390/microorganisms12071343
• ‘High Likelihood of a Causal Link’
—Not Just Correlation—Between
COVID Jab and Death: New Peer-Reviewed Study
• Hulscher N, Alexander PE, Amerling R, et al. Withdrawn: A
systematic review of autopsy findings in deaths after COVID-19
vaccination. Forensic Sci Int. Published online June 21, 2024.
doi:10.1016/j.forsciint.2024.112115
• 3% of COVID-19 Jab Recipients Die: Journal ‘Informatics in Medicine
Unlocked’
• Al-Rousan N, Al-Najjar H. Evaluation of the effects of MERCK,
MODERNA, PFIZER/BioNTech, and JANSSEN COVID-19
vaccines on vaccinated people: A metadata analysis. Inform Med
Unlocked. 2024;49:101564. Published online July 30, 2024.
doi:10.1016/j.imu.2024.101564
• ‘More Than 3 Million Excess Deaths Since 2020’: Mainstream Media
Finally Admit COVID Jabs ‘May Have Helped Fuel Rise’ in Excess
Mortality
• Saskia Mostert, Marcel Hoogland, Minke Huibers, Gertjan
Kaspers – Excess mortality across countries in the Western World
since the COVID-19 pandemic: ‘Our World in Data’ estimates of
January 2020 to December 2022: BMJ Public
Health. 2024; 2:e000282
7• ‘17 Million’ COVID-19 Vaccine Deaths Worldwide: Physicists,
Microbiologist for ‘CORRELATION Research in the Public Interest’
• Rancourt DG, Baudin M, Hickey J, Mercier J. COVID-19 vaccine-
associated mortality in the Southern Hemisphere. CORRELATION
Research in the Public Interest. Report. September 17, 2023.
Available at: https://correlation-canada.org/covid-19-vaccine-
associated-mortality-in-the-Southern-Hemisphere/.
• ‘Autopsy Findings in Cases of Fatal COVID-19 Vaccine-Induced
Myocarditis’: Journal ‘ESC Heart Failure’
• Hulscher N, Hodkinson R, Makis W, McCullough PA. Autopsy
findings in cases of fatal COVID-19 vaccine-induced
myocarditis. ESC Heart Fail. Published online January 14, 2024.
doi:10.1002/ehf2.14680
• 80% of Deceased COVID-Infected Patients Are Vaccinated—Only 20%
Are Unvaccinated: Journal ‘Antimicrobial Stewardship & Healthcare
Epidemiology’
• Helanne H, Forsblom E, Kainulainen K, Järvinen A, Kortela E.
Incidence and outcome of hospital-acquired COVID-19 infections
in secondary and tertiary care hospitals in the era of COVID-19
vaccinations. Antimicrob Steward Healthc Epidemiol.
2023; 3(1):e216. Published 2023 Nov 30. doi:10.1017/ash.2023.489
• COVID-19 Jab Plays ‘Causal Role’ in Seizure Deaths: Journal
‘Academic Forensic Pathology’
• Prahlow JA. Deaths Related to New-Onset Seizures After
Vaccination. Acad Forensic Pathol. Published online November
24, 2024. doi:10.1177/19253621241297029
• ~278,000 Americans May Have Died From the COVID-19 Vaccine by
December 2021: Journal ‘Science, Public Health Policy and the Law’
• Skidmore M. COVID-19 illness and vaccination experiences in
social circles affect COVID-19 vaccination decisions. Sci Public
Health Policy Law. 2023; 4:208-226
• ‘COVID-19 Vaccination Uptake in Europe Has Led to Increasing 2022
All-Cause Mortality’: Journal ‘Asian Pacific Journal of Health Sciences’
• Aarstad J, Kvitastein OA. Is there a link between the 2021
COVID-19 vaccination uptake in Europe and 2022 excess all-
cause mortality? Asian Pac J Health Sci. 2023; 10(1):25-31.
doi:10.21276/apjhs.2023.10.1.6
• Risks of COVID Vaccines and Boosters Outweigh the Benefits in
Children, Young Adults, and Older Adults With Low Occupational Risk
or Previous Coronavirus Exposure: ‘ResearchGate’ Preprint
• Pantazatos SP, Seligmann H. COVID vaccination and age-
stratified all-cause mortality risk. Preprint. October 2021.
doi:10.13140/RG.2.2.28257.43366/1
• ‘Deaths Related to New-Onset Seizures After Vaccination’: Journal
‘Academic Forensic Pathology’
8• Prahlow JA. Deaths Related to New-Onset Seizures After
Vaccination. Acad Forensic Pathol. Published online November
24, 2024. doi:10.1177/19253621241297029
Mooie referentielijst, dank! Deze kan er ook nog bij:
Excess all-cause mortality in 21 countries during 2022: COVID-19 impact by C-MOR project
https://pmc.ncbi.nlm.nih.gov/articles/PMC11516149/
Dear Anton, I have made a "meta analysis" of your articles on this subject, maybe it will be of use to you:
https://1drv.ms/w/c/13426ae541632a0a/EU55UrFLAixJm6_vc0xmaj0BznbkUCIp6XAvVsNug9nfuA
Sincerely,
And then there are people who stubbornly and with dry eyes claim that the side effects of mRNA Gene Therapy do not actually exist.
In the debate, the elephant in the room will be carefully avoided. I don't doubt that for a moment. Because we know what the problem is: it is the aftermath of postponed care.
Supplemented by the unvaccinated and those who did not get the boosters.
No matter how much other evidence is presented, the experts have spoken thus.
In other words, I expect nothing more from our administrators than what has been shouted all along.
And it only gets more embarrassing....
Genuine?
Vaccinazis
The plan worked out perfectly, the population has to decrease according to Bill and so it decreases. Women between 30 and 40 seem to have had a priority, the desire to have children is also increasingly later.
And a debate is not going to stop anything, especially not by minkukels like our government, if it is not a vaccination then it will be food or pesticides with which they will further stimulate excess mortality.
You would think that road deaths are also a means, but they want to combat that with higher fines, so that revenue model is not affected.
You wonder if Government is not a synonym for Thief and Criminal.
After all, the regulations cause a lot of misery again and again and solve nothing, children taken away from their parents, suicide attempts are the order of the day among victims of the government.
Good article, deserves all the attention and has my attention.
This Dutch publication (very recently published) has done a similar analysis, see https://pmc.ncbi.nlm.nih.gov/articles/PMC11742297/
Analysis plan in brief: using CBS microdata (individual data) to look at excess mortality in the years 2020-2021 compared to 2019 (with a sensitivity analysis using the period 2015-2019 as a baseline). Then all kinds of stratified analyses on age and gender (similar to the above), but also on immigration background, urbanization, income (socioeconomic status) and corrections in a multivariable model (on age, gender, urbanization, etc, where relevant).
What I get out of it is this: see table 2. Excess mortality is present for all ages, with the exception of the 0-19 year olds (not vaccinated and hardly admitted to hospitals, except possibly for the neonatal period, but there no hospital protocols other than 'normal')). These are small numbers (cave), but suggest, as also mentioned above, that mortality in all age groups would 'normally' continue to decline in 2020 and 2021, but 'covid'.
Excess mortality is a problem in 2020 (relatively speaking) among the elderly (hospital protocols that did not work, see my covid pulmonary embolism story at BVNL), and in 2021 (relatively speaking) among young people (introduction of mRNA elixirs).
Stratification by age, gender, immigration background, urbanization, income shows that excess mortality is present in all these groups (minus the 0-19 year olds). There is a possible outlier: first-degree immigrants. I wouldn't pay much attention to that myself. It is a (relatively) small group, it does not explain the total excess mortality and.... it tends towards racism.
Auteurs zien dit anders, gaan de diepte in en melden (ik citeer): ‘Regarding immigrants’ countries of origin, people who originated from Indonesia and Morocco had a significantly higher excess mortality. For immigrants from Suriname, the Dutch Caribbean, and Turkey, estimates higher than 10% excess mortality were observed as well. Immigrants from western Europe experienced excess mortality similar to the native Dutch population, which also held true for immigrants from central and eastern Europe.’
En verderop: ‘Here, we show that the excess mortality was highest for first-generation immigrants (after full adjustment, including age and sex) but that the second-generation immigrants’ excess mortality during COVID-19 was largely similar to that of native Dutch. We also show that the high excess mortality among first-generation immigrants cannot be explained by their generally lower household income and that excess mortality was highest among people with their origin in Indonesia, Morocco, Turkey, Suriname, and the Dutch Caribbean islands.’
En hier hun uiteindelijke conclusie: ‘Future research will focus further on the identification of vulnerable groups in the population which were affected the most by the COVID-19 pandemic. Future research will focus further on the identification of vulnerable groups in the population which were affected the most by the COVID-19 pandemic. It should also uncover the mechanisms that explain why certain groups, such as first-generation immigrants from particular countries of origin or lower-income individuals, had significantly higher risks of excess mortality during the pandemic.’
I think it is really a deeply tragic conclusion with which authors, certainly unintentionally, let their real finding (there was excess mortality in the Netherlands in the 20s and 21s in all walks of life) be snowed under by means of an in-depth analysis about the Turks, the Moroccans, the Antilleans, and thus let the nonsense of the sentence prevail up to their conclusions.
I also think it's an all-around dangerous conclusion, for the reason that you can't/shouldn't expect politicians to be able to interpret a scientific piece scientifically, but they can make it political, especially by emphasizing ... first-degree immigrants who come from outside Europe and who, according to the scientific authors of this piece, should be given FULL attention.
We'll see tomorrow...
Working in healthcare in the early 80s, I was almost fired because of the observation that there is a difference in medicine (including medication) in microbiome, among other things. Instead of helping people, I would be a racist and look down on people with a lower income etc. Now it may be said, written and cast in a model, but clearly not with good intentions or no good intentions come of it. Everyone has equal human rights, but we cannot be medically lumped together. Progressive insight is a rarity, unfortunately. First all children had to go to the (goat) farm to prevent allergies (hygiene model) and now farms are a thorn in many people's eyes/lungs... I recommend "Asterix and Obelix in the house where you go crazy". Comes from the story of the tests. That ends well for Asterix and Obelix.
https://pmc.ncbi.nlm.nih.gov/articles/PMC8923115/
Might be interesting in this context
Wasn't that known all along? Especially obese immigrants. Vitamin D deficiency due to dark skin color. Maybe also something with a different gut biome. I think it would be good to map that out. Of course, it is only a partial aspect.
Yes, that's right, it became known to Jinek when ICU doctor Peter van der Voort spoke past his mouth and Diederik Gommers confirmed it in layman's terms. Before that, we already knew from the field what cost people their jobs when they talked about it. A professor from the wur also spoke in a talk show about vit.D. He probably had a very tough conversation with his employer because after that there was no longer any conversation possible with the man... What terrible times with all that suffering caused. Take care of yourself!
And to think that the coronavirus was almost certainly made in a gain-of-function laboratory, by the same (kind of) scientists who make the vaccines for Big Pharma.
In the hands of the military, intelligence services, ignorant politicians and scientists with conflicts of interest, a very deadly mixture has been created that has been poured out over the world.
It still makes me nauseous.
Yet I still don't believe it was a deliberate conspiracy. I think it's a chain reaction of stupidities, lies, cover-ups, street cleaning and opportunism.
Still, I am very happy that there are still courageous people like the writers of this blog, who keep trying to get the truth out. I hope that eventually there will be a worldwide ban on making and experimenting with laboratory viruses. If we hadn't had GOF laboratories, we probably wouldn't have had a corona crisis at all.
Thank you very much for this analysis.
The "gigantic" excess mortality has only one cause: The erroneous baseline.
In the last 3 years, mortality has been the same as in the previous 3 years. The excess mortality is becoming extreme due to the sharply declining baseline.
With this extrapolation, no women between the ages of 30 and 50 should die in 30 years.....
That is also stated at the end of the article. There is certainly a curve in the line but it is very slow. To see that properly, you have to look at a much longer term.
It also makes a difference in the few years we are talking about here, but even if you do your best with a 'friendlier' baseline: the percentage remains unacceptably high.
By the way, you also end up in a discussion about how exactly that curve should run, how long do you take the term, on which year do you start and end. Some want to exclude for years, others don't... But you really don't correct this away.
How exactly that curve should run is actually not that important*, such extrapolation is not an exact science, just as the linear extrapolation is not an exact science.
So slowly, 5 years after the start of the pandemic (and the beginning of the extrapolation), there is no escaping it – and that has indeed already been expressed with "Perhaps then the percentage excess mortality will not be 30% but 25 or even 20%."
By actually drawing such lines and clearly displaying them, that word "perhaps" can be omitted, and unnecessary criticism of such excellent articles can be avoided.
*I am curious about good suggestions for what kind of line functions seem most suitable for another 5 years more extrapolation (from 2000 or 2005?). And maybe that has already been discussed in the literature?
Theo, I just received a response by email that you probably wanted to post here. You write:
"The mortality rates are not significantly higher. So no 20, or 25%, but no excess mortality!
The curve, or line, is all-important and at least debatable.
The line was chosen to get the desired outcomes.
Exactly the method that Herman Steigstra uses."
This method is explained in detail in the articles referred to. You will have to be a bit better prepared.
I would say: show me. Make a plausible and substantiated curve that will lie on the red points. Maybe it's reassuring. (Note that this method must also apply to the other cohorts.)
We shouldn't make it more difficult than it is.
The mortality rates of the last few years are comparable to the years before (even with those in the corona period). They are even significantly lower than those of 10 years ago.
So no reason for the fuss made in this article solely on the basis of the chosen baseline.
Again, look at the mortality rates!
This same point has already been discussed in recent comments (including the article of 7 February); Life expectancy increased steadily until the pandemic and no doubt that is related to what is discussed here.
At the beginning of the pandemic, CBS indicated that we could expect life expectancies to bounce back to that previous trend, see again here:
https://opendata.cbs.nl/#/CBS/nl/dataset/84883NED/line?ts=1733052911887
There was apparently (and logically) no reason to expect that the general increase in life expectancy would suddenly stop, coincidentally just during the pandemic.
Now I don't know how the relationship between the CBS life expectancy curve and the mortality probabilities is mathematically, but I assume that a dead straight extrapolation does not fit well with that slightly curving CBS line and that perhaps something can be done with it.
Sorry mistake: I meant in the article of February 5 (The art of predicting).
I share the doubts about policy and vaccines, but this article does not convince me. First, you use a reference time of 10 years (2010 – 2019), and then extrapolate 5 years (2024) from there. I once did some calculations on this, and it turned out that it is possible to extrapolate for 1 or 2 years, but after that the results can diverge sharply. Second, you use a linear regression. There is no change from an increasing to a decreasing trend and v.v. In my calculations (reference period 2000-2019) with a 2nd degree polynomial, the expectation and reality were much closer to each other until 2023. But even in this case the limit for extrapolation now seems to have been reached...
I share the distrust of the policy and the vaccines, but this article does not convince me. First, the 10-year reference period (2010-2019) is too short to extrapolate another 5 years – after 2 or 3 years, the results become too unreliable. Secondly, the linear regression is too crude, because it cannot describe a reversal from an upward trend to a downward trend and vv.
In my own calculations, I had a reference period of 20 years (2000 – 2019) and a 2nd degree polynomial. The expectation and the outcome were always much closer to each other than with Steigstra et al. But even for me, the limit of extrapolation seems to have been reached after 5 years.
I've been too lazy to check it out exactly (sorry), but it is a fact that the mortality rate for all ages has been decreasing in the Netherlands for years until the magical year 2020.
The group that came into contact with 'covid protocols in the hospital' the least/last was the youth (because the youth hardly suffered from serious illness/covid diagnosis requiring hospitalization. On the other hand, the youth were only last and partly not injected with the mRNA elixir (at the end of 2021 if I remember correctly)
You would therefore expect that the mortality risk among young people would continue to decrease in 2020 and 2021 and that is also the case according to this publication referring to CBS data
https://www.nji.nl/cijfers/overlijden-kind#:~:text=Ondanks%20de%20stijging%20in%202022,1992%20tot%201.061%20in%202022.
It was not until 2022 that a kink in mortality probability was also seen among young people, which, in my opinion, can be fully explained by measures, vaxx and psychological suffering (tgv measures).
I quote: 'Compared to 2021, the total number of deceased children and young people aged 0 to 20 has increased: from 1,001 in 2021 to 1,061 in 2022. The largest increase was seen among young people aged 15 to 20 years. The total number of young people who died rose from 179 in 2021 to 248 in 2022. In particular, the number of suicides in this age group has risen sharply from 42 young people in 2021 to 65 young people in 2022.
Despite the increase in 2022, there has been a decrease in child mortality over the past 30 years. The number of children who die has decreased from 2,261 in 1992 to 1,061 in 2022. In the first year of life, the number of children who died fell from 1,235 in 1992 to 540 in 2022 (Statistics Netherlands, 2024).'
In other words and (admittedly) with a twist (because small numbers and what applies to the youth also applies to the elderly), I conclude that it is entirely plausible that the 'crooked line' from 2020 is not natural but has been induced by humans: on the one hand by introducing Covid protocols, on the other hand by vaccines.
Of course, this does not prove anything, but it is true that based on all the data taken together, the burden of proof that measures and vaccinations have saved lives lies with those who have always made this claim: doctors, scientists and policymakers. That seems to me to be a fair conclusion. Yet it remains silent...
I think you have a point, Bert, although we still think that the differences are not very meaningful. It is of course true that we once started with this linear calculation, but the reference gap is slowly getting so large that we may (also) have to look at a polynomial to avoid these kinds of objections. Theo also hinted at it in comments above. But you have calculated: what percentages do you end up with, for women aged 40-50?
I have done my best to make a polynomial that minimizes the excess mortality in 2024 and still looks plausible compared to the 10 previous years. Winter 2018-2019 had 2,900 excess mortality, let's assume that this group did not play a role in this.
Even then, with this creative line, we are still left (for this group) with 5 consecutive excess mortality years and 15% excess mortality for the last red dot. That is not right. So the point of this article remains valid as far as I'm concerned.
After the corona mortality, there should have been undermortality.
It is very worrying that in the years after the mass vaccination campaign, there has still not been a period of undermortality.
For the period 2000 – 2019, I have only mapped the relative mortality for the group of women 40 – 49 years,
Made a 2nd degree polynomial of it, and extrapolated for the years 2020 to 2023. I don't have any mortality details for 2024.
To my own surprise, I come to the same conclusion as you:
Expressed as (actual mortality)/(expected mortality), reduced to a percentage, I get:
2020 excess mortality 9.5 %
2021 excess mortality 13.2 %
2022 excess mortality 17.6 %
2023 excess mortality 7.6 %
This is therefore about the extent to which mortality deviates from mortality as predicted on the basis of the polynomial.
It is important to know that within the reference years, the deviation varies between -3.2% and + 5%.
(Results subject to change – this was only an hour of calculation, without deep checking)
So there does indeed seem to be something going on with this subgroup.
Great Bert, thank you.