In this piece are previously found proportions in the United Kingdom applied to the Netherlands. No light cost but again a very urgent call for release of relevant data, so that independent and thorough research can be carried out so that we can work with solid material. But whichever way we look at it, there is no escaping vaccinations as a possible (co-)cause of excess mortality.
In recent weeks, we have calculated vaccine effectiveness for protection against Covid-19 and other causes of death in the UK for the period April 2021 β December 2022. This approach has now also been applied to the Dutch situation on the basis of the English figures.
For the Dutch situation, we look at the period July 2021 β December 2022. So we skip the first three months, the reason for this is that in the Netherlands the speed of vaccination was not that high in the beginning, so there was a lag behind the UK. This was later caught up, but the period up to July 2021 is therefore not usable to draw conclusions and has therefore been omitted from the calculations and graph for the Dutch situation.
The following steps have been completed:
- The starting point is the mortality among unvaccinated English people per month;
- Using data on vaccination coverage (defined as ever vaccinated) per day, it was calculated what mortality can then be expected per month among vaccinated people (under the assumption that vaccination does not affect mortality);
- The expected mortality is compared with the actual observed mortality among vaccinated people. The quotient of actual mortality and expected mortality is called the factor Q (Q is therefore actual mortality divided by expected mortality).
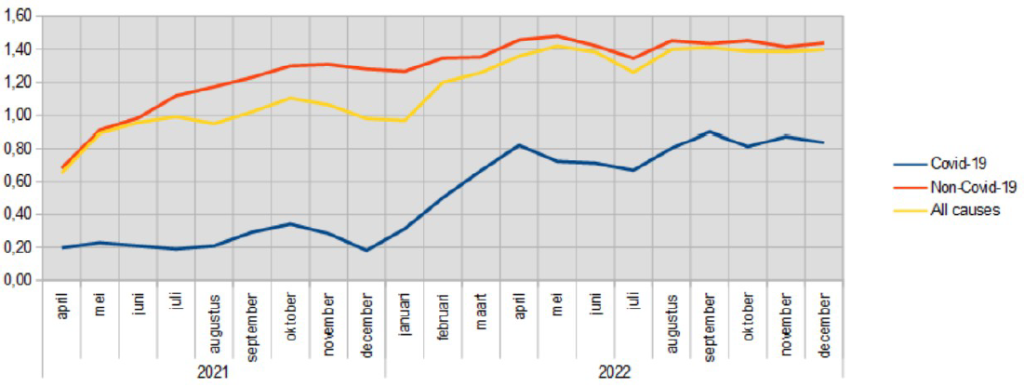
Calculation example: Suppose 600 unvaccinated people have died. After the groups have been made arithmetically the same size, the same mortality rate 540 vaccinated people had died, which is the expected number if both groups had been the same size. Then the simple division is: "540 divided by 600" and the result is 0.9. Lower than 1 therefore means: benefit for the vaccinated. - This results in a graph with the value of Q over time on the Y-axis. In England, we see that if we look at protection against Covid-19 as a cause of death, Q is below one over time, with an upward trend (2021 around 0.2 β 2022 around 0.8). However, if we look at all the causes of death, we see a line that soon rises above one and peaks in 2022 and more or less stabilizes around 1.40. This means that for every 10 deaths in the unvaccinated group, we see 14 in the vaccinated portion per the same group size.

If the vaccine has no effect, then the value of Q is equal to one. If it has a positive effect, then the value of Q is less than one. The closer to zero the better. However, if Q is greater than one, the vaccine has a negative effect. This picture comes from an analysis of the data from the UK. For the Netherlands, as explained above, we will look from July 2021.
The analysis is now complemented by:
- It is assumed that the course of Q in the Netherlands is similar to that in England. With this course we can determine what can be a possible distribution of vaccinated or unvaccinated deaths in the Netherlands.
- To this end, we still have to take into account the lower vaccination rate in the Netherlands. It is believed to be 90% of the vaccination rate in England. A lower vaccination rate means that the numbers of unvaccinated deaths will rise and the actual and expected numbers of vaccinated deaths will decrease.
- We must also correct for the fact that the English population is more than three times as large as the Dutch population and there are also demographic differences. We did this by comparing the mortality per month and total for the entire period for both countries.
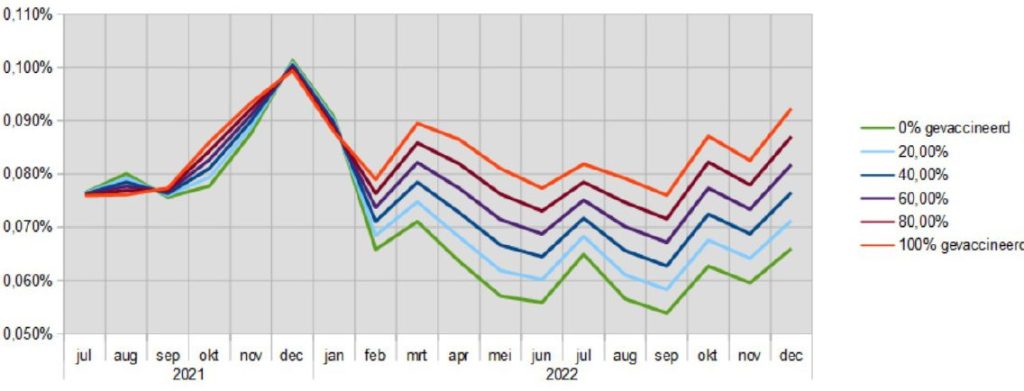
In this comparison, we only look at "all cause mortality" (all causes of death combined). First of all, let's look at the mortality rates of the two groups. From July 2021 to January 2022, they hardly seem to avoid each other. From February 2022, they will diverge sharply, as the following figure shows:

You will also get these percentages if you assume 0% vaccinated (for Unvaccinated) and 100% vaccinated (for Vaccinated). Now we can also calculate what the mortality rates would be with an arbitrary vaccination rate. In the following figure these are added for 20% / 40% / 60% / 80%:

What we're seeing is that the higher the vaccination rate, the higher the death rates are, particularly in 2022. Now, of course, the question comes into play: does a higher vaccination rate also result in excess mortality?
To what extent is vaccination coverage a factor in excess mortality?
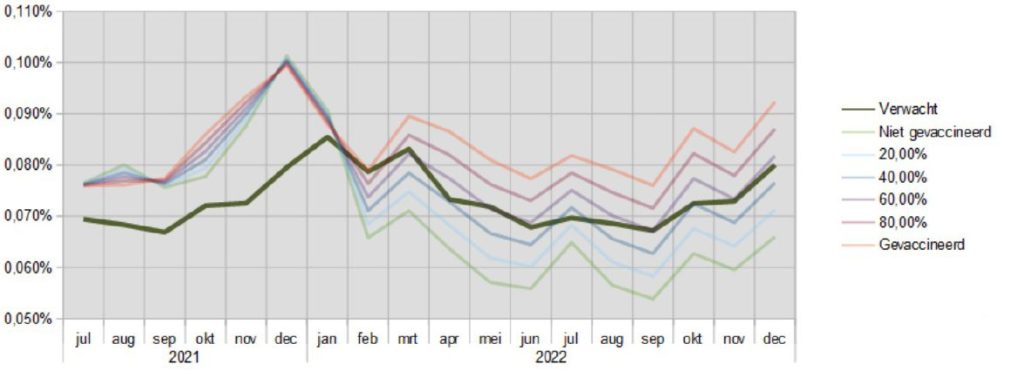
Let's expand the graph above with the expected mortality in the period July 2021 β December 2022. For clarity, the lines from the figure above have been pushed back a bit:

The expected mortality appears to be lower than any other line until January 2022. This implies that in this period the vaccination rate is not a (major) factor in the occurrence of excess mortality. However, how different it is in 2022. From February to December 2022, the expected mortality is somewhere in the middle of the other lines. This implies that if the vaccination rate had been around 50%, this situation would have led to less or no excess mortality in 2022.
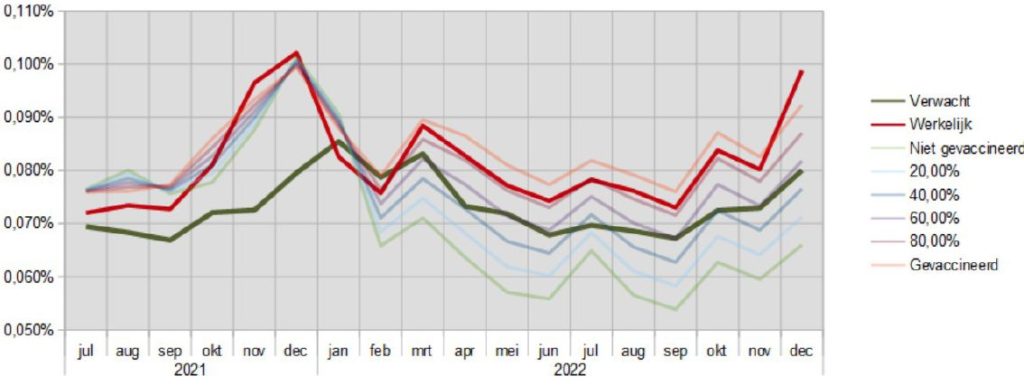
We know that in the Netherlands the vaccination rate for 18+ is around 80%. This means that we expect the actual mortality rates to be close to the 80% line in 2022. The following figure also shows this:

The figure above clearly shows that the actual mortality rates in 2022 are always close to the 80% vaccinated line. Often even slightly above it. For 2021, the actual mortality is always close, sometimes above it, sometimes below it at all lines.
From July 2021 until the end of the year, excess mortality in the Netherlands amounted to approximately 12,000 people. Over the whole of 2022, this was 14,000 people.
Conclusions
- In 2021, both vaccinated and unvaccinated will make a proportionate contribution to excess mortality.
- In 2022, the vaccinated in particular contributed to excess mortality.
Discussion
To what extent is this a true representation of reality? There are many uncertainties:
- Are the data from the UK correct?
- The Netherlands is a different country with a different population composition and vaccination rate. The correction to this may be subject to improvement.
- The moments of vaccination / boosters were not synchronised between the two countries, although this has also been taken into account.
- Is the course of corona and/or flu waves similar in both countries?
In theory, things could look very different in the Netherlands, but we know that corona caused fewer deaths in 2022 than in 2021, while excess mortality was higher in 2022 (and over a much longer period, almost three-quarters of a year). Perhaps another explanation is possible, but it has not yet reached me.
So it certainly makes sense to take a good look at the vaccination status of deceased people in the Netherlands and draw conclusions from that.


Dear Anton,
In line 3, the calculation example suddenly speaks of 600 unvaccinated people. This thinking step went too fast for me. At its core, it's about the number of expected deaths among vaccinated people.
This equivalence is a bit hidden in the 2 previous steps but can be explained more explicitly around the calculation example:
Suppose that injections do not lead to additional mortality, then the expected number of deaths among vaccinated people is equal to the number of deaths among the unvaccinated.
Compliments for your efforts,
Jos
Previously, it said "(under the assumption that vaccinations have no effect on mortality)". That's actually your last line as well. But that also led to protests... I have now tightened up the calculation example a little bit. Hope it's better. They are fictitious numbers (those 600 and 540) that calculate easily.
Immediately below point 2 at the beginning it says:
"Using data on vaccination coverage (defined as ever vaccinated) per day, it was calculated what mortality can then be expected per month among vaccinated people (under the assumption that vaccination does not affect mortality);"
What I would like to know is how the expected mortality was calculated (whether it is about vaccinated or unvaccinated)?
Based on the average of previous years? Does the composition of the population take into account? After all, if a population grows or ages, the average mortality increases and for that reason you also have to adjust the expectation upwards (which is very well founded).
Only then do you have a good insight into excess mortality.
Hi Ron, the expected mortality is not calculated. After all, the mortality of that day is known and the distribution of whether or not vaccinated is also known, both nationally (vaccination rate) and among deaths (to be deduced from the data).
Based on the number of unvaccinated deaths, a proportional number of deaths among vaccinated people is expected. That expected number is compared to the actual number.
Hi Anton,
Agreed, that applies to the first paragraph I quoted, but just before the conclusions, the document also states:
"From July 2021 until the end of the year, excess mortality in the Netherlands amounted to approximately 12,000 people. Over the whole of 2022, that was 14,000 people."
That is what I am referring to. How is this excess mortality calculated?
Or are the CBS figures simply used?
I have previously pointed out via e-mail why I do not consider these figures to be correct.
The gist of that is in my first reaction.
At the beginning of the article, the question of whether mortality among (un)vaccinated people is greater or smaller than can be expected on the basis of historical data does not yet matter.
The vaccination rate determines the expectation of mortality among vaccinated people based on the observed mortality among the unvaccinated.
Only later is the vaccination rate "played with" by allowing it to fluctuate between 0 and 100%. And then you see that at 0% there would have been under-mortality in 2022 (lower mortality than can be expected based on CBS forecasts), there would have been no under/excess mortality at about 50%, while at the current vaccination rate of 80% there clearly is. Please note only 2022.
These numbers have been calculated using the CBS figures.
If I look from the UK figures (i.e. the dark red line, multiplying the percentages of the Y-axis by the population) I arrive at 13,600 excess mortality in 2021 and 12,500 in 2022. So that saves about 10-15%, but yes it's just an approximation.
Kind regards, Hans
Yes, those are roughly the CBS figures (I'll check).
I don't know exactly how the baseline comes about. There are many ways to get closer to the current reality afterwards, mainly with trend lines (including ageing, etc.). Bonne Clock https://twitter.com/BonneKlok is also on top of that.
Until 2021, however, the CBS method worked excellently, despite an ageing population that, according to some, would not have been included. See the excess mortality lines in https://virusvaria.nl/oversterfte-breekt-alle-records/
The discussion is complicated if we begin to question the accuracy of the forecast. So for the time being, we are sticking to mortality figures from CBS. We do fiddle with the with/through Covid relationship, but that's another discussion.
And sorry if I don't respond to everything in a substantive and adequate way, it's really a matter of lack of π time
For me, it was confirmed in the Corona period that forecasts from, for example, the RIVM and all kinds of other "established bodies" (worldwide) can be considered critical.
Anyway, in a month or two I will have new figures available and I will come back to this.
Nevertheless, for the few who still read this thread, if you are interested in my views, please let me know.
ronslockers@gmail.com
You have to consider everything critically. If you also want to discuss, you will have to speak the same language with a number of agreed definitions. If we start at the baseline, we create a new universe in which all basic concepts have a different meaning. Then we will not get to the urgent problem at all. I'll look up your old emails (or email something that has been updated). In itself, I sometimes want to pay attention to 'other points of view'.