
The excess mortality drum has been beating about virus variants for years. Maurice de Hond was the first to respond and this was soon followed by tweets and interruptions from Thierry Baudet, irritation from Minister De Jonge (dangerous misinformation!) and parliamentary questions from Wybren van Haga. Ronald Meester was inspired by the article to demonstrate a Bayesian correlation between vaccination and excess mortality, we had Pieter Omtzigt's motion and that led to a report from CBS/rivm that only confirmed what we already knew. And all because of a tip from a reader.
"Excess deaths" is inmiddels fenomeen dat wereldwijd de aandacht trekt maar nog steeds wordt genegeerd door de legacy media. Als het al ter sprake komt, bestaat men het om te beweren dat er niet zo heel veel oversterfte is, dat het allemaal door Covid komt en vergrijzing en uitgestelde zorg. Dit alles zonder cijfermatige onderbouwing.
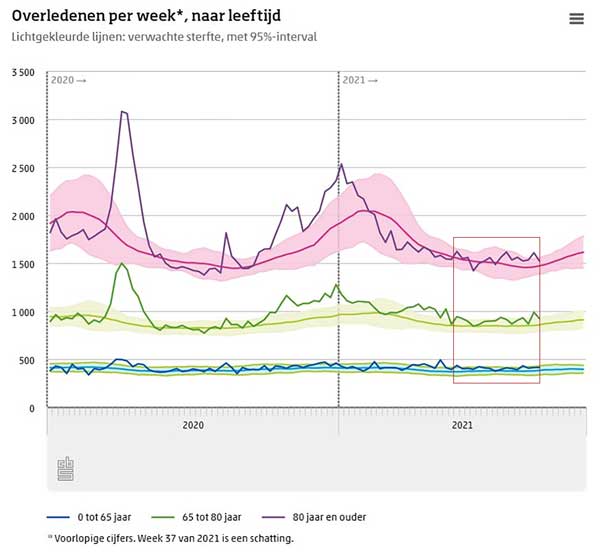
On August 25, 2021, the first Virusvaria article was published in which it was argued that there were alarming excess mortality figures: a world first entitled Excess mortality among the elderly. This mainly concerned those aged 65-80, because that is where the most deaths occurred. (I now see as 'older people' those over 75, as I realize as a 63-year-old) We were in the middle of the summer, there was no Covid. This despite the fact that the weekly margins were only exceeded sporadically - at least according to the weekly reports from CBS: mortality remained within the bandwidth, the statisticians were satisfied.
From intuition to statistics
Naar mijn idee moet overschrijding van de weekmarge een signaalfunctie hebben. Op het moment dat de weekmarge wordt overschreden is dat een teken dat er iets aan de hand is en moet je gaan kijken naar de ontwikkeling van die overschrijding en hoe lang dat misschien al aan de gang is. Op het moment dat je een langere periode beschouwt kun je de marge voor een week niet meer toepassen. Dat leek gezond verstand maar het ontbrak mij aan de statistische kennis om dit inzicht cijfermatig hard te maken. Dan zeggen de dienstdoende statistici: "laat dat nou maar aan ons vakmensen over". Nu oversterfte steeds nadrukkelijker op de agenda staat, stapelen de statistische rode vlaggen zich op dankzij kundige en onafhankelijke rekenaars die de data in context durven zien van langere periodes dan 7 dagen.
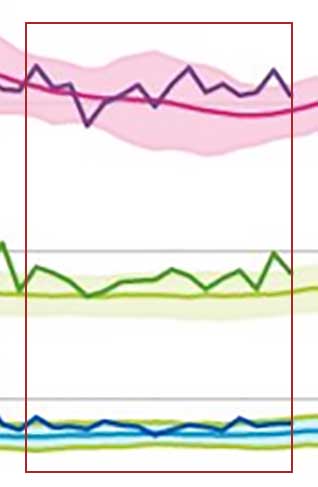
This results in the graph below (thanks to Herman Steigstra) for the period I described last year. From April/May we stayed within the weekly margins again, hurrah... But not within the margins for periods longer than a month.
Below you can see how the excess mortality line is increasingly out of range when you look at the data from April 2021. I previously described how the bandwidth roughly changes if you take longer periods Bandwidths for dummies. Excess mortality also increases in weeks in which excess mortality remains within the weekly margins. And harder than in 2020, the Covid year in which we were not yet protected by vaccination.

We now also have significantly more mortality in 2022 up to and including week 32 than in the same period in disaster year 2020.
More explanation about the calculation model used and comparisons with previous years and 2022 can be read in a blog to be published very soon, led by Herman Steigstra. Follow @SteigstraHerman on Twitter.
CBS reporting on this period
CBS abandons vaccination success story
According to CBS, fewer people died from corona, they reported in November 2021, while more people died. Fewer corona deaths, which indicated vaccination success. But later CBS tried to attribute almost all excess mortality to corona. The vaccinations have therefore worked less well than expected.

They are now left with a remainder in the Large Excess Mortality Report. Approx. 3,000 deaths that they cannot easily write off. There have now become many more. No accountant is watching.
Sober playback or downplay?
CBS schrijft in "Health in times of corona" over de in de grafiek weergegeven periode:
"In de laatste week van april en de eerste week van juni was er kort sprake van oversterfte, maar daarna nam de sterfte verder af. Begin augustus van 2021 nam de sterfte opnieuw toe en was er sprake van lichte oversterfte."
During that period, all excess mortality records were broken.
Mortality per weekly reports
Naast de wekelijkse tabellen geeft CBS op gezette tijden een toelichting op de cijfers. Hieronder de koppen van die berichten (en een enkel eufemiserend zinnetje uit het betreffende artikel. Let op het woordje "net".) Ik tel twee keer het woord "oversterfte": bij week 22 en augustus 2021. Deze hele periode werd gekenmerkt door een ongekende oversterfte met alleen in week 25 een niet-significant dipje tot net onder de baseline.
- Death in week 14 higher than expected
("In week 13 was de sterfte weer about the same to the expected mortality, the estimate in week 14 is available just above." ) - Death in week 17 higher than expected
("Just outside the interval of usual fluctuations (based on the estimate there is therefore excess mortality))". - Mortality in week 19 was light decreased
- Death from week 20 also occurs in people under 80 decreased
- In week 22 excess mortality again
- Death in week 23 decreased
- Mortality in week 24 remained approximately the same
- Under-mortality in week 25
- In the second wave, almost 11 thousand more people died than expected
- Died weekly in July something more 65 to 80 year olds than expected
- Again in August excess mortality
CBS headlines positive news in almost half of the weekly reports during this gigantic excess mortality period. From respected institution to narrative propagandists.
Dat is dus "Beleidsondersteunend" maar ik denk niet dat het ooit zo was bedoeld.
Source: CBS and Wayback Machine

Thank you for your clear analyzes Anton. It's good that there are people like you who use... figures, science and logic to uncover the truth. I often find you even very cautious in your conclusions. You are so much more professional than those vaccinators who pollute the media with their unscientific state propaganda based on lies, conflicts of interest, fear and gibberish. Thank you very much Anton and keep going!
I was working on a new article with Bonne Klok in which I need a graph and while searching I saw this comment again. Gives extra energy, thank you Lars!!!