
CBS tries to predict as accurately as possible. In relatively quiet times, without disasters, wars or other attacks, that prediction could be used as a standard for approximately how many people would 'be allowed' to die in the coming years. If the actual mortality was above or below it, we spoke of excess and undermortality. We called that prediction the 'baseline', on the basis of which we could see whether there was too much or too little mortality. That is no longer possible.
Earlier I drew the parallel with body weight: we can predict what the average BMI will be in the coming years. However, that does not mean that it will become the new standard. Let alone that it is the desired situation. Even if more than half of the population is overweight, this does not automatically become the norm for a healthy weight. A different standard has been set for this1https://www.voedingscentrum.nl/bmi which is separate from the annually observed values. If that BMI standard were not there, it would be impossible to claim that more than half of the population is overweight or that obesity is becoming an increasing problem.
How different it has been with mortality in recent years. Actually, we should be talking about mortality rates by age group and by gender and not about the mortality rates counted, because those figures are also influenced by factors such as changing population size (including migration) and age distribution (ageing). The fact that we see rising trends in the graphs below is mainly due to this. But how do we see that future? I have some CBS forecasts compared with each other.
In the forecast from 2008 we see a straight line (light grey). In the long run, that can't be right. It should be a curved line, but the curvature is so slight in a period of less than two decades that it will not make a decisive difference to what we want to argue.
Forecasts compared
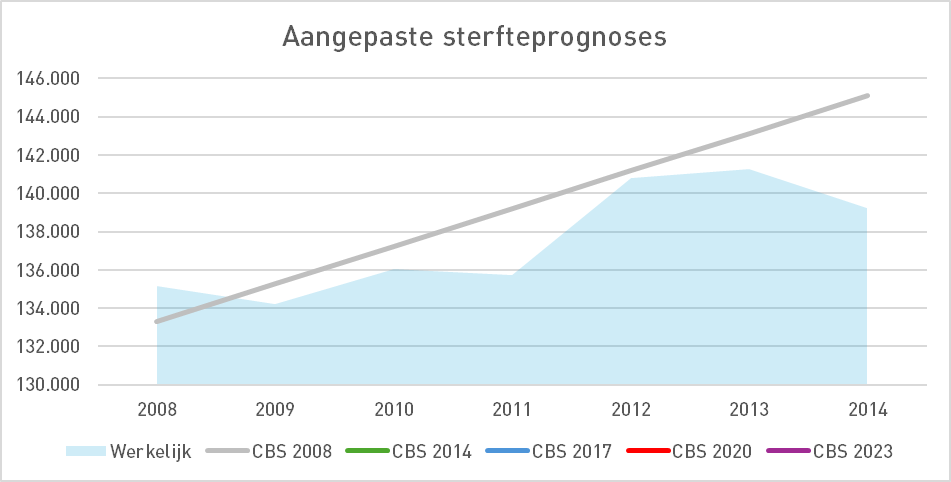
The CBS forecast from 2008 resulted in structural undermortality: the blue area does not even touch the predicted values every 6 years thereafter. The actual mortality level was considerably lower.
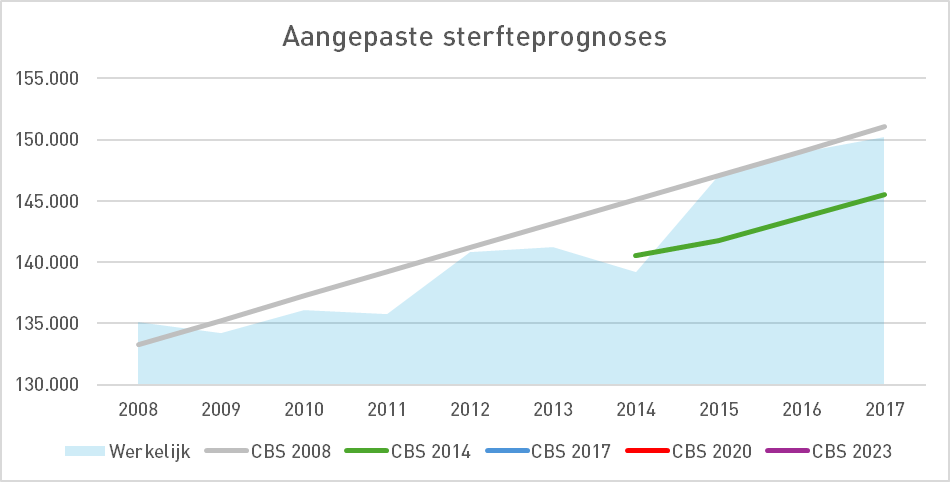
In 2014, we see how the forecast has now been adjusted. The green line. What was known at that time from 2014 was already included (we can see that in 2020 as well). If you extend that green line to the left, you're in the perfect place. But it was not easy: in the following years, mortality was again too high and was in line with the old trend line of 2008, while 2015-2016 moderate flu years goods. So why not somewhere in between?
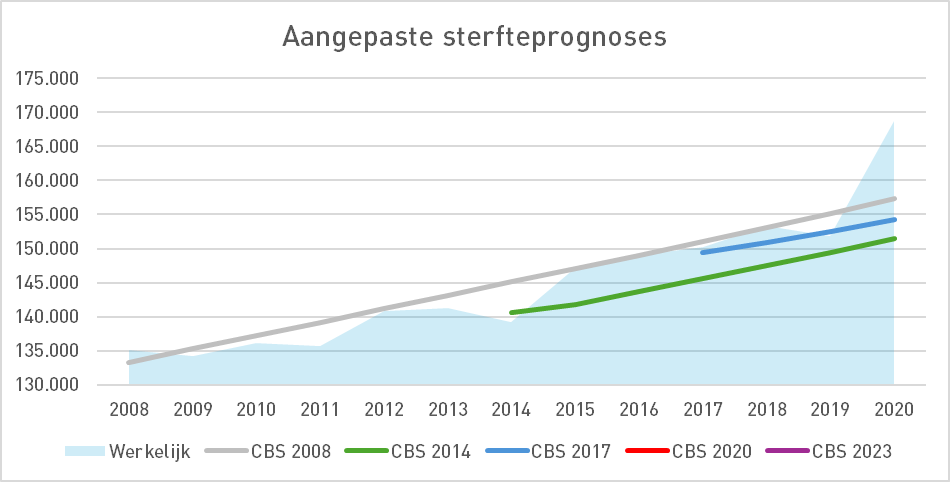
And indeed. The blue forecast was published in 2017. That seemed to go quite well, but then came 2020: Covid. A (very) strong flu. This was included 👇 in the 2020 'forecast' itself
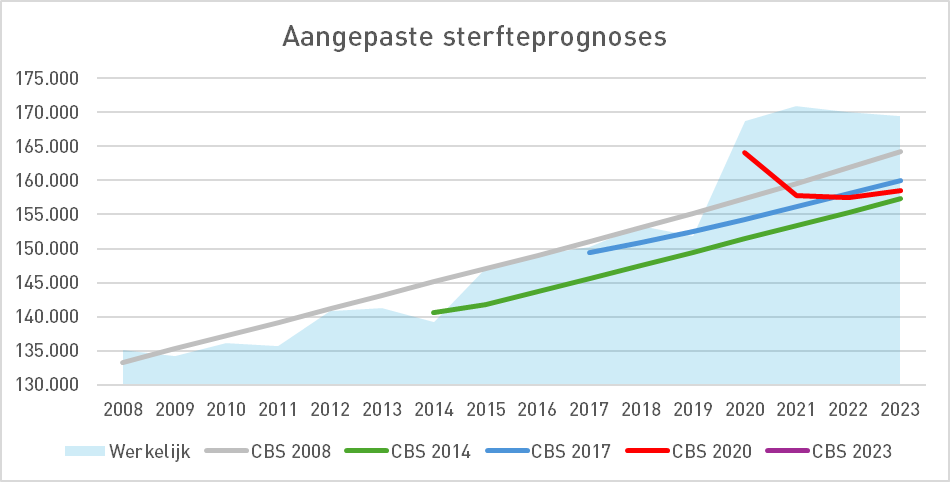
Forecast-2020 was published in December 2020. But 2020 turned out to be even higher. It was expected that this would linger a bit in 2021, but after that you should see some undermortality again. The red line therefore falls below the forecast of 2017, towards that of 2014 (which had previously turned out to be too low). This resulted in an insane excess mortality. RIVM had to give it a twist. This was no longer a statistical problem, this was a health problem.
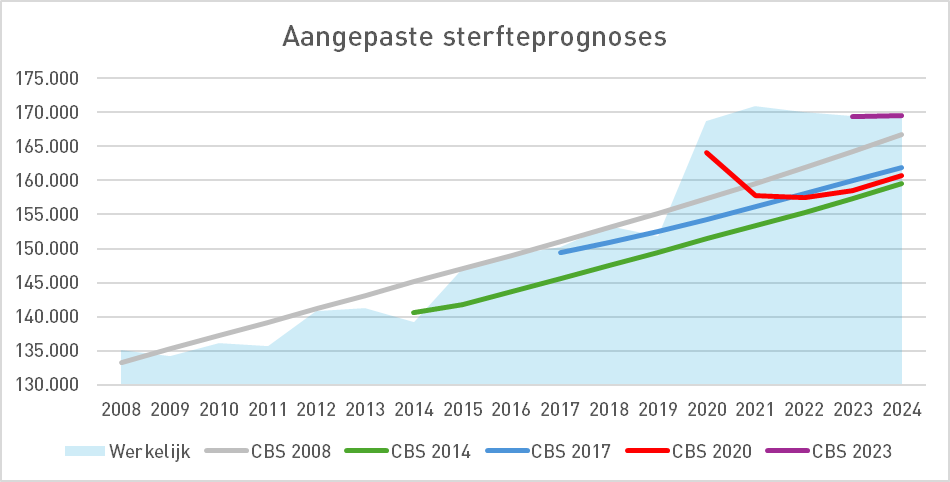
For 2024 and beyond, which is no longer in the graph, CBS does not expect a quick return to 'normal', whatever that may be. (I have put the total for 2024 in graph at 169,800, that is not final) [It became 172,000, ed.]
Can we ask ourselves why they thought it would level off quickly in 2020, and not now? Why not...? Do they not want to contradict the RIVM or do they know what is going on?
In other words, according to CBS (in the latest forecast dated 2023), for 2023 and 2024 combined:
- There are 21,938 more deaths than what CBS had calculated in 2014.
- 16,993 more deaths than what CBS had calculated in 2017.
- There are 19,622 more deaths than what CBS had calculated in 2020.
[These figures have actually increased by 2,100, for 2024: 28 Dutch people per day, ed.]
That is 23 to 30 deaths per day MORE than according to previous calculations. What happened between 2020 and 2023 to reduce that increase of almost 20,000 [22.700] deaths? We don't know. Researchers from the Princess Máxima Centre suggested some ideas, but were sharply rebuffed.
So the mortality expectation has suddenly risen significantly. What does CBS say about the increased mortality expectation via vzinfo.nl?
Annual mortality continues to rise, reaching around 210,000 by 2055
https://www.vzinfo.nl/sterfte/toekomst
As a result of the aging population of the post-war baby boom, the number of deaths will continue to increase in the coming decades. While there were still about 170,000 deaths in 2022, it is estimated that in 2055 there will be about 210,000. From 2055 onwards, absolute mortality is expected to start declining again.
Nothing at all about the skyrocketed expectation that has nothing to do with the baby boom. After all, that baby boom was perfectly predictable. Do they perhaps say something about Covid on that page? Yes:
In the corona years 2020 and 2021, there were approximately the same number of deaths among men and women.
https://www.vzinfo.nl/sterfte/toekomst
Not a word about the increase in mortality that we are in the middle of. The term "excess mortality" is hardly applicable anymore because both CBS and RIVM apparently take the unheard-of increase into account in their expectations. Statements? I paraphrase: "Probably Long-Covid. After all, it can't be anything else."
What needs to be done is a health standard, a 'norm mortality'. Predictions are otherwise meaningless. Sudden deviations from the norm mortality, incidental or multi-year trend breaks, must be explained and proven irreparable before the norm mortality is adjusted accordingly. Criteria are needed for this, because gradual deviation is inevitable. It would even be something for an independent committee that advises the Ministry of Health, Welfare and Sport.
Herman can go back to work! In fact, he IS already at work. 😊
EDIT: The first response to the plea can be found here
Sources:
Go to https://opendata.cbs.nl/statline/#/CBS/nl/ and search "Prognosis of deaths" (with quotation marks)
2023: https://opendata.cbs.nl/#/CBS/nl/dataset/85753NED/table?dl=B15DC
2020: https://opendata.cbs.nl/#/CBS/nl/dataset/84882NED/table?dl=B15DD
2017: https://opendata.cbs.nl/#/CBS/nl/dataset/83794NED/table?dl=B1604
2014: https://opendata.cbs.nl/#/CBS/nl/dataset/82815NED/table?dl=B15E1
For previous forecasts:
2008: https://opendata.cbs.nl/#/CBS/nl/dataset/71867ned/table?dl=B1953 up to and including https://opendata.cbs.nl/#/CBS/nl/dataset/71867ned/table?dl=B1954
References
- 1https://www.voedingscentrum.nl/bmi
The core is in the difference in the prognosis versus mortality probabilities.... Actuaries calculate mortality probabilities due to Pensions, AOW and Life Insurance. If the mortality risk (you die earlier) would increase, which the prognosis suggests, then there is more in the coffers of the Pension Funds, the AOW (= government) and Life Insurers.
It's not about the "people"it's about the money, because the people die earlier and the money has to go up or roll.
The whole COVID discussion is about securing pension funds for a greedy "elite" instead of ensuring a dignified retirement income. First from 70% final pay to average pay and now without guarantees to a WTP with a much higher mortality rate. Do the math.. 😉
If I'm not mistaken, Statistics Netherlands predicted in 2920 that life expectancy would pause for a while and increase after the pandemic as before. Little did they know what was at the door.
Should be 2020 of course
Indeed, see the red line.
Why not look beyond our borders?
See: https://open.substack.com/pub/stevekirsch/p/santa-clara-county-non-covid-all?r=tsesp&utm_medium=ios
Why not look beyond our borders?
See: https://open.substack.com/pub/stevekirsch/p/santa-clara-county-non-covid-all?r=tsesp&utm_medium=ios
Is the calculation based on the number of extra deaths per day correct? 19622/365=54 deaths per day.
'2023 and 2024 together'
ah okay, thanks!
Blood values from lab tests use a similar principle. They don't look at what would be healthy, but at what is average in NL. There, the standards are also set pragmatically so as not to wake us up unnecessarily.
Isn't it smart to sit down with an actuary and combine their expertise in this field?
Who knows, maybe good things will come out of it in terms of calculation.
I wouldn't know, I don't really have any questions about how they do it. The difference is that their forecast is not intended as a barometer for public health. Their task is to provide a prediction that is as close to reality as possible.
We look at the trends in mortality probabilities per age over the years and calculate them for each (also future) year according to the composition of the population. After all, it also changes slowly. If there is a break in the trend, the AG will have to adjust the forecast as soon as possible.
For us, it is an alarm signal.